Asymco

Asymmetric Intelligence

Research

  1. The value of the OS X monopoly

    Research · 39 comments

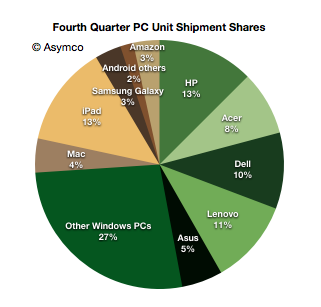
    In January I noted that there were more iPads sold by Apple than PCs from HP, the largest PC vendor in the fourth quarter. Including all tablets, this is the distribution of market shares by units shipped.

    Note the different color palettes for Windows and non-Windows.

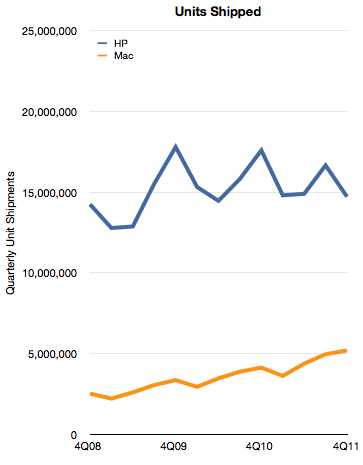
    By the metric of tablets+PC's Apple appears to be the leading vendor. However, if we consider only the Mac, Apple is still well behind. The historic unit volumes of the two is shown below:

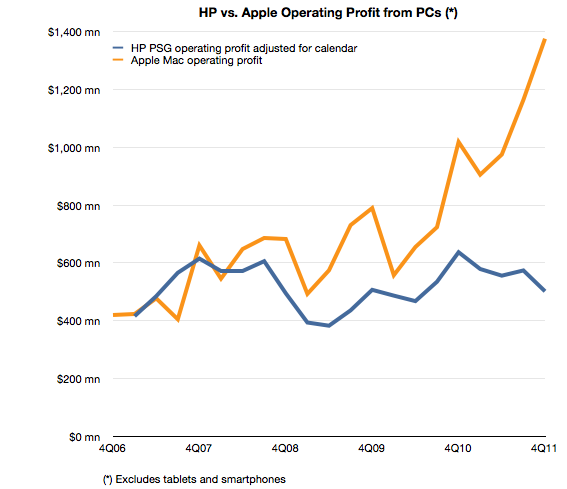
    Although Apple has nearly doubled its shipment volumes since 2008, it's still only one third that of HP. In addition to comparing volumes, we can also measure profitability. In this case HP's PSG (Personal Systems Group) reports operating profits and we can estimate the same from Apple based on a gross margin estimate and an operating expense estimate (as percent of sales).

    The comparison looks like this:

    The operating profit for Apple is 2.7 times higher from a third the units. This gap is a result of a vast difference in profitability. HP's operating margin for PCs is 5% while Apple's is 21%.

    A few days ago I highlighted that Apple's iPhone yields disproportionate profits because of the way it performs the jobs its hired to do by consumers and operators.

    With the Mac the story is that Apple's OS X is primarily responsible for delivering quadruple hardware margins vis-a-vis the most successful PC vendor.

    Both iPhones and Macs are sold as hardware products and the entire econometric analysis of Apple depends on hardware cost structures. This is because hardware lends itself to easy measurement. However, a casual observer would be stumped by a comparison with competitors which cannot come near the profitability Apple enjoys. How can the same bundle of components (admittedly mostly off-the-shelf) be sold at triple the margins?

    It comes down to software. Apple has a monopoly on iOS and OS X and charges for it through its hardware. That's a very valuable monopoly. It's worth at least $1 billion per quarter.

  2. iPhone sine qua non

    Research · 81 comments

    Last week I made an attempt to measure the iPhone's manufacturing cost given new data points from the Foxconn field trip. The post generated a great amount of new knowledge and the feedback was very valuable.

    The main value to me came from stepping back and looking at the entire cost and value structure for the iPhone. Putting costs into perspective is as valuable as knowing what they are.

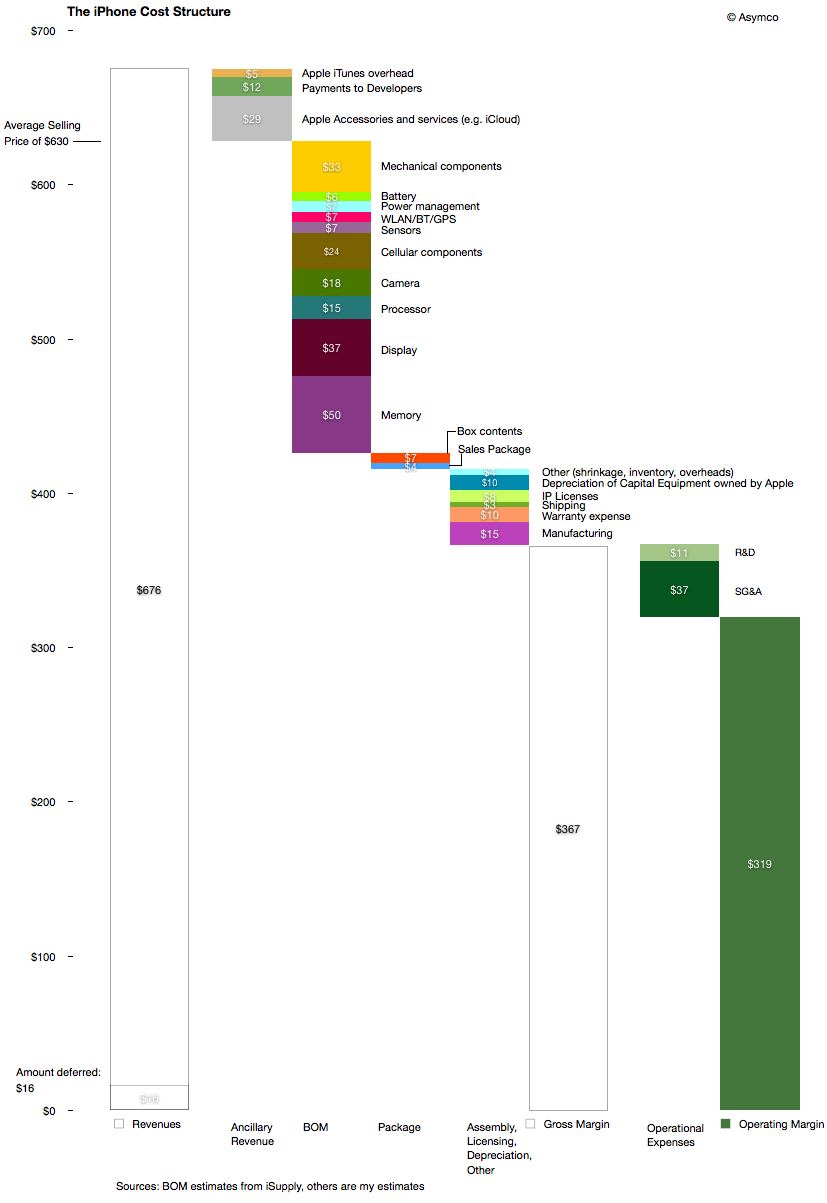
    The following diagram shows my estimates for this cost structure for the fourth quarter given both bill of materials estimates and the other parts of the cost of goods sold and operational expenses and even ancillary sources of revenue.

    Source for BOM estimate: iSupply.

    There are several observations easily made from this view:

    1. The manufacturing cost ($15 may be very generous i.e. high) but it still amounts to a tiny fraction of the device cost and hence value-add. The direct labor part of that cost is tinier still.
    2. Depreciation on capital equipment (Apple owned) amounts to $10 per device, probably higher than the direct labor cost.
    3. External developers as a group receive more app income than the salaries and costs associated with Apple's own developers working on the product.
    4. The gross margin percent is 58%.
    5. The operating margin is estimated at 51%

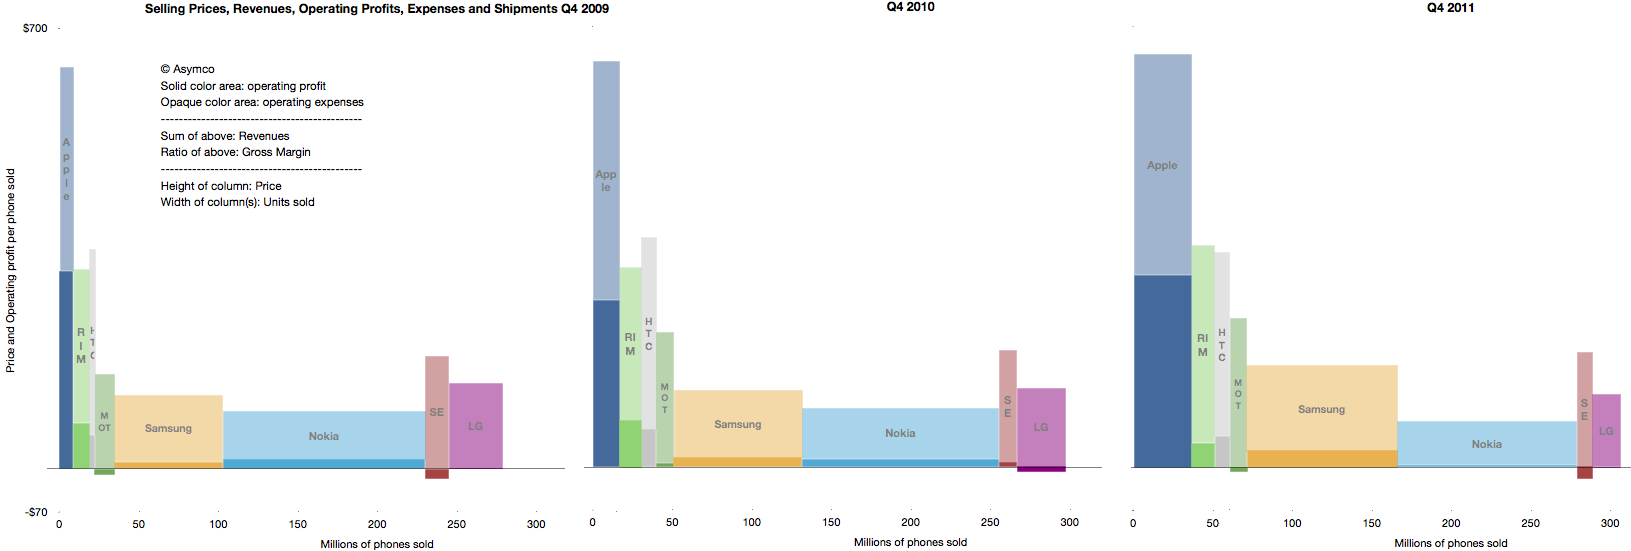
    The high margin that the product generates is even more surprising given the industry average as seen in this summary view of the industry's performance over three years' fourth quarters.

    The operating margin is the ratio of solid colors to the entire bar.

    As someone pointed out on twitter: one of these is not like the others.

    The question should be: How is this possible? What does this product have that gives it such a pricing advantage? Note the the ratio was preserved through the three years shown and has persisted for nearly five years.

    The answer to this paradox is in data that is not visible in any of the diagrams above: The largest revenue attached to the iPhone comes into the mobile network operators. We don't have global averages but the revenue the iPhone generates over its lifetime is probably two to three times the revenues that Apple directly receives. The ARPU iPhones are attached to allows for a substantial subsidy, but more importantly, loyalty (or churn)

    As seen in the small but clearly visible US market, being an operator having  iPhone exclusivity generates above-average growth and being the only operator to be excluded from the product generates above average subscriber losses.

    It quickly becomes obvious that ranging the iPhone has moved from being an advantage to not doing so becoming a serious disadvantage. The product and its high up-front costs are "hygiene factors" for operators. The sine qua non status means that it can still be priced with the extraordinary built-in margin shown above.

  3. A three year view of Apple's fourth quarter

    Research · 22 comments

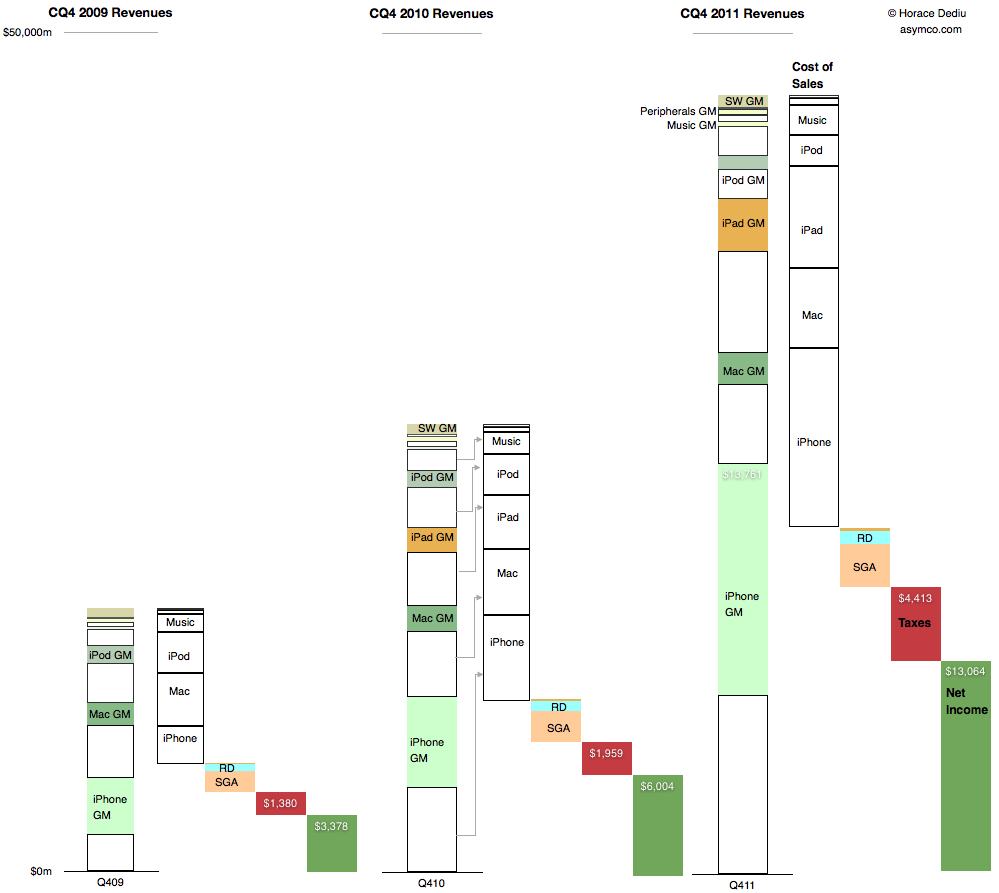
    This is a summary view of Apple's income statement for the fourth quarter of 2009, 2010 and 2011. The full size is 999x893 pixels. Click on image below for full size bitmap.


    The convention used is to show revenues in the first column, cost of sales in the second followed by operating expenses, taxes and net income in the last (dark green) column.

    For the revenue column, individual products are shown stacked from highest to lowest revenues and further divided into variable costs and gross margin.

    The costs are then drawn separately leaving net income (or profit). Ratios between various quantities can be visualized:

    • Gross Margin percentages are ratios between the empty boxes and their colored counterparts
    • Operating expenses as a percent of sales are the third column in relation to the first.
    • Tax rates are the fourth column as a percent of the fourth plus the fifth, etc.
    • Finally, the rate of year-on-year growth in all these quantities can be seen by looking through column sets left to right.

    Given this perspective it's perhaps more obvious how much and from which business Apple has grown.

  4. Update on Asymconf

    Research · 11 comments

    Registration for Asymconf opened one week ago and about 42% of the available capacity has been reserved. For those who have registered and those who are considering registration, this is a brief introduction to how the event will be conducted.

    The method of presentation and participation was originally designed as a teaching method[1]. What we're going to do is a very simplified approach of the case method first introduced in the teaching of law and later adapted to the teaching of business administration. The key difference in this method vs. the classic lecture is that there is no assumption that a right answer exists and hence that there is no greater value placed on the lecturer vis-a-vis the audience.

    The event is therefore performed by three key components:

    1. The facilitator
    2. The case team
    3. The spectators

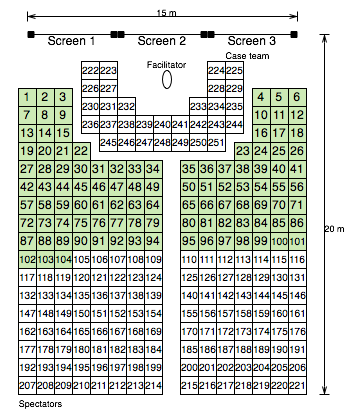
    The  diagram shows the venue and rough placement of the components (to scale and with reserved seats highlighted in green).

    The facilitator's role is similar to that of a conductor of an orchestra. It's primarily to help the individual instruments working together but not to make the music himself.

    The "music" is primarily produced by the case team. This will be a group of about 30 persons arranged in a semi-circle around the facilitator. They will "debate" a case that will be published as a blog post in advance of the event. They can put forward information, agree and disagree and generally try to uncover meaning or truth.

    The case team, like an orchestra, should be diverse. They are not expected to be subject matter experts but to bring their particular expertise to a common problem. In fact, subject expertise in one member can be seen as a problem since it could discourage others from also participating.

    The case team will be pre-selected from the pool of spectators and will change from case to case.

    The reason we ask your area of expertise during registration is so that we can create diverse case teams, not to assign you to a team that has a particular experience.

    In addition to the discussion, key data and visual information will be projected onto three screens visible from all seats. The visuals will be generated by custom-built iPad applications and will be interactive and wireless and thus mobile and usable by the case team and facilitator in real time.

    Lastly, there is no requirement to participate. Registrants can opt out of any case team and can spectate only if they wish.

    The objective of the event is to learn. Both for the audience and for the facilitator. The event is designed to be both a performance and a lesson and a learning experience for all. It is, I hope, the Asymco experience, live.

    You can register here: www.asymconf.com.

    ---

    Notes:

    1. You can read about the case study method here.


  5. How much does it cost to manufacture an iPhone?

    Research · 98 comments

    An iPhone generates approximately $650 in revenue for Apple. This figure has remained fairly steady over time. Using deduction from overall margins, it's possible to estimate the gross margin on the product to be around 55%.

    That means that the cost of goods sold (COGS) for the iPhone is about $293. Is that a lot? Where does that money go? What else does it tell us about how the company operates?

    To find out we need to understand the cost structure of phone building.

    Typically there are four main categories of costs for a phone:

    1. Bill of materials (BOM). This represents the cost of the components that go into the device. These are paid to suppliers.
    2. Transportation/warehousing. This is the cost to transport and store the product before sale. This is paid to shipping companies and warehousing.
    3. Manufacturing cost (including labor). This is paid to contract manufacturers.
    4. Warranty expense. This is paid back to customers for returned product that can no longer be sold.

    We can estimate a device's BOM through a teardown analysis and there are firms that do this. Usually this offers enough competitive insight into the cost structure and hence gross margin because the other items are predictable in that they do not vary greatly from product to product.

    In the case of the iPhone the BOM has been fairly steady around $200 for a new model. That leaves quite a big gap to the overall COGS of $293.

    Could transportation, manufacturing and warranty costs really add up to $90 for an iPhone?

    The manufacturing costs are not usually discussed in detail openly because the processes used are secret. However, thanks to and ABC Nightline report,  some clues have emerged about how iPhones are built and, although incomplete, they offer some interesting bounds.

    One data point recently published is that the iPhone takes 24 hours to be built. Of that 6 to 8 hours is spent in "burn-in" to install and test the software and components automatically. This leaves about 17 hours unaccounted for in the throughput time. Could this time be spent in labor intensive operations? In the ABC report the wage of workers on the line is given as $1.78/hr[4]. 17 hours of labor input would imply $30 labor cost per iPhone. That seems a lot higher than the industry (i.e. iSupply's estimate is $8 for manufacturing cost.)  This is an upper bound. Obviously, those 17 hours could be spent in automated operations which were not shown or simply sitting idle, waiting for a process to begin.

    Is there another way we can check this?

    There is. The ABC report also mentioned that there were 141 (presumably labor) work steps in the production for an iPhone. If we knew the time each step took we could obtain another estimate. For example, if each step in the human assembly process took 3 minutes[2] then human hands will touch the iPhone for 423 minutes or about 7 hours. This would imply a labor cost for an iPhone of about $12.5. If each step was longer or shorter, the cost would vary accordingly.

    Unfortunately we can't be sure of the exact cost. However, these recent clues offer some interesting bounds and observations[3]:

    • Manufacturing costs for the iPhone are likely to be much higher than comparable devices. This is partly because of the design of the product and partly because of the quality testing needed.
    • Those costs are likely to range between $12.5 and $30 per unit.
    • The iPhone manufacturing costs are likely to be twice or three times the average.
    • Labor costs are still a small part of the overall cost structure at between 2% and 5% of sales price.
    • The high level (141 steps) of human interaction in the process could be automated however, the fact that it isn't implies that the cost of automation would be higher and the flexibility of the automated process would be lower. It's much more likely that the process is a mixture of labor and robot intensive sub-processes.
    • Even if we assume a $30 manufacturing cost, there is still $60 that needs to be allocated to transportation and warranty expense. These require sanity checks as well.

    ---

    Notes:

    1. Note that R&D (engineering and development) and Sales, General and Administrative (e.g. Marketing) costs are not part of this cost structure. They are considered fixed costs and are not allocated to individual units of production.
    2. Note that during the ABC video there was mention of automated instructions being broadcast to the line. This implies that each worker is working on a "clock cycle" and each work stage is timed to take an equal amount of time. This clock cycle time is crucial in understanding the cost structure. One further clue to this cycle time comes from the iPad output rate per worker. This was mentioned in the slide show to be up to 6,000 units per day. Assuming 10 hours of working time per day means 600 units per hour or 10 per minute. This seems extremely high as the worker would have to handle the product for only six seconds. [UPDATE: Apple clarified this point: "In manufacturing parlance this is called deburring. Her line processes 3,000 units per shift, with two shifts per day for a total of 6,000. A single operator at Ms. Zhou’s station would deburr 3,000 iPads in a shift"]
    3. As this post shows the amount of information that can be obtained from observing operations can be significant and lead to competitor advantage. It should be clear why this is not something done willingly.
    4. UPDATE: In a statement Foxconn clarified wages as "We have over 75 percent of the employees in the category of earning at least 2,200 RMB ($349/month) basic compensation standard. That means they are earning 13.75 RMB ($2.18) per hour".
  6. The opportunity cost of Windows Phone

    Research · 69 comments

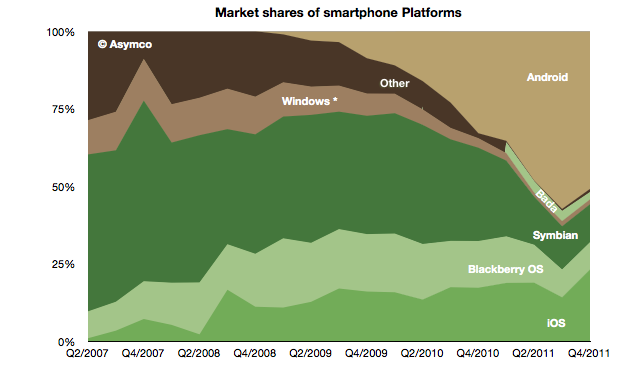
    The global mobile OS market shares for Q4 shows a continuing (but diminished) leading share.

    At the end of last year Android's unit share reached 51% which is down from about 57% during the third quarter. iOS reached 23%, followed by Symbian at 12%, RIM at 9%, Bada at 2.4%, Windows Phone at 1.6% and Other at 1%.

    When seen on a year/year basis Android gained 18 points of share in Q4 while Symbian lost 18 points. iOS gained 6 points of share and RIM lost 6 points. Bada gained 2.5 points and Windows lost 1.5 points.

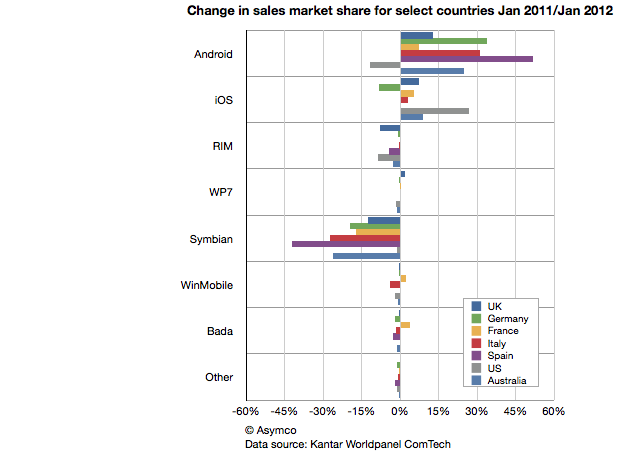
    This symmetry can also be observed in another set of data. Published in The Guardian Kantar Worldpanel ComTech data shows the OS share changes for January on a year/year basis for a select set of countries.

    Android share gains do seem to be mirrored by Symbian share losses on a country-level.

    This should be most interesting to Nokia and Microsoft as both have a lot riding on Windows Phone replacing Symbian sales. If there should be a recovery in the fortunes of these companies, it would seem that their strategies should focus primarily on stemming and then reversing the losses to Android.

    Microsoft's strategy of increasing the cost structure for Android through IP licensing is certainly part of this picture but it's a slow process to turn that disincentive for Android into a large incentive for Windows Phone.

    Indeed, the speed with which Android handsets can be developed seems to be a key value of that operating system and one for which Microsoft does not have a good answer.  Nokia is now one year into its commitment to the Microsoft platform and it has a very limited portfolio to show for it (and limited sales as well.) As a result, Nokia's Symbian business evaporated very rapidly. More rapidly than the company anticipated.

    The dilemma for other vendors may well be how long will it take for them to develop a replacement for their Android portfolio in Windows Phone.

    The opportunity cost of this switch is subtle and insidious but may be the root of why we don't see a stampede toward Microsoft. Conversely, Android contract-free, implement-at-will availability may be its greatest selling point.


  7. App developers receive $12 for each iOS device sold

    Research · 38 comments

    One of the more interesting numbers reported by Tim Cook during the last earnings conference call was the total payment to developers during the fourth quarter. This is the first time that Apple reported a quarterly payout to developers.

    The figure was $700 million and it was mentioned in reference to the total payments to date of $4 billion. The $700 million is interesting at least because it gives an idea of what Apple obtained in total sales of Apps. As it retains 30% and pays 70% to developers then it follows that it retained $300 million and the total "gross" sales was $1 billion in Q4.[1]

    The $700 million is interesting for another reason. The $1 billion in gross income can be tested against another set of data. As the countdown has already started, sometime in February Apple will report 25 billion total apps downloaded. The last such milestone was October 4th when it reported 18 billion downloads. Assuming that they will cross 25 billion by February 25th, then we can obtain an estimate for the download rate per day: about 48.6 million apps/day.

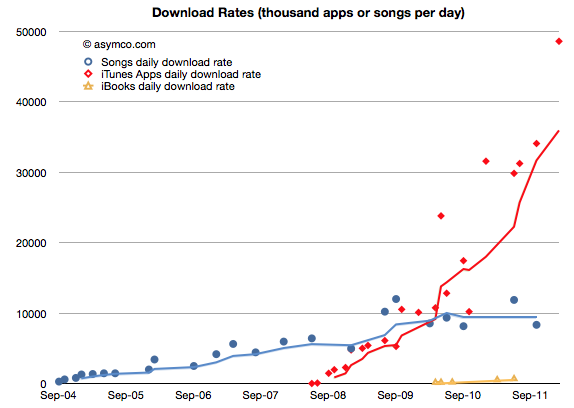
    That is a figure we can plot historically:

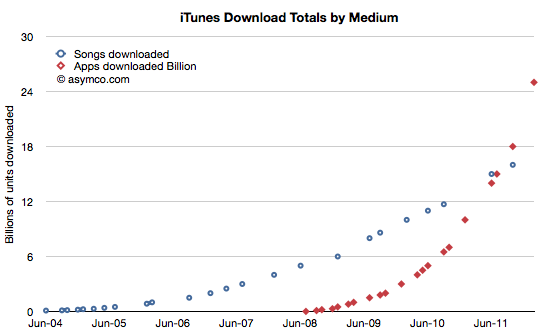
    I plotted it in relation to the songs download rates obtained through a similar method. Although we don't have an update on total songs downloaded, the rate is unlikely to have accelerated as much as apps did. The following charts also shows the reported total downloads by media:

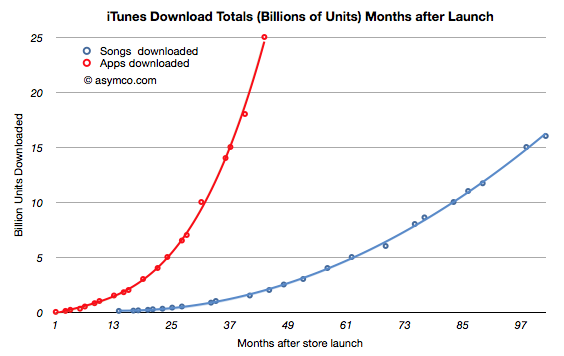
    Normalizing to the same starting date, the two media ramps are shown below:

    But back to the figure of $700 million paid to developers and the implied $1 billion in gross revenues. Taking that figure and dividing it by duration of the quarter yields a figure of $310 million per month gross app revenues. The 25 billion downloads to date paired with the $4 billion in payments to developers gives us an approximate revenue per download of 23c. Computing the monthly revenue from the 48.6 million/month rate we get about $316 million per month. Pretty close to the $301/mo that the quarterly payout implies. This therefore also confirms the 23c per download (it looks a bit high but not by much.)

    So the $700 million payout and the $4 billion payout to date and the 25 billion downloads all fit together as consistent pieces of a puzzle that give insight into the iTunes economy.

    1. Apple reported nearly $7 billion in iTunes stores revenue (though the apps were only counted for the 30% agency fee.) during 2011.
    2. If gross revenues were measured, the iTunes economy was about $10 billion in 2011.
    3. Payments to content publishers were in the vicinity of $7 billion of which $2.1bn was paid to developers.
    4. Operating costs for iTunes were therefore approximately $3 billion/yr.

    One other interesting result: Since iOS devices started shipping, there have been over 335 million units sold. As 25 billion apps have been downloaded into them then about 75 apps were downloaded for each unit sold. Since we know the average price (23c) and the payout ratio (70%) then all this boils down to the fact that each iOS device generates $17 of iTunes income from Apps alone. That also means that each iOS device sold results in a minimum payment of $12 to iOS developers.

    I've noted that Apple should be valued as a recurring payment from a satisfied customer base. A contributor made a comment that summarized it well: the payment schedule is approximately $1/day per computing unit (device or computer or tablet).

    Now it becomes clear that Apple should also be seen as a recurring ecosystem payment system. Given a 24 month lifecycle, the amount is approximately $0.5 per device per month.

    In other words, if you are an iOS developer you should note iOS device sales and use the rule of thumb that each one sold creates fifty cents of monthly income for you and your peers to share.

    ----

    Note:

    1. Apple reported its iTunes income (as the anachronistic "Music" line item in its Income Statement) as $2.027 billion in Q4.It would be tempting then to think that Apple got $1 billion from apps and $1 billion from songs and videos and iBooks. This is not the case however.
      Apple does not report all its app income (what I call gross income). Under the "agency" model of retail sales it reports only the part it retains, keeping the 70% paid to developers off its books. Therefore, of the $2 billion in iTunes income, only $300 million were actually booked from apps. That therefore implies that Apple's "everything-but-apps" iTunes revenue was $1.7 billion.
      Note however that the non-app income is mostly gross income and the payouts on that income will be significant (as much as 90% depending on many factors).
  8. Apple sold more iOS devices in 2011 than all the Macs it sold in 28 years

    Research · 218 comments

    Tim Cook on the 55 million iPads sold to date:

    This 55 is something no one would have guessed. Including us. To put it in context, it took us 22 years to sell 55 million Macs. It took us about 5 years to sell 22 million iPods, and it took us about 3 years to sell that many iPhones. And so, this thing is, as you said, it's on a trajectory that's off the charts.

    via Transcript: Apple CEO Tim Cook at Goldman Sachs - Apple 2.0 - Fortune Tech.

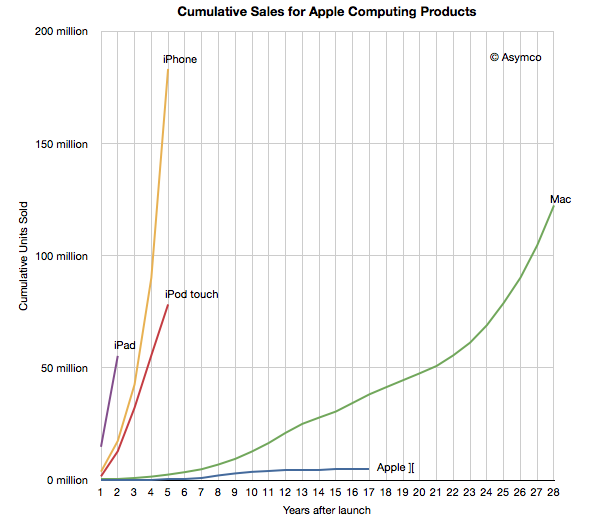
    That gave me an idea. Here is a plot of each major computing product Apple sold throughout its history shown as a cumulative total since product launch.

    The iOS platform as a whole reached 316 million cumulative units at the end of last year. The iOS platform overtook the OS X platform in under four years and more iOS devices were sold in 2011 (156 million) than all the Macs ever sold (122 million).

  9. The iPhone opportunity: a visual update

    Research · 60 comments

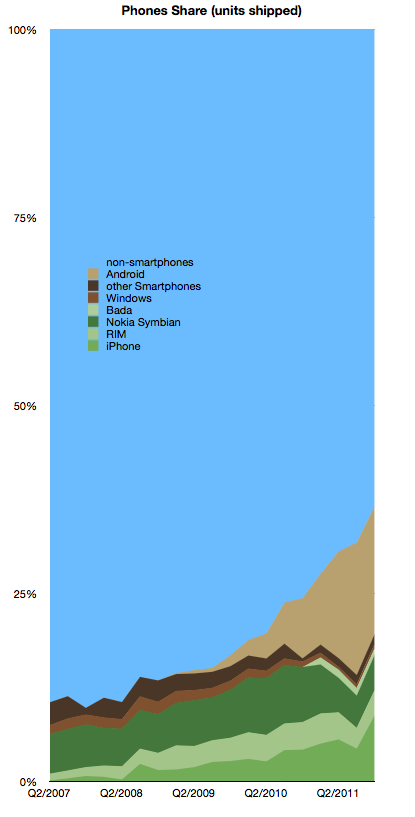
    In yesterday's talk Tim Cook described the opportunity he felt Apple faced. To readers of this blog this opportunity has been regularly illustrated, at least on a quarterly basis.  Here is the iPhone opportunity relative to other platforms:

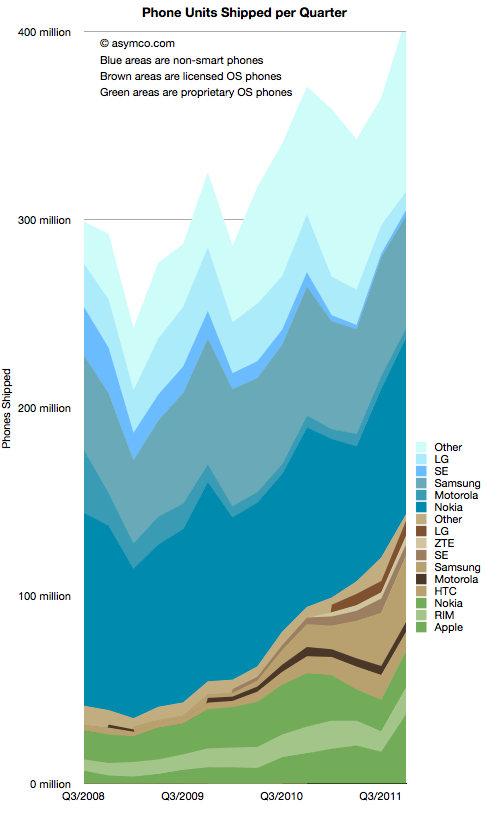
    In absolute units by vendor, separated by smart and non-smart phones, the data looks like this:

    The pattern of smartphone growth remains consistent even though there was a temporary dip in Q3 for the iPhone (and hence for the green-shaded proprietary OS phones.)

  10. Tim Cook on the "Law of Large Numbers"

    Research · 68 comments

    Q: 37 million units of iPhones shipped. When do we run into the Law of Large Numbers? What are the growth opportunities coming up?

    A: 37 million is a big number. It was a decent quarter. It was 37 million -- more than we'd ever done before. We were pretty happy with that, but let me give you the way I look at the numbers. As I see it, that 37 million for last quarter represented 24% of the smartphone market. There's 3 out of 4 people buying something else. 9 out of 10 phone buyers are buying something else.

    Handset market is projected to go from 1.5 to 2 billion units. Take it in the context of these numbers, the truth is that this is a jaw-dropping industry with enormous opportunity. Up against those numbers, the numbers don't seem so large anymore. What seems so large to me is the opportunity.

    What we're focusing on is the same thing we've always focused on. Making the world's best products.

    We think if we stay laser-focused on that, and continue to develop the ecosystem around the iPhone, that we have a pretty good opportunity to take advantage of this enormous market.

    Q: The biggest opportunity is the emerging markets. Large portion of that is the prepaid market. Apple has done very well but the wholesale iPhone price point is nowhere near what we would expect in the prepaid market. How do you make it more affordable to those markets?

    A: Those markets are critical. The smartphone market is projected to be 1 billion units in 2015, 3 years from now. 25% of that is projected to come from China and Brazil. Just two of those markets -- 25% -- obviously those are very critical markets, but there are others as well.

    We've been very focused on China. We've had incredible success with iPhone -- we've gone from a few hundred million in revenue to last year with $13 billion. We've been really focused on trying to understand the market there and taking those learnings to other markets. As it turns out, not very many people agree with me on this, probably.

    What I see is that there is a lot of commonality in what people around the world want. Everyone in every country wants the best product as it turns out. They're not looking for a cheap version of the best product -- they're looking for the best product.

    In the emerging markets there are very big differences in go-to-market. In most of the developed market, the carrier owns most of the distribution. In emerging markets, the retailer has most of the distribution. The whole go-to-market has to be changed significantly. Last year, we covered price points in the subsidized markets from $0 on up. That doesn't translate to zero in the prepaid market, but we're covering more price points there.

    The paramount thing is the product. It is the focus. Of course distribution, we've recognized the difference there and in purchasing power. Unlike many people, I don't subscribe to the premise that prepay is prepay is prepay. We convinced China Unicom to try to postpay. It wasn't big there but they tried it and it's working really well. It's great for everyone because customer gets cheaper phone and carrier locks in a customer. It's a different way to look at the issue and it's been successful in China.

    When Apple introduced the iPod in 2001, when we launched the iTunes Music Store and launched that on Windows, the iPod created a halo for the Mac. For 23 straight quarters we've outgrown the market on the Mac.

    The halo that was created by iPod for the Mac, was created in developed markets. It was created in the US, Western Europe, Japan, Australia, Canada. It didn't work nearly to the same level in Eastern Europe, Middle East, Africa, China, Latin America. People were already getting music from their phones. The world changed for us when the iPhone was launched.

    The iPhone introduced Apple to millions of people -- our brand -- to people who had never met Apple before. Now, it's interesting to look -- take China as an example -- last year the Macintosh grew more than 100% in China, year-over-year. Not on a big base, but 100% is pretty good. The market grew 10%, so we outgrew the market 10x.

    The iPhone is creating a halo for the Macintosh. iPhone has also created a halo for iPad. You can definitely see the synergistic effect of these products, not only in developed markets, but also in emerging markets where Apple wasn't resonant for most of its life.

    Via: Apple CEO Tim Cook Speaks at Goldman Sachs Technology Conference - Mac Rumors
  11. The world's biggest startup

    Research · 32 comments

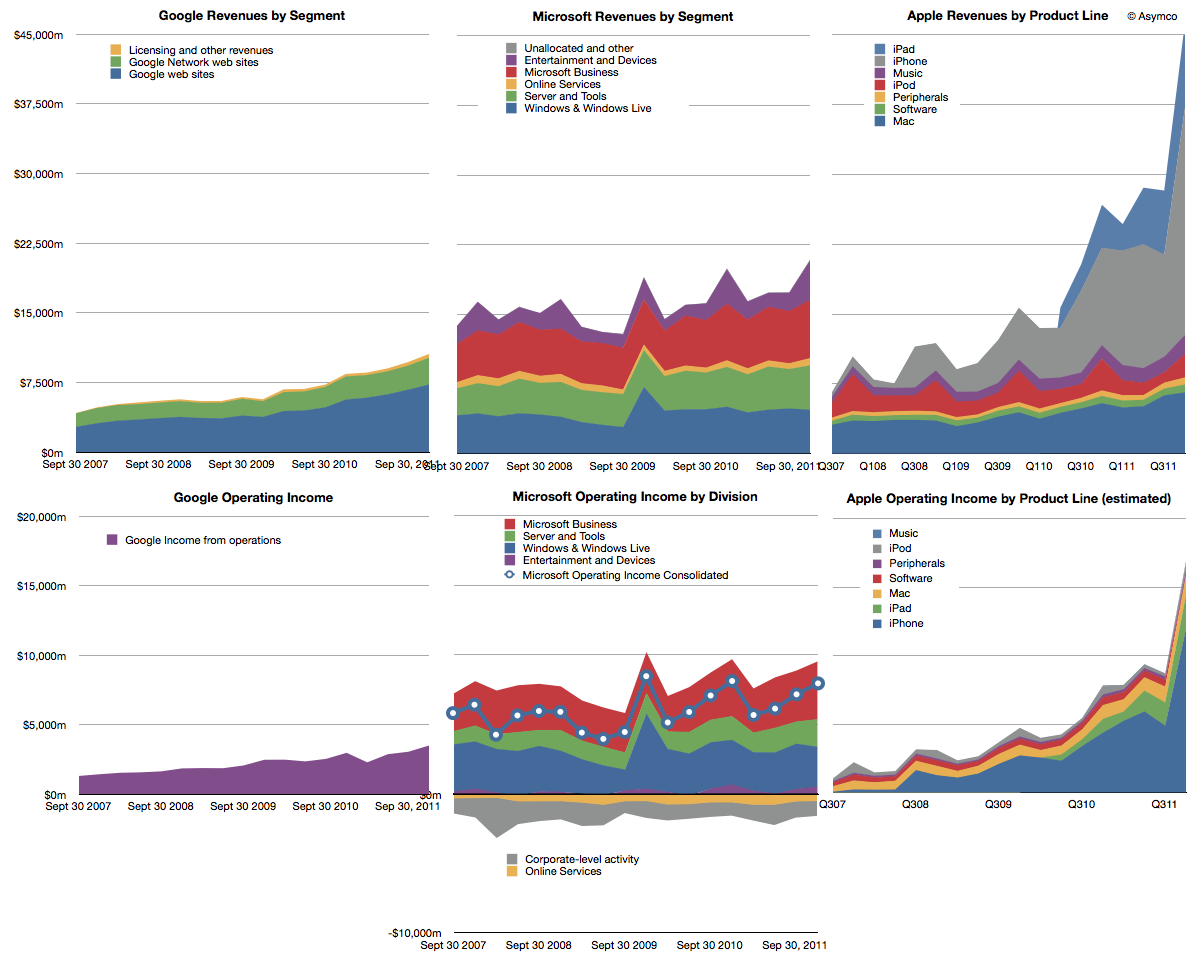
    Last year we began offering revenue and operating income comparisons between Apple and Microsoft. It was becoming evident that the iOS franchise was beginning to overtake both in revenue and profitability the Windows franchise. To offer more dimensions of comparison this time I am adding Google's top and bottom lines for comparison (click image for detail):

    Note that the graphs have the same scales when read horizontally. I've broken out the sub-divisions of revenues as the companies report them. Here are some observations:

    1. The time spanned is 4.5 years (September 2007 to December 2011)
    2. If we compare the fourth quarter 2007 to fourth quarter 2011 the ratio of Google : Microsoft : Apple went from 1: 3.39:2:16 to 1:1.97: 4.38. In other words, Microsoft was 3.4 times bigger than Google but today it's only about twice. Apple was twice and is now about 4.4 times bigger.
    3. In terms of operating income (i.e. before R&D, SG&A and OI&E) the ratios were 1:4.48:1.53 and are now 1:2.28:4.82. Microsoft's income gap to Google halved while Apple's more than tripled.
    4. Google and Microsoft have grown but not by adding new sources of revenue. Apple grew its base but, more importantly, added new businesses for spectacularly more growth.
    5. Compared to Microsoft and Apple, Google's revenue is distinctly single-source: advertising. Though divided between own sites and those of affiliates, advertising is today 96.1% of revenue and was 98.6% four years earlier.

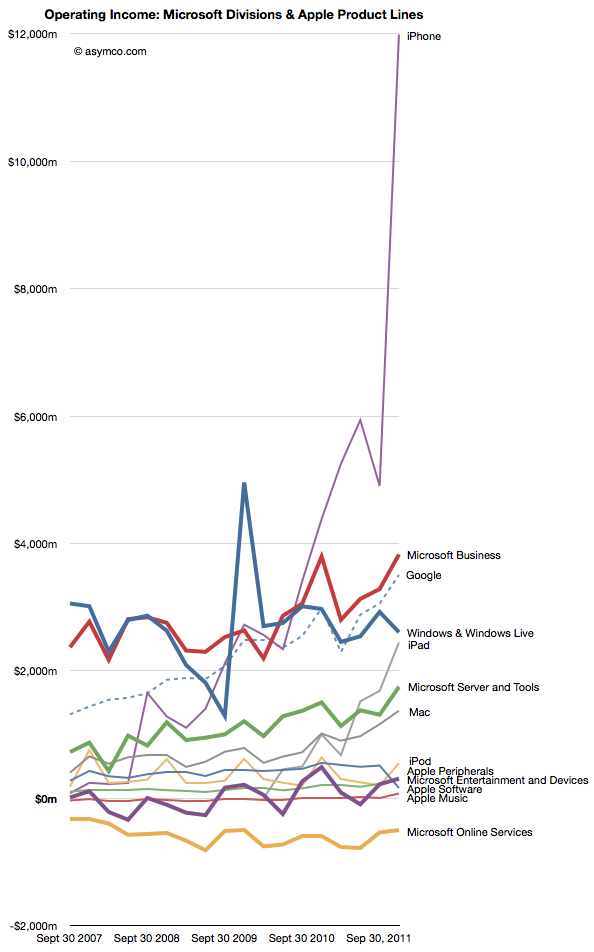
    If we compare the individual product/business operating incomes individually we see some interesting patterns:

    1. Google's advertising profits have overtaken Windows as has the iPhone and the iPad may do so quite soon.
    2. Microsoft's Business (Office) and Server businesses are growing more quickly than Windows
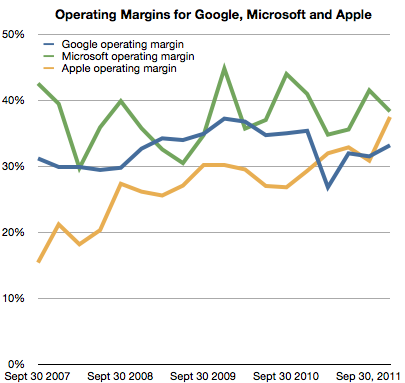
    3. The hardware oriented Apple' operating margin is now 37% and exceeds Google's 33% while being nearly equal to Microsoft's 38% (see chart below)

    I presented a subset of this material January 30th at a TechMeetups event titled "Apple - world's biggest startup." A presentation by Adam Lashinsky focused on the cultural and procedural aspects which highlight Apple's "startup" nature. My presentation showed, using these graphs, Apple's growth characterizes it as a "startup". The growth did not come from a broadening of its core products markets. It came from the creation of new product categories. Google, a much younger company does not exhibit this non-secular growth any more than Microsoft which is about as old as Apple is.

    The lesson is perhaps that rapid growth is not the right of small companies alone. Apple has used disruptive innovation to transform itself and offers a stunning contrast to two other companies which are also seen as innovative leaders.