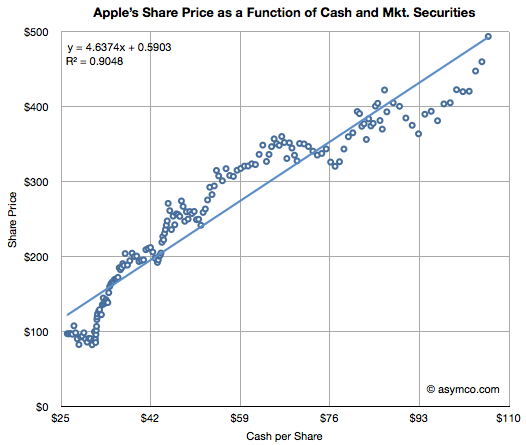
Apple's valuation since October 2008 has been very highly correlated to its cash (R-squared of 0.91). This tight relationship to Apple's value is shown in the chart below:
(The chart shows weekly, ending each Friday, share price (vertical axis) vs. interpolated weekly cash per share (horizontal axis) assuming linear growth between quarterly announcements. Share price data is current as of last Friday (Feb. 10) though cash per share is based on announcement date and hence delayed by about three weeks.)
I noted this relationship in May 2011 and followed up in September 2011. With current cash per share reaching $95 to $100 $103.66 it seems that the share price should be around $500 any time now.
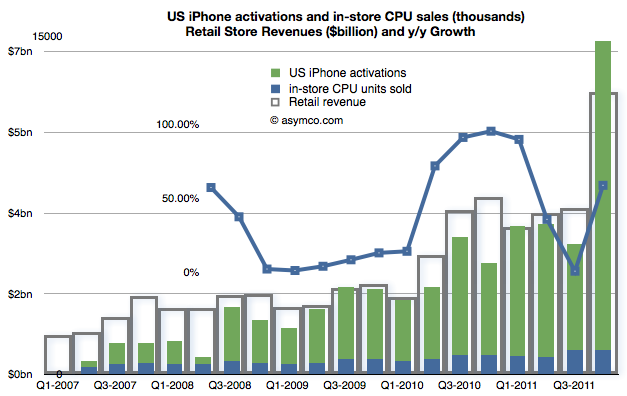
Apple's retail stores increased sales by nearly 60% in Q4. This is a dramatic though not unprecedented change from Q3's 1% growth rate. The growth rate faithfully tracks iPhone releases as demonstrated in a post last quarter.
When seen on a yearly basis some of the data begin to from a picture.
There were 332 million visitors in 2011, an increase of 29%. (This total is greater than the population of the United States.)
The average revenue was nearly $50 million/store
38 stores were opened, in-line with 2010's 40 openings
Total 2011 revenues were $16.4 billion
About 34,600 (full time equivalent) employees were employed on average
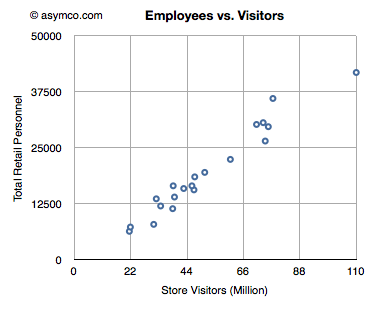
There were nearly 1 million visitors per store
There were an average of 100 employees assigned to each store
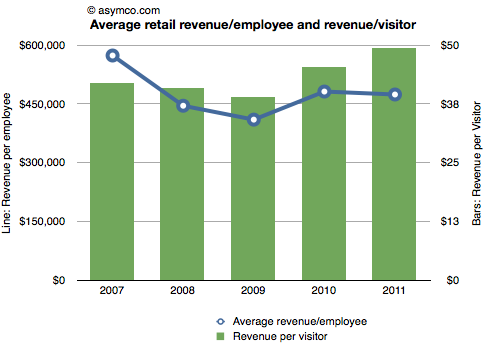
Average revenue/employee was $473,622
Average profit/employee was $120,289
There were about 9,600 visitors for each employee
Each visitor generated about $50 in revenue
The revenue per square foot was about $6,500 across all stores.
Some of these metrics are shown in the following charts relative to prior years:
Sprint reported its first iPhone quarter sales at 1.8 million. You may recall my analysis of Sprint's "gamble" where I estimated that Sprint will easily sell the 31 million iPhone which they committed to buy from Apple. I had estimated that they could sell an average of 7 million units a year but perhaps conservatively they could ramp at 4, 6, 9 and 12 over the four year period rumored to be in the contract.
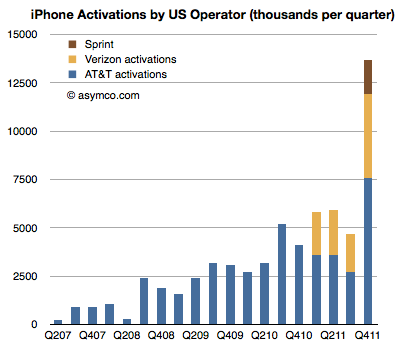
Given the pent-up demand I also estimated that the first quarter could reach 2 million units. They managed 1.8 and that's a solid start. Overall the US carriers activated 13.7 million iPhones. Here are the iPhone activations by US Operator:
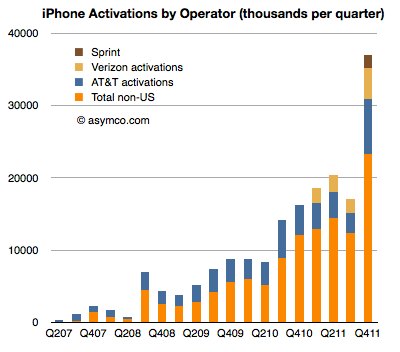
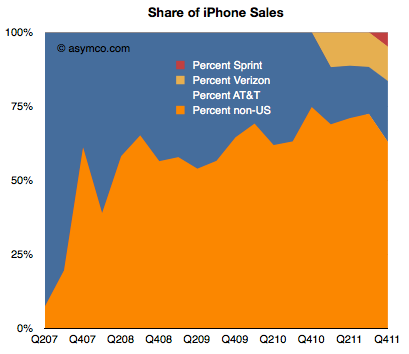
That's 37% of the total market in Q4, shown in area and bar charts below:
Note that the percent of total activations outside the US has dropped but that is due to the limited distribution of the iPhone 4S outside the US in the launch quarter. The long-term trend is for the US to decrease as a percent of total iPhones even with the additional US distribution.
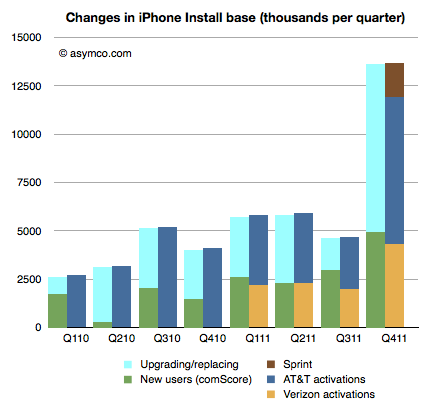
By comparing the net adds to US install base from comScore survey data, we can estimate that about 63% of US purchases of iPhones were replacements and that 8.7 million iPhones were put out of use in the US last quarter.
It's perhaps fitting that an industry that produces illusions is in itself an illusion. The absence of public scrutiny of its finances and business model leads to a lot of myths or misconceptions. Some of these are discussed anecdotally in books and other works[1], but the absence of data makes the anecdotal evidence unsatisfying to an analyst.
What if we could find patterns in data about the industry to confirm or deny these oral histories? Fortunately some data actually exists. There are collections of data about movies released and some of the attributes of these releases such as box office receipts, theaters opening, budgets (sparsely), and distributors. This data is typically used for marketing purposes to celebrate the "hits" and thus entice more people to see the movies.
However, other information can also be obtained through analysis of the data. In fact, a rather compelling story can be told. That's the purpose of this post. Our story will be expanded over time but this first draft should be enough to allow a discussion to begin. The story is built in four sub-stories:
Drama / Comedy vs. Adventure / Fantasy: Why the Ancient Greeks had it all wrong.
The magic of summertime: Market access and school schedules
The perpetual incumbency: What happens to Hollywood startups
The Popcorn economy: The peculiar power of theaters in an age of television
These stories were the result of observations in data alone. We have no first-hand knowledge of the industry and have only used basic software tools to seek out patterns in public data[1].
The data set includes approximately 12,000 titles released between 1975 and present with various degree of completeness. Some of these years are not completely populated and some data is undoubtedly in error. However the large sample should offer enough substance for patterns to emerge in spite of this.
Drama / Comedy vs. Adventure / Fantasy: Why the Ancient Greeks had it all wrong
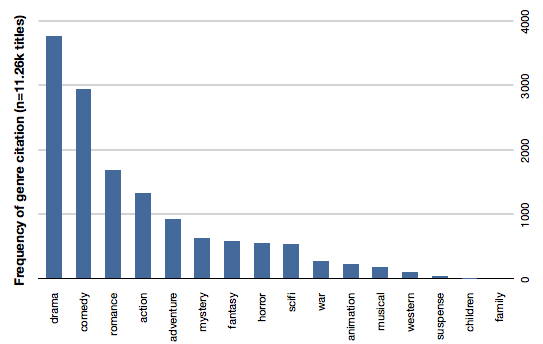
Storytelling has not changed throughout history. The same types of stories affect audiences the same way since stories were first told. The earliest known "genres" were tragedy and comedy and they are still seen as the bedrock of theater today. The same is true for movies. The following bar chart shows the distribution of genres as cited by movies over our data set.
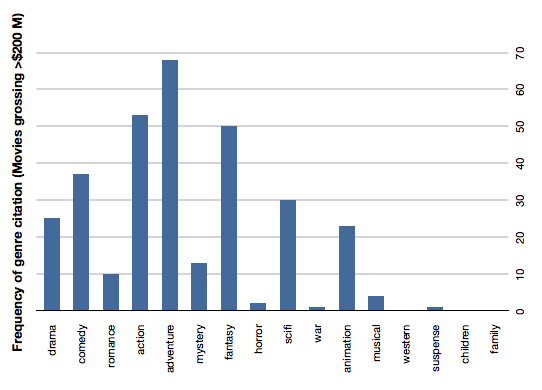
Drama and comedy are about 50% of all movies made. If we add romance they are 60% of cited genres. This is understandable given the history of theater. However the profitability (or revenue potential) of those genres is not as strong as Action, Adventure and Fantasy. The following chart shows the same count of genre citation but only for movies grossing over $200 million (which we chose to call "blockbusters").
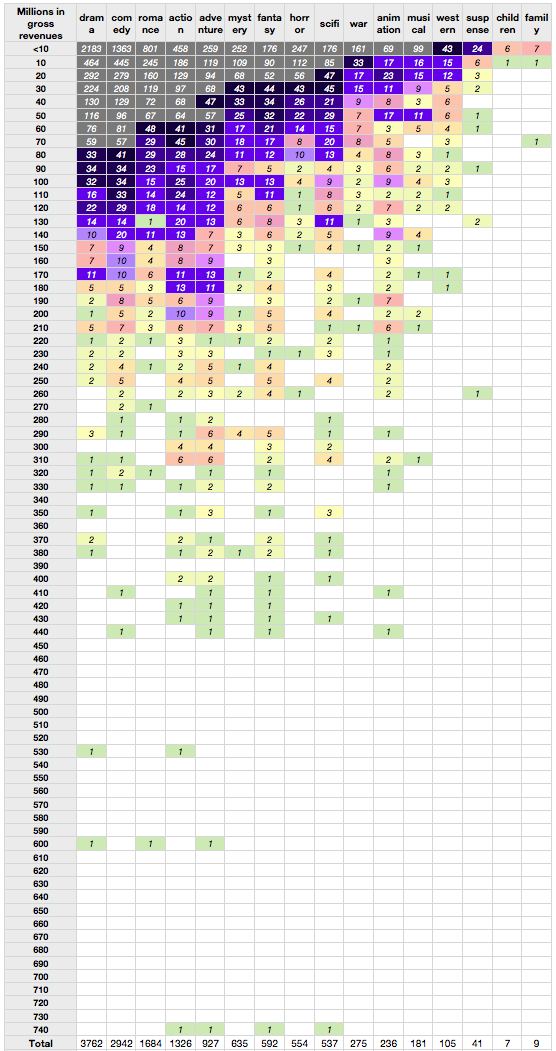
Action, adventure and fantasy handily beat Comedy and even SciFi beats drama. Romance, musicals and and mystery genres typically associated with female audiences are very rarely successful as blockbusters. The overall data is shown in the following table. The rows represent gross revenues and the columns genres cited ranked in order of frequency. One can easily observe the density of low earning drama and comedy (grey colored) vs. the more lucrative instances of fantasy and adventure. These male-dominated genres have consistent success into middle, high and very high revenue tiers.
The reason for this blockbuster attention to action and adventure is probably the prevailing theater-going audience demographic: adolescent males. The industry still produces the classic genres but less profitably than what the current targeted markets.
Indeed, these genres were very uncommon in eras predating the late 1970s. More "adult-oriented" movies like romance (Gone with the Wind), musicals (The Sound of Music) and epic movies (Ben Hur, The Ten Comandments) were common in the "golden age" of Hollywood. As we'll see in the next section, the age of the audience is a now driving more than just genre selection.
The magic of summertime: Market access and school schedules
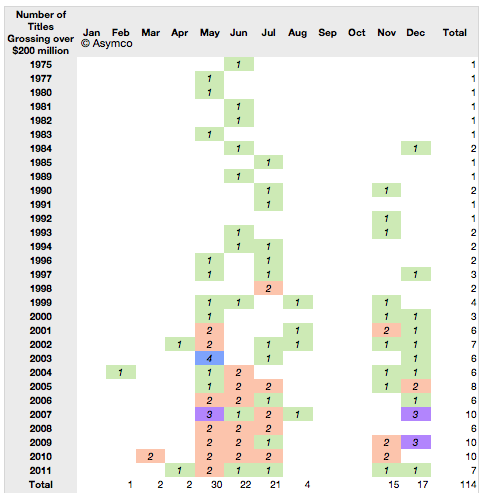
Using the word "Summer" before "Blockbuster" has become almost redundant. What is less understood is that watching movies in the summer is rather a new idea. It started effectively with Jaws in 1975 and ever since major film studios have planned their annual marketing around a summer schedule. There is clear evidence for this in the data. Here is a table showing the blockbuster release months since 1975. (The number of titles grossing over $200 million and the months in which they were released).
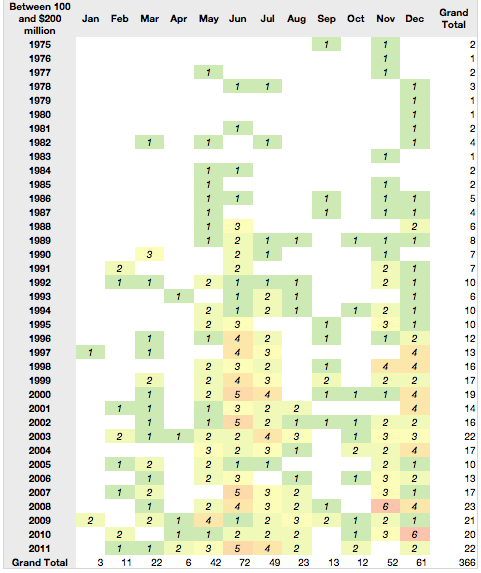
The same pattern repeats for the next tier of highly successful movies--those grossing between $100 and $200 million.
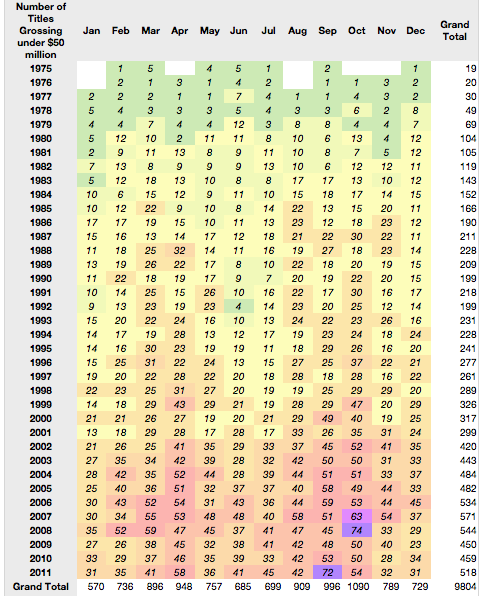
But what about the less successful movies? Those earning less than $50 million actually show a counter-success pattern.
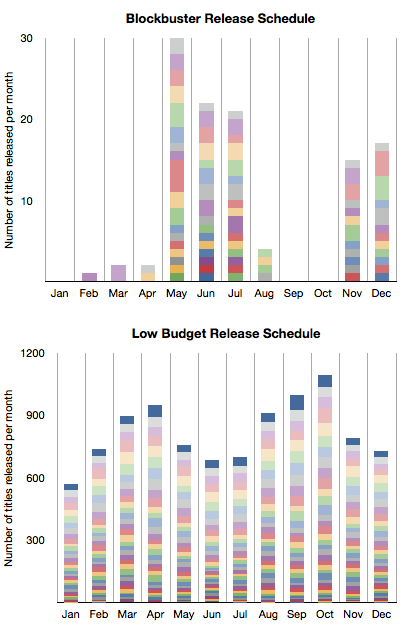
To contrast this further, here is a stacked bar chart comparison between frequency of release by month for the most successful tier vs. the least successful tier (colors represent years with oldest at the bottom).
It would seem that summer and success are in a causal relationship. There is a clear pattern with the only non-summer months having blockbuster releases being November and December.
But there is more to this pattern.
The blockbuster schedule happens to coincide with the school holiday schedule in the US. This again points to the "profitable" audience being school-age children, and mostly male.
The perpetual incumbency: Where are the Hollywood startups?
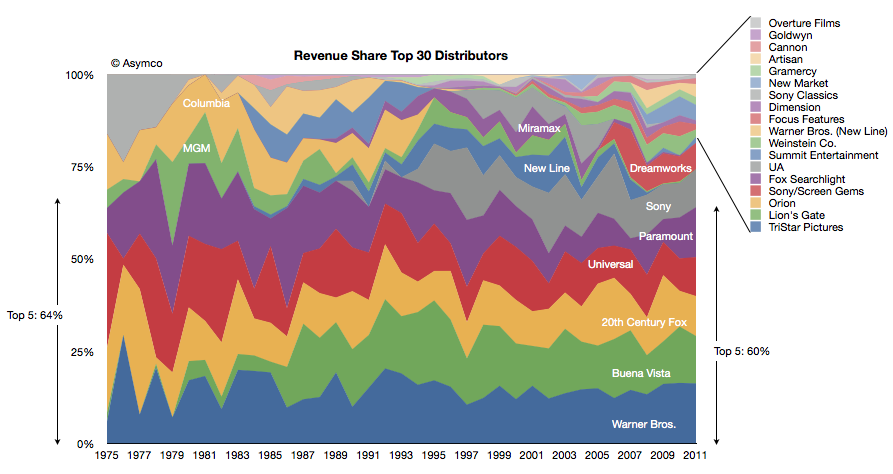
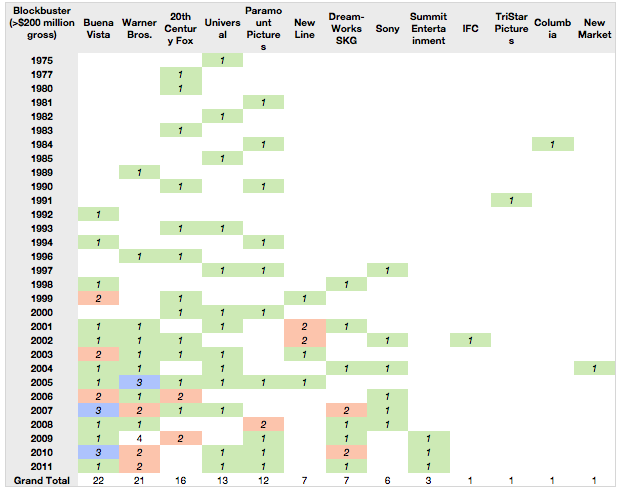
The third observation has to do with the major film studios. We took the box office revenues and allocated them to the studios over time. The following chart shows the share of those revenues for the top 30 studios.
The top five were earning 64% of revenues in 1975 and the top five were earning 60% in 2011. One of the top five from 1975 is no longer in the running this year (MGM) and one new major was added (Buena Vista, owned by Disney).
There has been one other notable change: Columbia was acquired by Sony but stayed out of the top 5. Beside Disney there is one new significant entrant in Dreamworks gaining share in the last decade.
But the prevailing impression from the data is that the incumbents remained as such during the last four decades. There are many small studios but they have not "disrupted" the market by shifting significant revenues out of the hands of the majors. Indeed the typical strategy seems to be to start a studio with the hope of it being acquired by a major.
Even the entrants are industry insiders: Disney and Dreamworks are not asymmetric in their business models in any way. In fact, when viewing the data by blockbuster creation, the majors feature prominently. There are only a handful of blockbusters from the smaller companies.
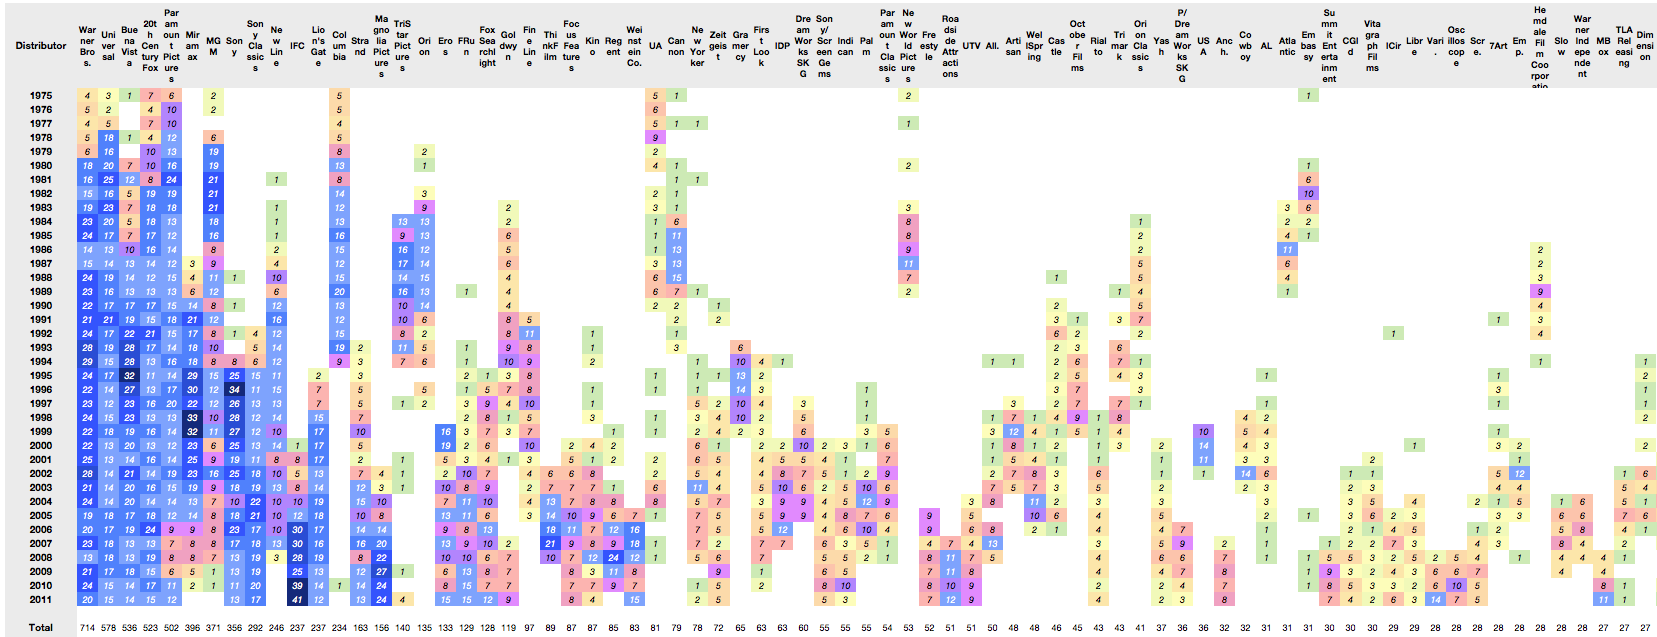
When looking at overall production rates, again the majors (and their subsidiaries) dominate. Here are the top 75 distributors of movies showing nearly 9000 movies (click image for full-size):
The conclusion from this data might be that Hollywood does not change all that much in terms of who makes the money. But that itself is a symptom of a deeper reality: that there is little that changes at all.
We can even perhaps hypothesize that there is no business model innovation taking place. Any such innovation is usually manifested in a reversal of fortunes for incumbents.
But technological change is happening. The following section describes how this appears in the data.
The Popcorn economy: The peculiar power of theaters in an age of television
The data we are sampling (box office gross revenues) is actually a small and shrinking subset of what movies generate. In addition, there are international revenues, media sales (DVD, video tape), TV rights, and merchandise to name a few. But theaters are still an important part of the picture.
Although they make up less than 20% of gross, their importance is disproportionate due to the signal they send other markets about the popularity of a movie. In other words, a movie must first be proven in a US theater before its value is priced by the other channels.
However, this essential theatrical release has changed in one fundamental way. Releases are now geared for larger initial scopes with shorter runs and less dependency on "word of mouth" to increase sales.
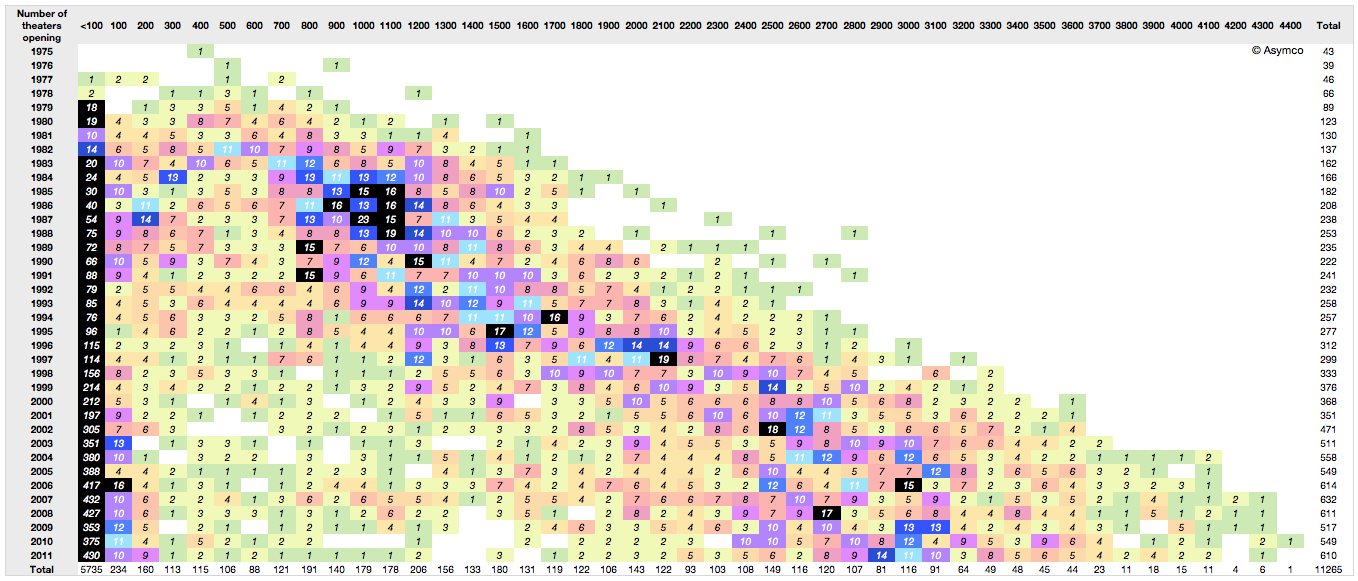
Consider the following view of release breadth (how many theaters are in an opening) by openings over time. The columns represent the number of theaters used in the opening of a movie in increments of 100. The rows are years. The cells contain the number of movies opening with that size footprint.
The pattern shows the number of theaters used in openings increasing steadily. the mean number of releases is shifting to the right. Part of the reason is that theaters shrank in size over time, but there is also the factor of needing to create a large audience at the outset of a release. The increase in "footprint" at launch (a factor of 10) is in excess of the slicing of theater sizes (a factor of two)
This broadening of launch is coincident with a decrease in viewers. As a result the notion of how movies are marketed has changed. The idea that a movie could start small and gain a following gradually through word of mouth is obsolete. That low cost approach to marketing (called "earned media exposure" in marketing) is unreliable and completely discounted.
Instead, studios manufacture an audience through paid advertising and promotion. This initial burst of viewers is essential not just for generating revenues. It's essential to driving long-term revenues.
The reason is that technology now allows the movie to be "monetized" through multiple channels. Recorded media, broadcast rights and even in-flight entertainment are all there to milk a franchise. But there is a need to get that initial vote of confidence from one crucial audience. That happens to come only from theatrical release.
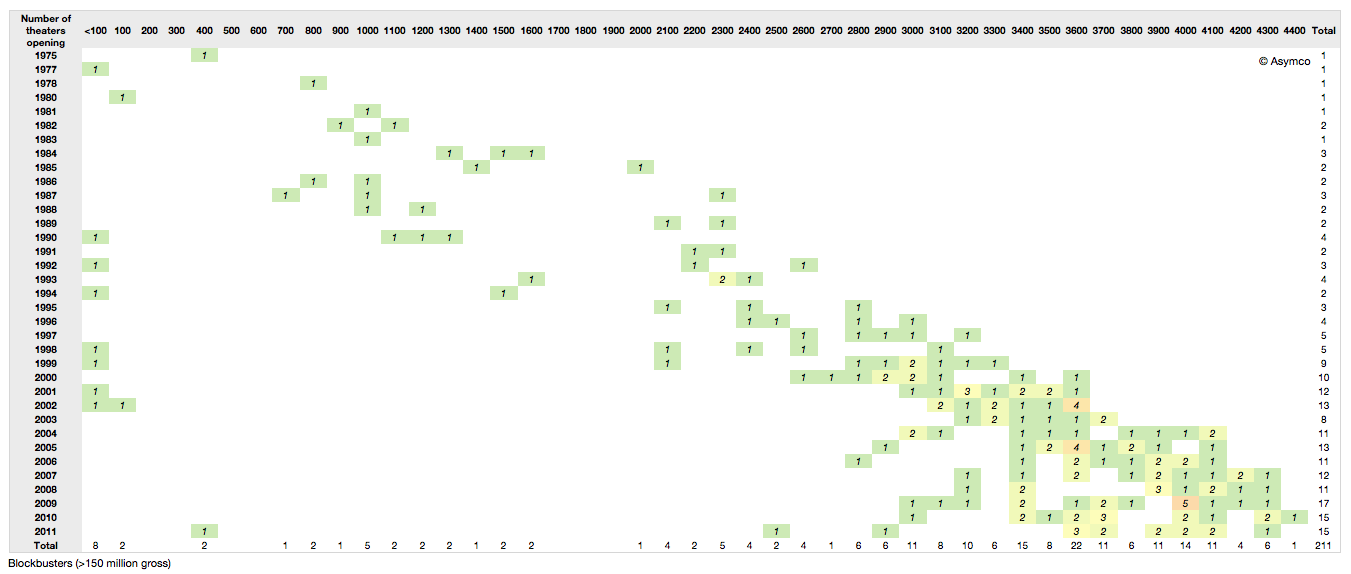
So with the scheduling pressures, the narrow window of purchased release buzz, the onus is on a broad release as quickly as possible. This holds especially true if we filter out only the blockbusters. Note how the release has increased steadily as well and that since 2000 all blockbusters released to over 3000 theaters. Compare that to Star Wars in 1977 releasing to only 30 theaters.
Data sources: Coolector, Imdb, BoxOfficeMojo, The-numbers.com
Many thanks to David McCandless and the Information is Beautiful folks (http://www.informationisbeautiful.net) for setting up the Hollywood Budgets Award that provided us with much motivation for researching this topic.
I've been publishing my estimates for Apple's business performance for a few quarters (see here, here and here). My estimates have been collected along with those of dozens of others by Philip Elmer-DeWitt at the Fortune Apple 2.0 blog.
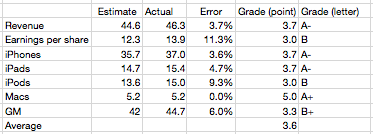
I've also been scoring my performance and discussing the causes of errors. Here is the analysis for the fourth quarter 2011.
My estimate for Mac growth was very precise. It was based on a 27% growth estimate. It turns out that growth was well within historic range and thus quite predictable.
iPhone and iPad error was very modest at less than 5%. This led to a very low error on Revenues (as I also did not expect ASP to change).
I was too pessimistic on the iPod, expecting 30% decline and 13.6 million units. In reality the business declined by only 21% and Apple still sold 15.3 million units at an average selling price of $164.
Due to an underestimate on margins which are highly sensitive to iPhone margins my gross margin estimate was off by 6%. This led to a relatively poor EPS error of 11%.
Nevertheless, the "grade point average" for the quarter was 3.6 which is nearly an A-. This is an improvement from the B- from the last quarter.
Because the accuracy was good, there is little to be learned from the quarter. Perhaps the most important observation is that the iPhone recovered from two outlying quarters. The second quarter where it overshot expectations and the third quarter where it undershot. These were hard to predict because the product went through a delayed transition which whip-sawed both production and sell-in.
What we saw in the fourth quarter is a return to the predictable historic growth of nearly 100%.
To give a perspective on the performance of other analysts, a motion chart showing their errors is here.
See also the video PED published of the same data here. (This video was produced from the same motion chart shown above, selecting bars instead of bubble as the chart type).
Notes:
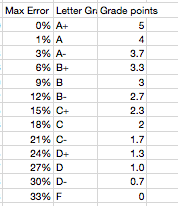
The scoring of the error is according to the following table:
The results can be seen for all the other analysts as a table here (with data since mid 2008).
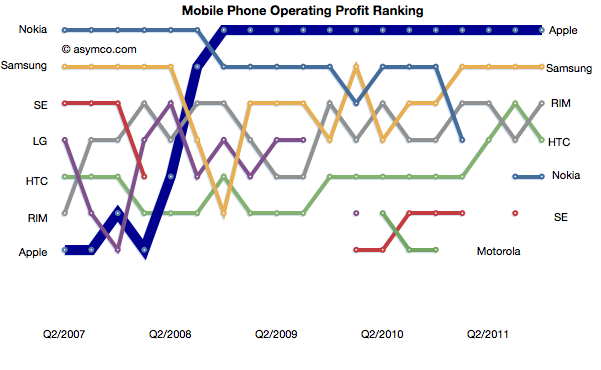
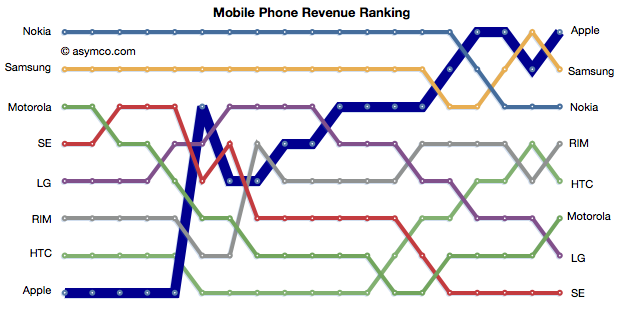
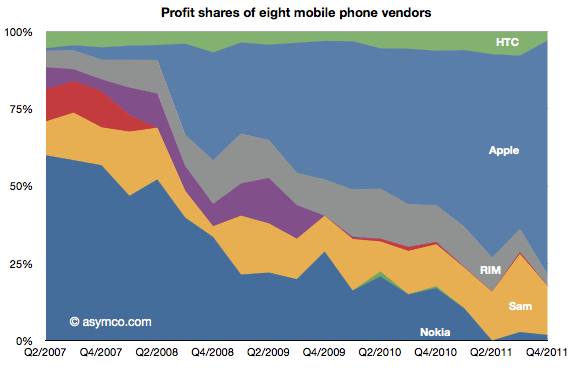
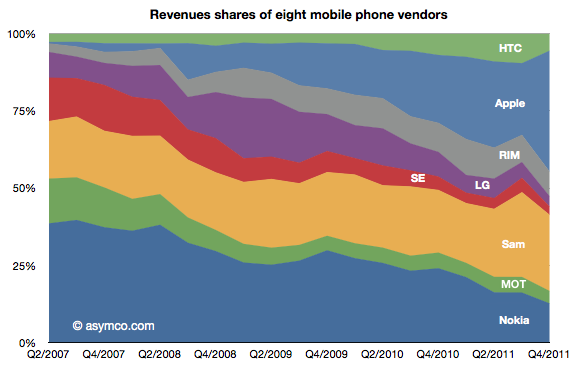
Apple retained its top rank in profitability and regained the top spot in mobile phone revenues.
The relative shares of revenues and profits are shown below:
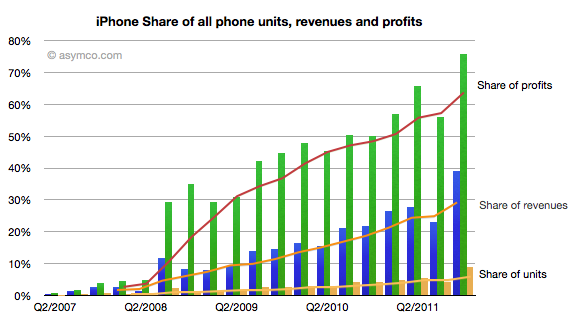
Individually, Apple's share of units, revenues and profits is chronicled below:
Apple reached 75% of profit share, nearly 40% of revenue share and 9% of units share.
Apple and Samsung combined for about 91% of profits with RIM third at 3.7%, HTC fourth at 3.0% and Nokia last at 1.8% of a $15 billion total for the quarter.
In terms of revenues, Apple had 39% to Samsung's 25%. Third was Nokia with 12.6% and fourth RIM at 8%. HTC only managed 5.5%, Motorola 4%, LG 3.3% and Sony Ericsson 2.7%.
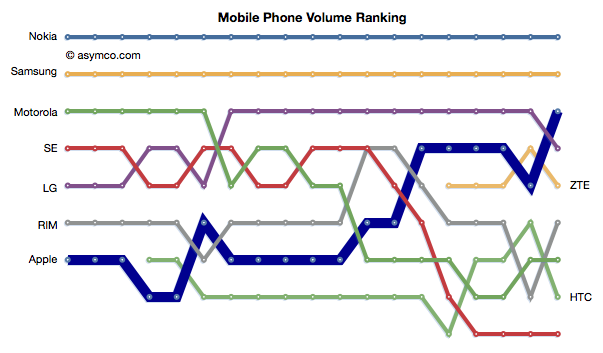
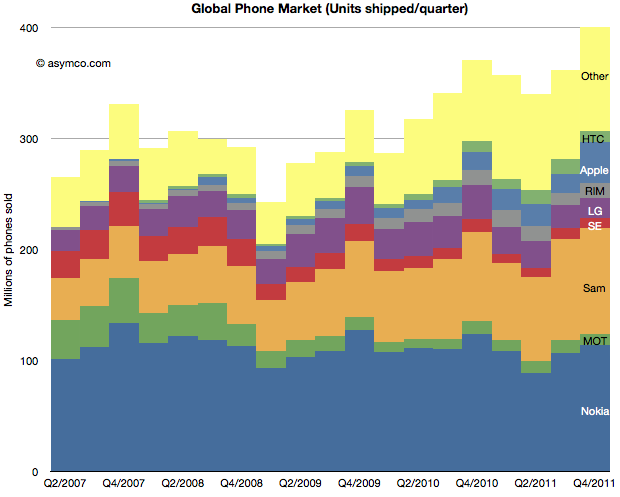
Apple reached the third place rank in total units shipped during last quarter. The following chart shows the ascent in rank.
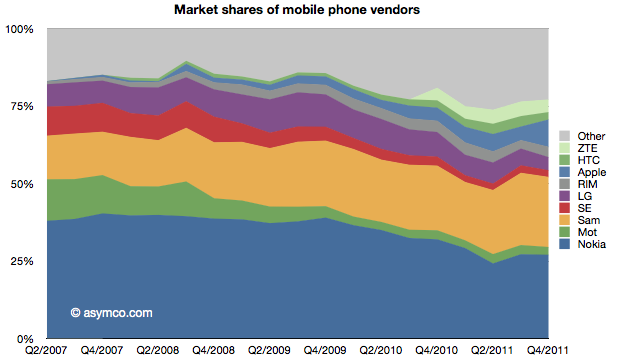
Apple achieved this with a total market share of about 9%. Second place Samsung has 22.6% so there is significantly more room to go before Apple gets to be second. Nevertheless, the climb to third was achieved in less than five years. At the time when Apple entered the market third place was held by Motorola with shipments of 35.5 million units (Q2 2007). Motorola only managed 10.5 million in the last quarter.
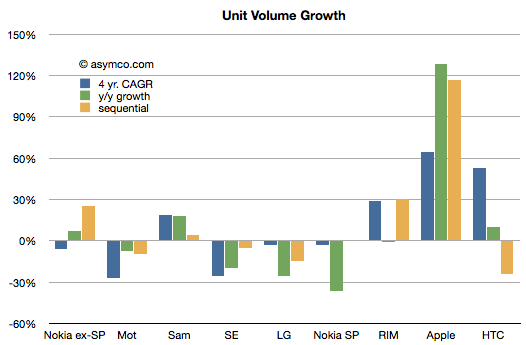
To see growth I prepared the following chart showing the fourth quarter's growth by vendor according to four years' compounded, sequential and y/y growth.[1]
On a four year compounded basis, the pattern is that of Apple, HTC and RIM showing significant growth with Samsung showing moderate growth. The other vendors all had negative real volume growth. The list does not include "Others" which had 13% compounded growth.
Projecting Apple's 60% rate of growth and a market growth of 10% leads to Apple obtaining 27% share by the end of 2014. My guess would be that is when we'll be able to write a post about Apple being second.
---
Notes:
I don't have HTC data for Q4 2007 so the compounded rate is measured for three years.
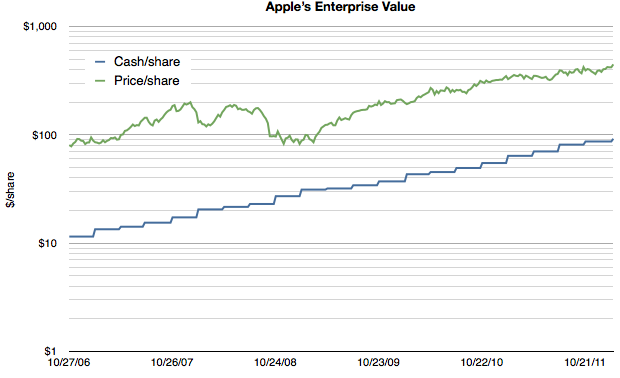
As Apple's extraordinarily low valuation is being more widely noted, explanatory hypotheses are proliferating. Everyone seems to have an opinion. Some explanations come in and out of fashion. Others are reliable old clichés. We've seen liquidity issues with large funds forced to sell, "too much cash", management transitions, an impending loss of mojo, share price too high to afford, "law of large numbers", and that old chestnut, competition. None of these satisfy. They don't explain why reliable growth is not valuable. And reliability is indeed what Apple offers in spades. Consider the following chart:
Note that the scale is logarithmic so that the growth patterns can be seen clearly.
It shows Apple's cash/share vs its price per share. First, it should be noted that the company's cash has been growing reliably on a log scale, increasing by a factor of 10 in five years. As a proxy for retained earnings, the cash trajectory shows exceptionally predictable earnings.
Second, although the share price has grown it has not grown either as reliably or as quickly. It's as if the reward for reliable earnings is a significant dissent.
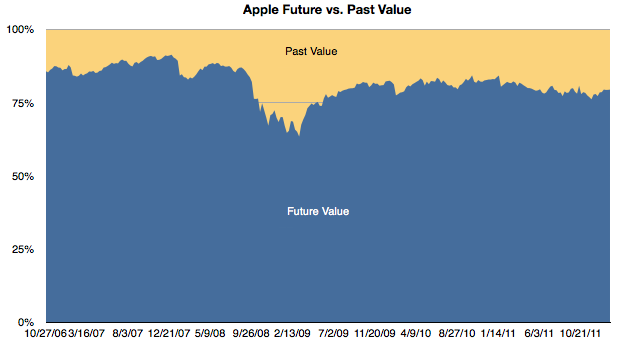
Third, if we subtract the cash/share from the price/share we obtain the enterprise value (EV) per share. The EV reflects the future value built into the price. It reflects the expectation of more earnings. In the chart above one can see the shrinking of the gap as a multiple of the cash value. To bring that gap into focus, I prepared this chart showing the percent of the share price allocated to past value (cash) and future value (EV).
One can see the gradual erosion of emphasis of future value. With the exception of the credit crisis induced equities crash, future value as a percent of total value is at a new low. In late 2006 the future was was about 86% of the share price. At the end of last week it had dropped to 79%.
Another way to interpret this is that in 2007 when the iPhone was born nearly 90% of the business value was thought to be in its future. Today only 80% is future value.
To clarify further, if a company reaches a price where 100% of its value is cash then it's seen as having no future value. Having any significant portion of the price attached to the past is extremely rare for a growing company and I would say unheard of in a company growing as rapidly as Apple is.
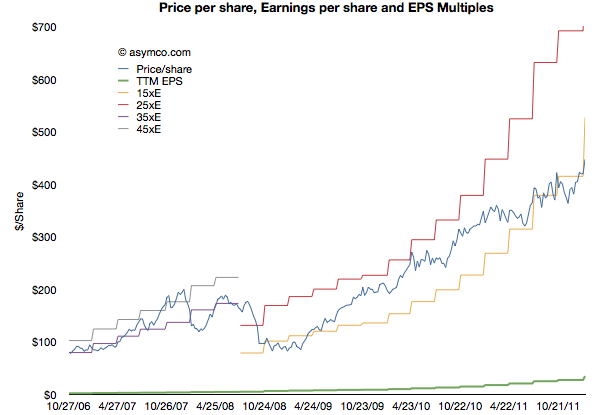
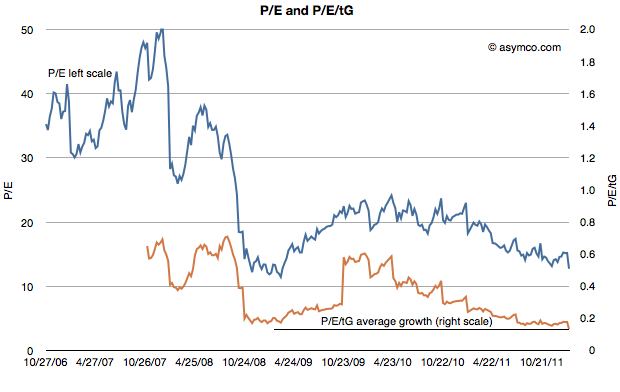
This preoccupation with the past and discomfort with the future is, I believe, the key to understanding the valuation paradox for Apple. I have gone over the conventional metrics of P/E and P/E/G(trailing) that illustrate absurd pricing (updated below). But they don't help explain the mis-pricing.
A disruptive company is inherently unpredictable. Success and growth are unrewarded because there no understanding of the underlying causes of these phenomena and therefore there is no expectation of repetition.
In other words, a five year dead-straight line of logarithmic growth is not a sign of anything resembling reliability if the underlying causes are not understood. Today Apple is still a mystery wrapped in an enigma and without a causal understanding of its suceess its pricing will remain paradoxical.
In a previous series of articles we discussed the capital Apple expends on equipment, real estate, leasehold improvements and data centers. Cost structure analysis reveals subtle shifts in strategy and the CapEx analysis demonstrates Apple's increasing integration into its supplier network and integration into the distribution and service infrastructure that sustains its ecosystems.
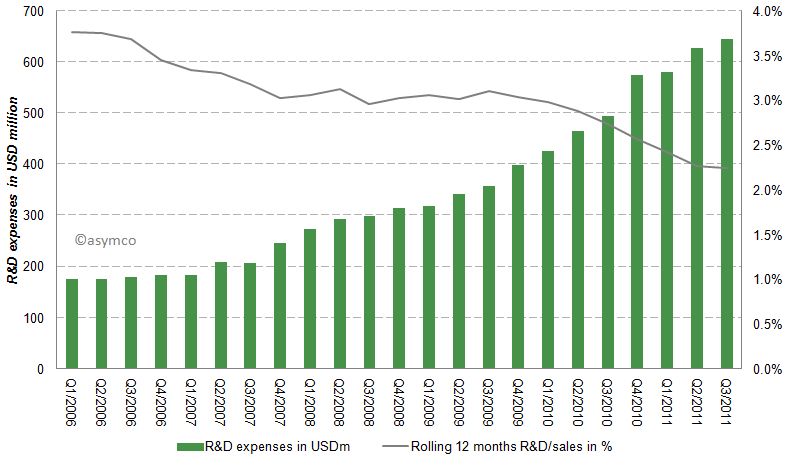
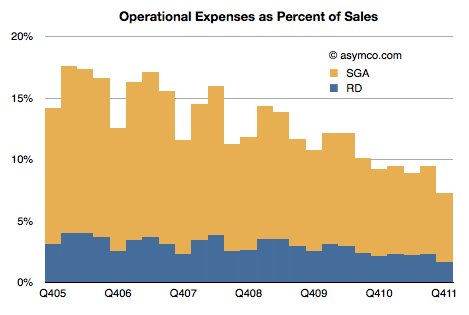
Another form of investing (spending now, reaping benefits later) is the spending on research and development (R&D). Let’s have a look at Apple’s R&D expenses by quarter since Q1/2006.
Apples R&D expenses as percentage of sales have been declining from almost 4% to close to 2% in the last six years as shown in the following chart:
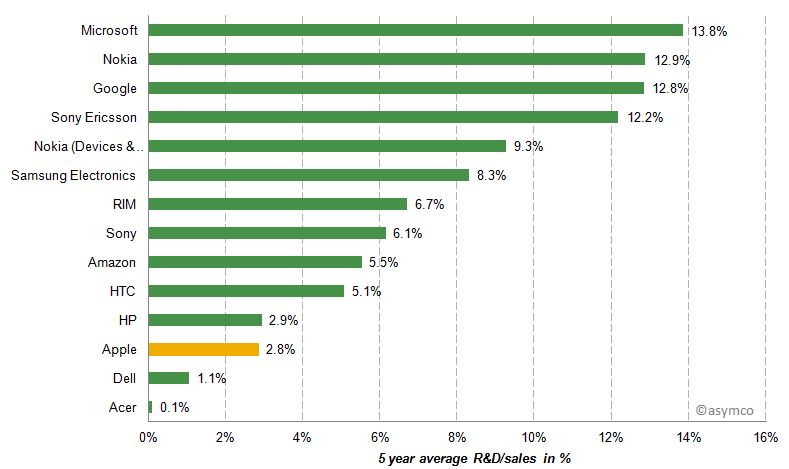
While Apple's absolute R&D expenses have grown at an annual rate of 33% they have not kept up with the far higher sales growth rate. Apple's current rate of R&D expenditure is compared to a peer group [1] below.
Apple's R&D/sales ratio is between Dell and HP, companies which do not develop their own software or hardware.
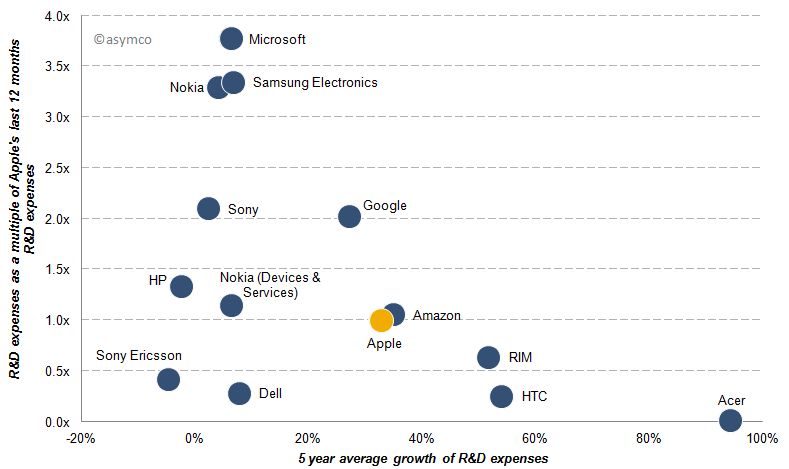
Beside the absolute, relative to sales and relative to peers, another perspective is to measure relative growth. The following chart represents shows the 5 year average growth of R&D expenses and on the y-axis the size of last 12 months R&D expenses as a multiple of Apple's R&D costs [2].
Acer's R&D expenses for example are almost non-existent compared to Apple, but have grown almost 100% per year while Microsoft’s last 12 months R&D expenses are almost 4x that of Apple's and have only grown slightly over the past five years. Google's R&D costs have grown at a similar rate compared to Apple, but remained double those of Apple’s throughout the last five years.
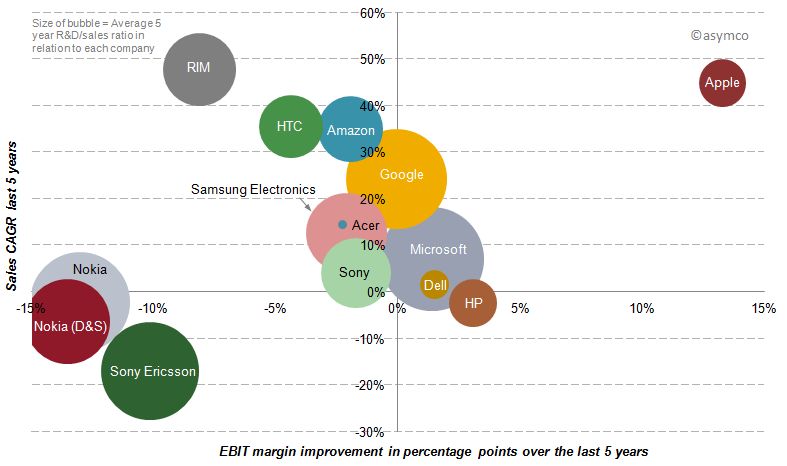
Finally, we should look at the payoff from R&D spending over the last five years. R&D growth should result in margin improvement, but does it? The following chart shows the relationship between spending (size of bubble), margin improvement (x-axis) and sales growth (y-axis).
Of our sample, only three companies have achieved sales growth AND simultaneous margin improvement over the last five years. But while Microsoft and Dell have achieved sales growth and margin improvement slightly above zero, Apple has improved its bottom line by 13 percentage points and its top line by an average rate of 45%.
In spite of Microsoft's, Google and Nokia's massive R&D growth, their returns from that investment have been meagre to negative in terms of margin and only Google showed appreciable sales growth.
Discussion
R&D expenditures on a stand-alone basis, in absolute or relative terms, do not correlate with disruptive growth. Essentially, you cannot buy innovation.
In fact, sometimes it's nearly free. Most startups spend less on R&D than large companies do on stationery and yet the bulk of wealth creation has come from these tiny companies. The challenge is, in fact, that if you have resources you find ways of spending them (the quaint American cliche of 'cash burning a hole in your pocket'). The temptation is always there to fund a new initiative which bright people can always envision.
Leadership in innovation is not the courage to spend but the courage to focus.
“Focus is about saying 'No'. And the result of that focus is going to be some really great products where the total is much greater than the sum of the parts.”, Steve Jobs (1997)
[1] Our set of peer companies as shown in previous posts but excluding LG, Lenovo and Motorola Mobility due to lack of data, but including Sony Ericsson and Nokia’s mobile phone division Devices & Services.
[2] In this post “year” and “last 12 months” refers to the time frame from Q4/(year-1) year to Q3/year due to lack of published data regarding Q4/2011. Five year data runs from Q3/2006-Q3/2011.
[3] A note on capitalized R&D: Most of the companies analyzed do not have capitalized R&D costs. Some have small capitalization, but so small that the inclusion would not change the decimal points of percentages. The only significant amount of capitalized R&D appeared in Amazon's earnings releases: capitalized R&D cost were USD 100 million in Q3/2011. The amortization of theses costs in included in Amazon's EBIT (Operating imcome).
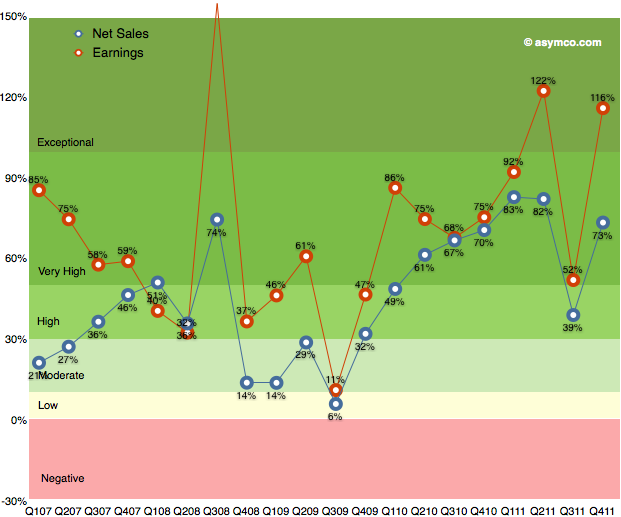
After the transitional third quarter, Apple's earnings growth returned to an exceptional level. As the following chart shows, earnings growth has maintained above 50% growth since 2009.
Q3 turned out to be a transitional quarter with 52% growth but Q4 proved to be "exceptional" with growth above 100%. This is the third highest rate of growth in the five year span shown. Sales growth was also very near the top of the range, coming in fourth historically.
When looking at the components making up sales, we can see each product line's revenue growth in the following table:
The growth leaders were also the largest product lines in terms of revenue. iPhone and iPad had triple digit growth rates and that translated into the bottom line growth.
Music related products and services which Includes revenue from sales from the iTunes Store, App Store, and iBookstore in addition to sales of iPod services and Apple-branded and third-party iPod accessories grew at 42%. This is the highest rate during the time frame shown.
Peripherals which Includes revenue from sales of displays, networking products, and Apple TV was next with 29% revenue growth.
The Mac line followed with 22% growth and Software which includes sales of Apple-branded and third-party Mac software, and services through the Mac App Store grew at 7%.
The iPod line continued to shrink with -26% decline.
I used color coding in the table to show the patterns of change and what I note is that the iPhone and iPad lines continue to be exceptionally fast growing businesses. The duration and amplitude of these streaks of growth should be a clear signal about the dynamics of these markets and Apple's role within. Too often, I find, these signals are ignored.
The iPad and Mac businesses both grew well in the last quarter. Tim Cook said they are observing some cannibalization of Mac from the iPad but much more switching to iPad is coming from the Windows PC market.
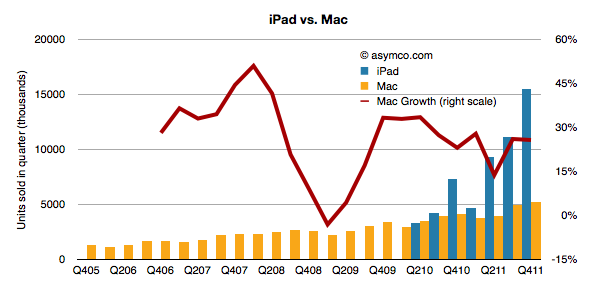
The evidence is still hard to pin down directly but the fact that PC sales (excluding the Mac) are down gives credence to the claim. Mac growth, in contrast, is largely unaffected. The following chart shows the the iPad volumes vis-a-vis Mac volumes and the Mac growth through recent history.
The iPad has out-sold the Mac since inception and is now about three times the volume. However, the growth rate in the Mac has not changed much.
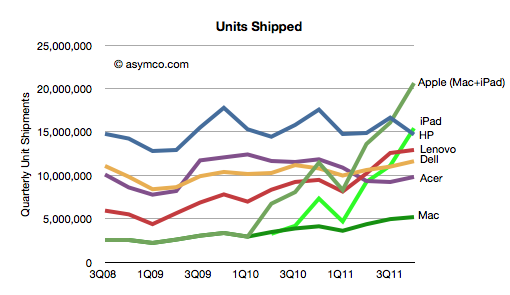
The impact on the PC market has been discussed recently and the data in the following chart is an update given more precision on the units from Apple:
The new data shows that the iPad alone would be the largest PC vendor and Apple with iPad and Mac combined is selling 5 million more units (or 30%) than the top PC vendor.
The impact of the iPad is not specific to any single vendor (Apple included). It competes for time and purchase decisions across all computing alternatives and though many times it's additive, it is also substitutive and will become increasingly so.
Tim Cook mentioned on the earnings conference call that Apple sees the iPad as addressing a market larger that the PC market:
I truly believe, and many others in the company believe, that there will come a day that the tablet market in units is larger than the PC market. In fact, it's interesting to note that in the U.S., it's clear from the IDC's recent data on desktop PCs in the U.S., that tablets exceeded desktop PC sales last quarter in the U.S.