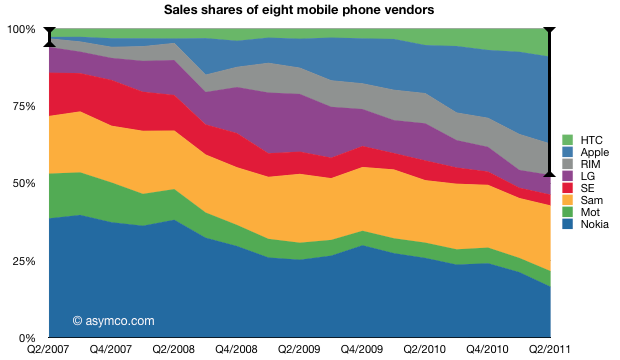
I took the stacked cascade chart of profit/phone x phones sold into a multi-quarter animation subtitled "The evolution of Shipments, Revenue, Profitability and Cost structure of eight vendors selling mobile phones between second quarter 2007 and second quarter 2011."
(I recommend selecting 1080p HD view and full screen to sufficiently resolve details.)
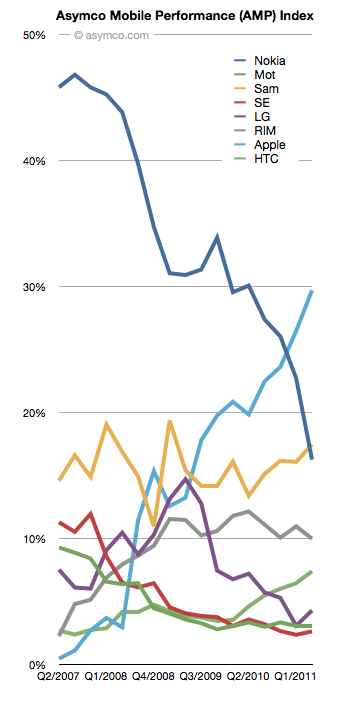
This is an updated view of the AMP index including Q2 data. As a reminder, the AMP (Asymco Mobile Performance) index is an unweighted average of four “shares”:
The updated index figures and spark lines are shown also on the right-most column on this site.
The biggest mover was Nokia which dropped 6.5 points. The second mover was Apple, with a gain of 3.2. Samsung followed with a gain of 1.38 and LG with a 1.21 and HTC with a gain of 0.95.
RIM lost about 1 point and Motorola and Sony Ericsson remained nearly flat.
The plunge in Nokia's AMP score is nearly matched by Apple's gain over the four year time period observed.
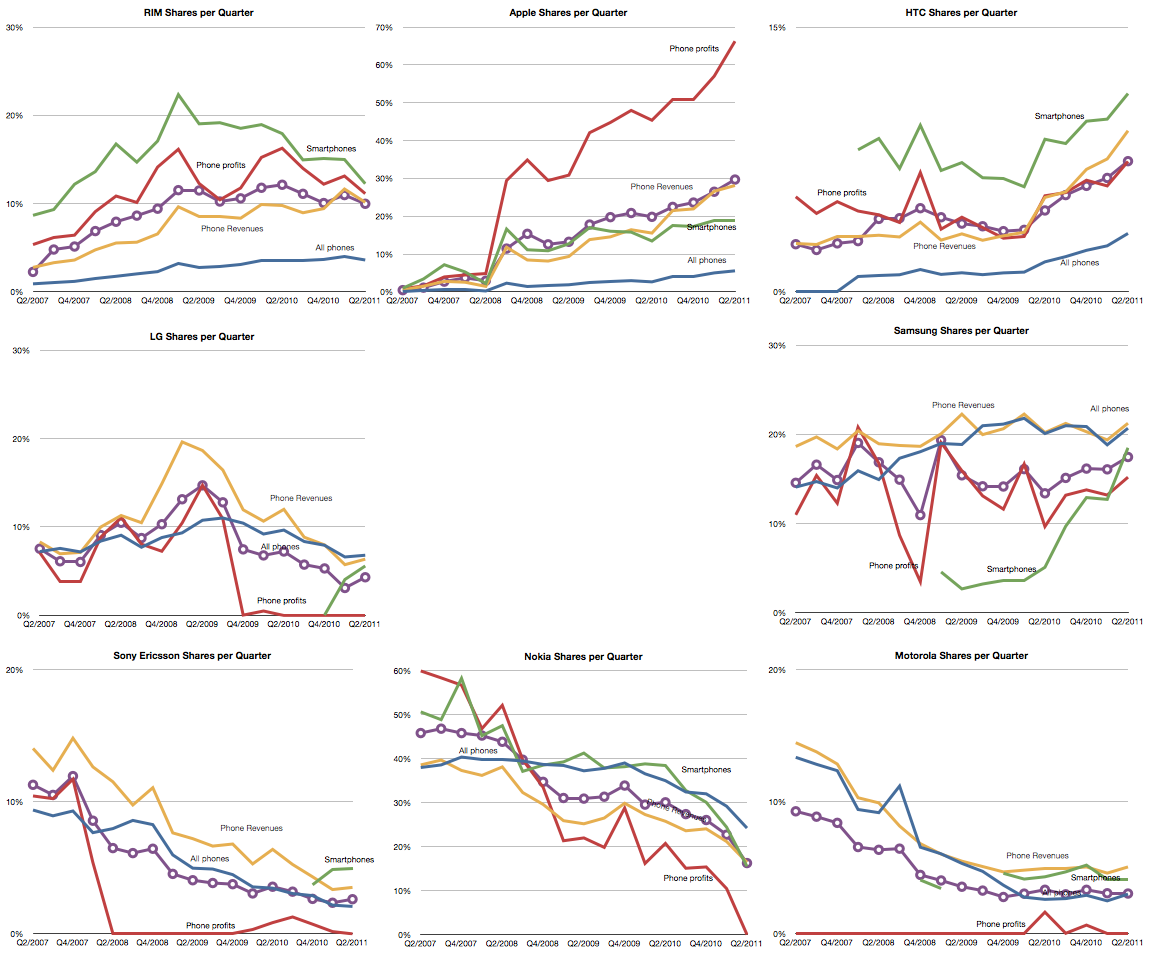
The full picture of each component is shown below:
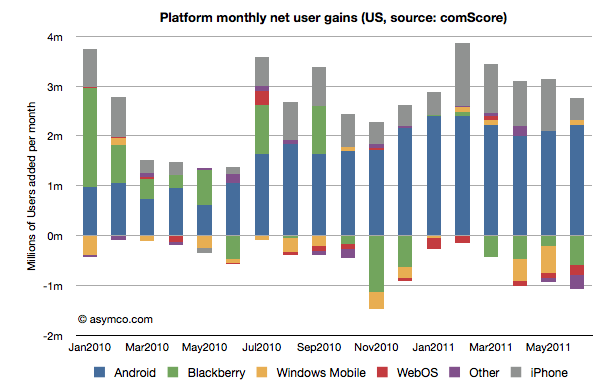
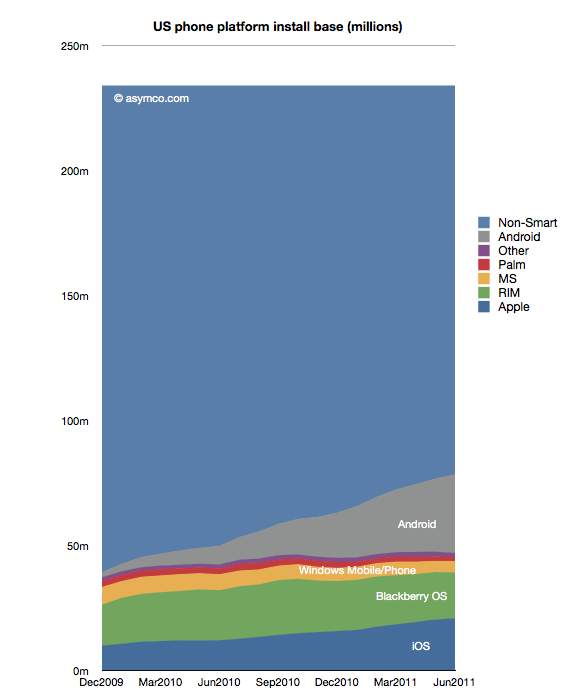
ComScore's latest survey data shows the following net user gains in the US smartphone installed base:
In summary, the key data points for June:
2.8 million new smartphone users in three month period ending June (vs three month period ending May)
Of the total 78.5 million users, about one million switched platforms
RIM had a net loss of about 600k users
WebOS lost about 195k users
"Other" (mostly Symbian) lost 273k users
Windows Mobile/Phone reversed two months of decline and added 100k users
iPhone added 452k users (considerably below its approximately 1 million/month run rate for last four months)
Android gained 2.2 million users, consistent with average over 7 months.
Platform "churn" was at 1.36%, about average over three months
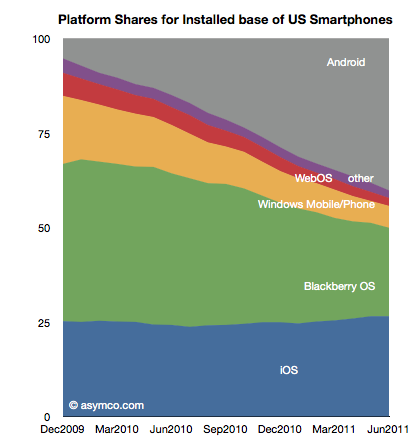
Installed platform shares for the US market are shown in the following chart
Platform Installed base vs. non-smart devices is shown below:
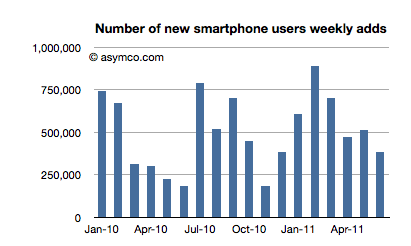
The penetration of smartphones slowed down in June (though that seems to be seasonal). The following chart shows weekly smartphone adds (or feature phone losses as total user base has held constant.)
Averaging the adoption rate over six months gives a "tipping point" forecast (50% penetration) of October 1st, 2012. That still means that 155 million American mobile phone users don't use smartphones.
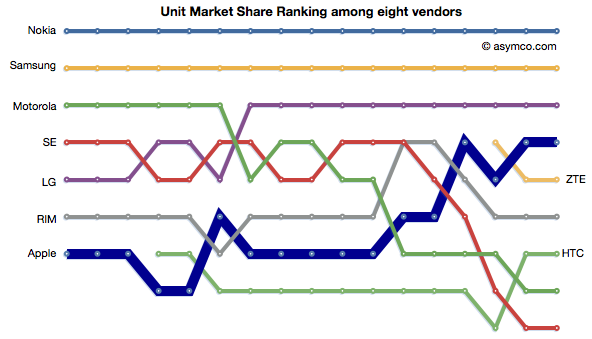
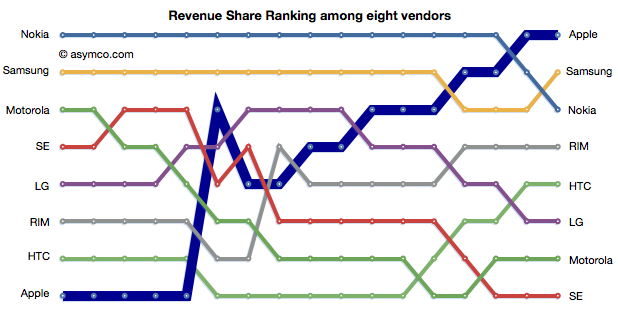
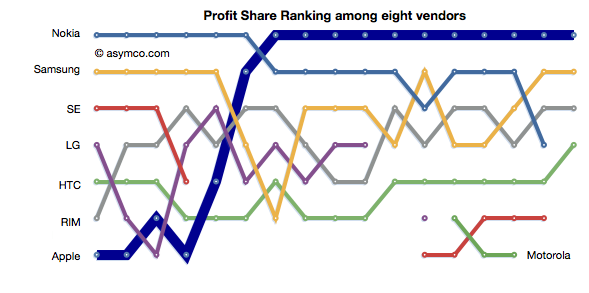
The phone vendors' ranking relative to each other on three measures of share (Unit or Volume, Revenues and Operating Profit) is shown below:
Although not much changed in the unit rankings since last quarter, revenues did see Samsung and Nokia trade places. In the case of Profitability, the chart shows a sparseness that is quite unprecedented. Only positive profit figures are charted.
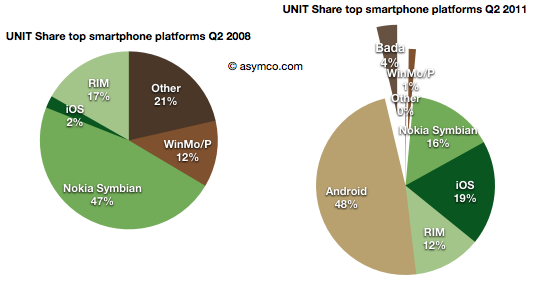
The violence with which new platforms have displaced incumbent mobile vendor fortunes continues to surprise.
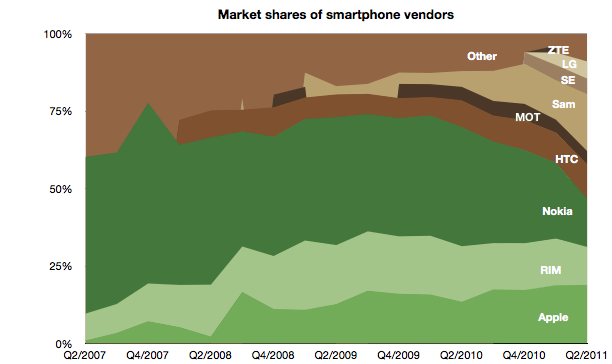
Nokia's Symbian platform has gone from 47% share to 16% in three years
Microsoft's phone platforms have gone from 12% to 1%
Other platforms have gone from 21% to zero
Although far less dramatic, RIM's decline from 17% to 12% is causing acute pain and anxiety
This while entrants have grown share in spectacular fashion:
Android from zero to 48% (A two year period)
iOS from 2% to 19%
Bada from zero to 4% (two quarters only)
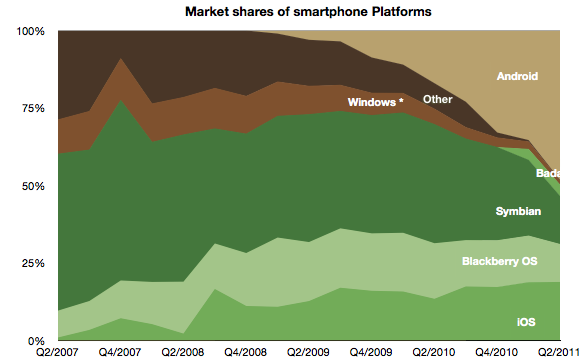
The picture of platform share over time looks like this:
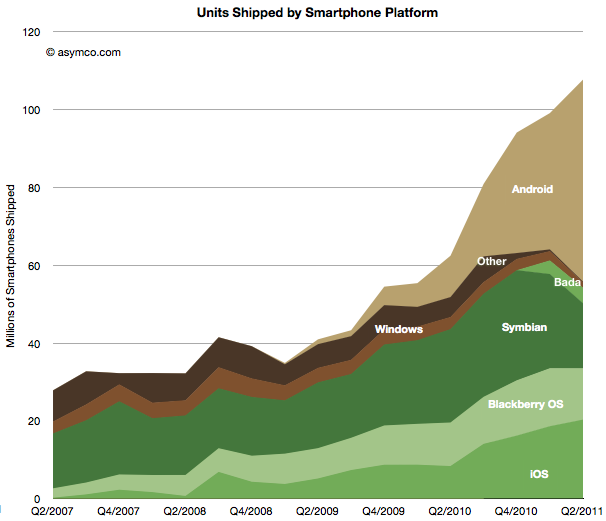
The platform volume growth is shown in the following graph:
Shocking
Or is it?
The surprising thing is that it should not be surprising. When the iPhone re-defined the basis of competition (at the beginning of the time frame of these charts) it unleashed forces which are still spinning the industry into a new configuration.
In that context, Android is a natural consequence. As iPhone created a threat, the response from all other vendors (other than Nokia and RIM) was to seek something that would sustain their business. Android was salvation.
It enabled the pursuit of better margins and hence better returns. So much so that Android offers the escape up-market they have always sought. It enables vendors to abandon the profit-free feature phones to low-end entrants like ZTE and Huawei.
LG, Samsung, Motorola and Sony Ericsson all took the bait. They are racing as quickly as possible to turn their feature phone portfolios into Android portfolios. This is certainly something that Google also wants to see happen and has been planning all along.
However one of the consequences of the modular (aka "open") approach is that the low end disruptors gobbling up low-end share are also motivated to move into the Android business as soon as it comes within reach. The only reliably predictable consequence of Android will be the postponement of displacement of the existing brands by the low-end entrants.
Is this fate unavoidable for all brands?
Clearly some vendors see the trap. For all its apparent failings, Nokia saw this outcome and chose to attempt a "Hail Mary Pass" with Microsoft. The strategic point being that because they no longer had faith in their ability to execute on an independent platform, they would pick a platform that gave them at least some control or leverage. There are serious risks and problems with this approach--something which has been covered here already--but the bet being made is a clear rejection of the slippery Android slope.
RIM is trying to resist with QNX which is a similar approach but timing may also be the undoing of this strategy. HP's approach with WebOS and Samsung's Bada are also hedges to avoid this fate.
And what about Apple?
Apple is always skating in a different direction. iOS needs to be seen as not so much a phone platform but a computing platform. Given what we know, iOS was always conceived as the future of computing. Voice, after all, is just an app on iOS. So my expectation is that Apple's iOS will continue its attack on the mobile computing market, skimming (or carving as the case may be) profits from the phone business to sustain its ultimate target of reclaiming the computing universe.
By this thinking iOS lives only by improving more rapidly than anything else in dimensions that redefine the basis of performance. In other words, doing more of what the iPhone did in the first place to set off this disruption.
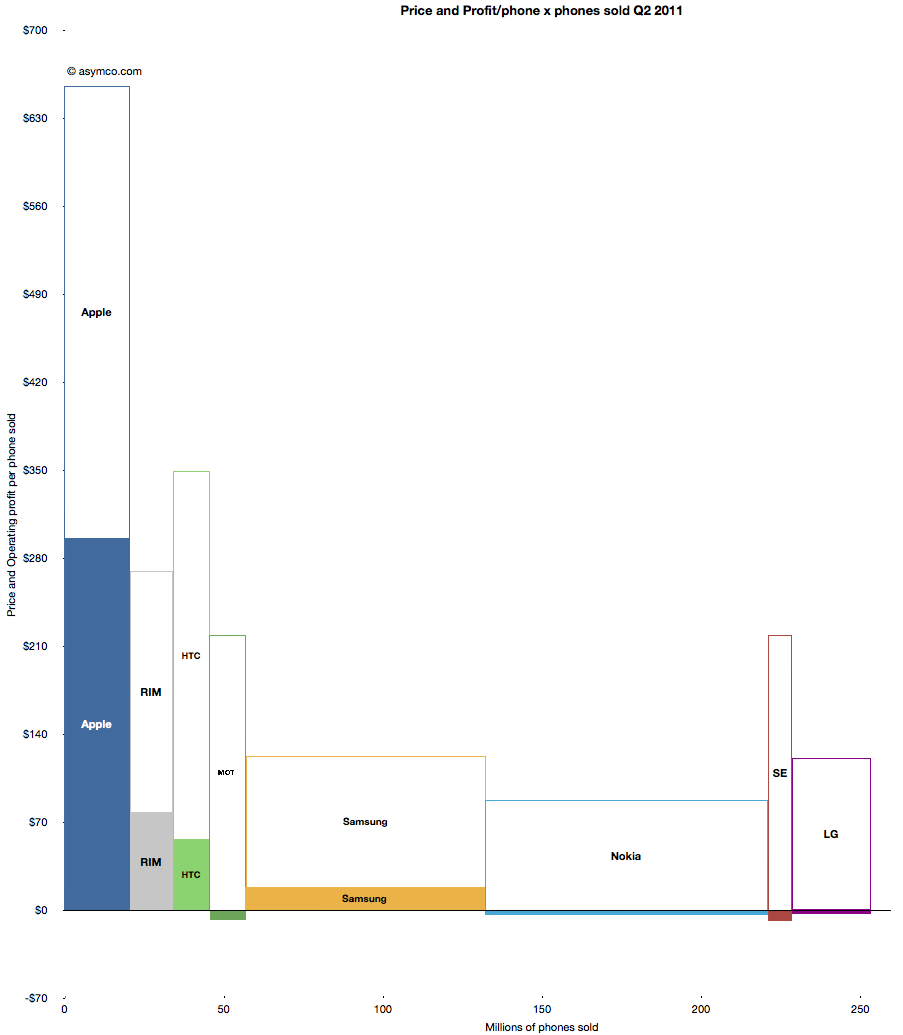
The profitability (aka Profit/Phone x Phones Sold, aka Rawr) chart is a great way to see the "shape" of the industry at a glance, with attention to volume and profitability.
What is missing however is a perception of the sales level and the pricing of the products. To help in that regard, I prepared an extension to the profitability chart which covers the price and sales for each participant.
You can interpret this graph as an extension of the profitability chart where the "empty" or white areas above each profit area are payments to suppliers and operating expenses. Thus the sum of empty and filled areas (above zero) are equivalent to revenues. If the sum of the empty and filled areas are greater then revenues (i.e. they extend below zero) then the difference is operating losses.
The top of both empty and filled rectangles are set at the average selling price per phone (and the top of each filled rectangle is the operating profit per phone). The width of both rectangles is the volume of phones shipped.
The things you can read into this chart are:
Margins at a glance (ratio of filled area to total area)
Sales as well as profit relative to peers (top of each box relative to others)
Pricing power (overall top relative to competitors)
Any combination of the above
Finally, the sum of all the areas are the overall market revenues for the quarter. Sum of white areas are expenses and sum of solid areas are profits & losses.
A natural evolution of this chart would be to animate it across multiple quarters/years.
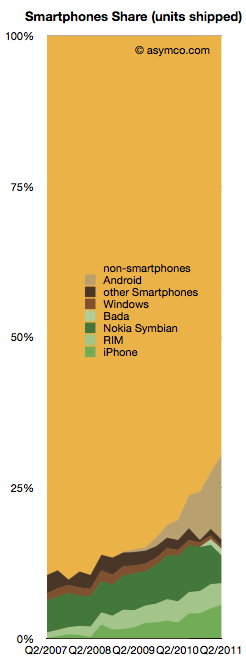
Smartphones made up about 30% of global phone sales last quarter. That is a significant increase from 10% in Q4 of 2007.
From this perspective, iPhone obtained 5.6% share, Android 14.2%, Nokia Symbian 4.6%, RIM 3.6%, Bada 1.1% and Windows 0.4%.
The competition however still has 70.5%.
The chart to the right shows the challenge remaining and the progress being made.
The good news is that the non-smartphone market is not growing while the smartphone market is. In fact, the non-smart market has had a three year CAGR of 0% and a y/y growth of 1.0% and a sequential decline of 6%.
The non-smart portion of each branded vendor's business is pretty dismal:
Nokia saw 17.57% decline y/y
Samsung's non-smart business declined by 8.14%
Sony Ericsson's dropped by a dramatic 80%
LG's fell by 38.56%
Motorola is the only one that grew y/y, by 17.86.
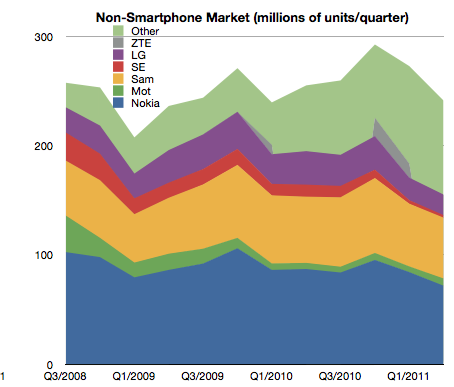
The reason all these brands fell is because the unbranded vendors took their place. "Other" non-smartphones grew by 43%. They have been sustaining growth at the rate of 57% compounded over three years.
The following chart shows the increasing share taken by the "other" vendors in non-smartphone units:
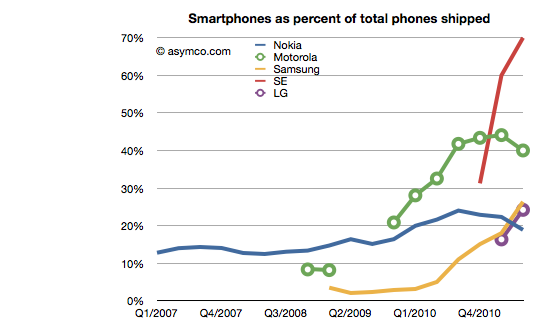
The non-smart business is so dismal for branded vendors that I've been assuming that they will cease to build such devices in the near future.
The trend is shown in the following chart which shows the percent of units for branded vendors which are smartphones.
Motorola, Sony Ericsson and Samsung are fleeing to smartphones as rapidly as they can. LG is following as quickly as possible as well.
The only question remains with Nokia. While their smartphone business evaporates they've also made a commitment to the non-smartphone market and are thinking about "the next billion" users who, presumably, will not buy smartphones and will buy some variant of Nokia's Series 40.
Targeting the low end may be commendable, but the question they need to answer is why would those next billion buy anything other than a low cost smartphone? And if not, then what's so different about the next billion?
Nearly all the data on smartphone shipments is now available for the second quarter 2011. Some fragments are still not public, including ZTE and Huawei (and any others) shipments. We also have estimates for the various platforms including an estimate for Windows Phone and Bada (though not for WebOS).
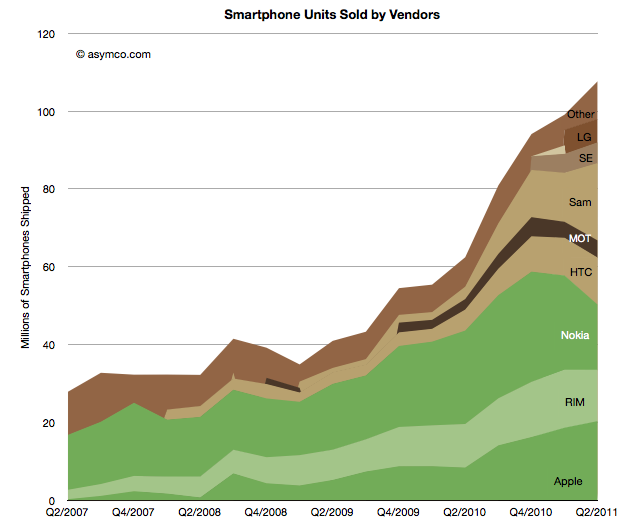
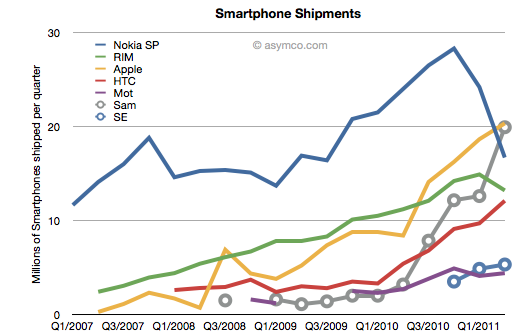
This allows the following chart:
Using the traditional color scheme which separates "integrated" from "modular" vendors, the chart shows overall volume growth and how the volumes are split among vendors.
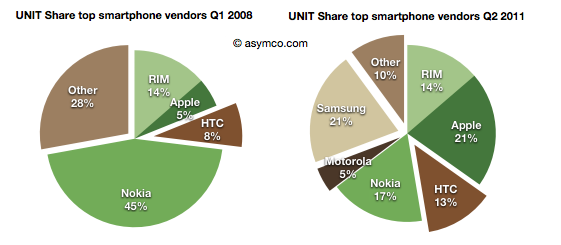
The market grew at about 73% y/y and 50% compounded over three years and 9% sequentially. The y/y growth rates for individual vendors were:
Samsung 525%
Apple 142%
HTC 124%
Motorola 63%
"other" 29%
RIM 18%
Nokia -30%
In terms of unit share, the pie charts below show the before and after (three year span):
And the stacked area below shows every quarter over a four year period.
The story is largely unchanged since last quarter except perhaps in the rapidity or deterioration in Nokia's performance and Samsung's partial exploitation of that decline.
It should be noted that not all of Samsung's volumes are licensed platforms. An increasing share of Samsung smartphone volumes is Bada, an internally developed OS.
In the charts above I arranged the bars to place Nokia and RIM in the middle to show their double envelopment. A pincer movement is only an analogy but perhaps it's evocative of what's happening.
The number of Bada phones shipped last quarter is not public, however some assumptions can be made that lead to plausible estimates.
First, we know that Samsung shipped about 3.2 million smartphones in Q2 2010 and that total included Bada and Android (and perhaps even some Windows Mobile).
Second, we know that there were about 19.9 million smartphones in Q2 2011.
Third, Canalys published an estimate that Bada grew by 355% y/y.
So if we knew how many Bada phones shipped in Q2 2010 we could derive the current Bada shipments and also realize how many of the nearly 20 million smartphones from Samsung were actually Android.
The clue is in an estimate from December last year that suggested that there would about 5 million Bada shipments in 2010. Coming close to the end of the year, and from Samsung directly, we can be pretty sure the figure is accurate.
Taking this 5 million and spreading it over four quarters could give us enough of an estimate. That makes 1.25 million quarterly units. If we assume some seasonality or increase toward the end of the year, a Q2 figure of 1 million might be more accurate.
Therefore, applying the 355% growth rate yields a Q2 2011 estimate of 4.5 million Bada shipments and hence about 15.4 million Android devices from Samsung last quarter.
Considering the increasing importance of Bada to Samsung, it should be clear that Android is not the only source of growth for the company and its transition of feature phones to Bada as well as Android is a key strategic driver for differentiation vis-a-vis low end entrants.
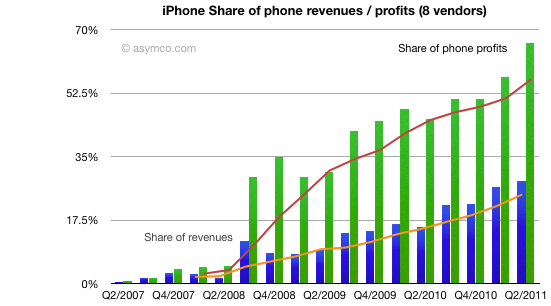
As previously pointed out, Apple reached two thirds profit share in mobile phone vendors among the eight vendors I track. The following charts shows the historic growth in that share and the share of revenues (including 4 quarter trend line). Revenue share increased to 28% in the last quarter.
The share doubled from Q4 2009. I should also point out that it was the highest of all the competitors. The following chart shows the split over time:
The dedicated smartphone vendors (highlighted with segment bars) are now at 47% of total sales, a significant increase from the 6% share they held four years ago. Another remarkable show of entrant power and incumbent weakness.
At the end of last year I was saying that the smartphone boom was a tide that lifted all boats. That is no longer the case.
But the big story is that there has been a clear non-seasonal counter-cyclical decline in Nokia and RIM's smartphone performance. RIM's steady rise has come to an abrupt halt. Nokia's decline has accelerate precipitously. So much so that Samsung and Apple have overtaken Nokia and RIM and it looks like HTC will overtake RIM within one quarter and perhaps Nokia as well.
The fortunes of vendors is now clearly tied to the fortunes of their platform choices. Android has a spotty record with Samsung[1] and HTC having accelerated growth with Android, Motorola and Sony Ericsson have not rallied to a similar degree (though they did remain operational). But it's at least very clear that BlackBerry OS and Symbian are now a burden to their owners.
The fact that not all vendors benefit from a boom indicates that the early, happy days are over. People are noticing that there is a difference between smartphones and are not buying any and all. An era of competition will follow. I hinted that such a shift would happen when a "tipping point" was forecast and that point has been reached in several mature markets.
The consequences are that weaker platforms and vendors will come under increasing pressure.
---
Notes:
Samsung decided to stop reporting the number of smartphones they sell. They also refuse to report the break-down between different platforms--they sell Windows Phone, Bada and Android devices. The figure I gave to Samsung is 19.9 million units, higher than 19.0 and 19.3 million from other analysts.