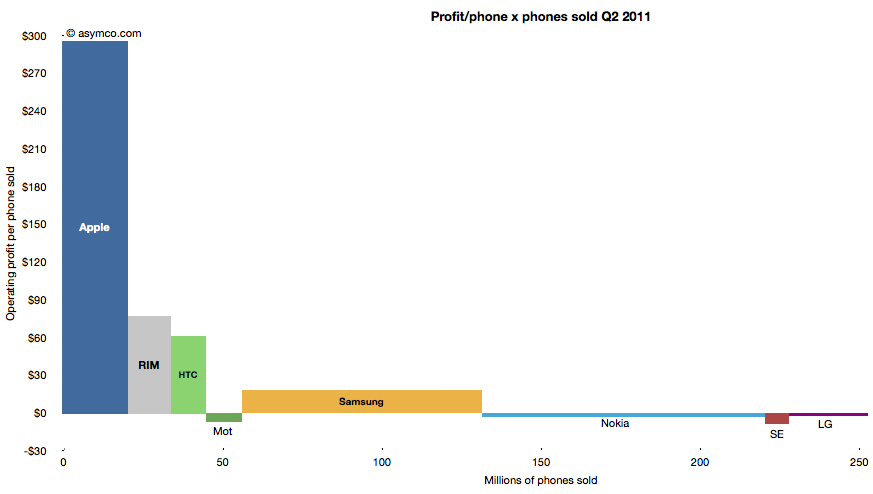
The following chart shows the current profit distribution between phone vendors with an eye toward identifying volume dependencies. The vertical axis represents operating profit per phone and the horizontal axis the number of phones sold.
The area of each vendor bar is therefore the total operating profit that vendor captured. A vertical (portrait) orientation implies high profitability with relative low volume while a horizontal (landscape) orientation implies a high volume/low profitability focus.
The other important observation is that bars can also be negative. Those vendors' names are listed below the bars rather than within them.
You can also compare the chart with the one from last quarter:
The major publicly traded phone vendors have all reported results for the second quarter. Based on the data available so far we can begin putting together a picture of the market.
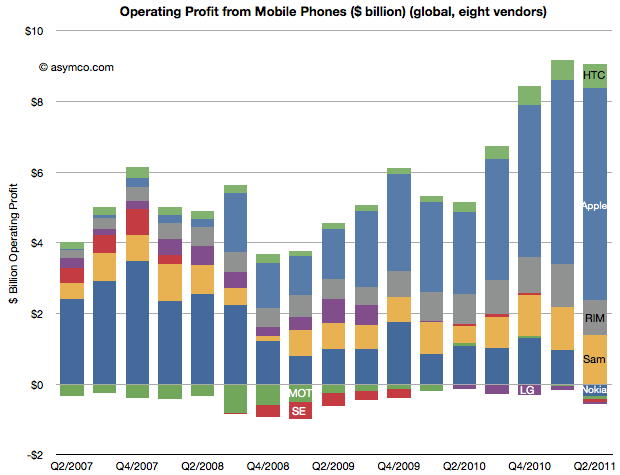
The first picture I'll draw is usually the last: profitability. The following chart shows operating profit from the sale of mobile phones among the eight vendors I follow (Nokia, Samsung, LG, Sony-Ericsson, Motorola, HTC, Apple, RIM).
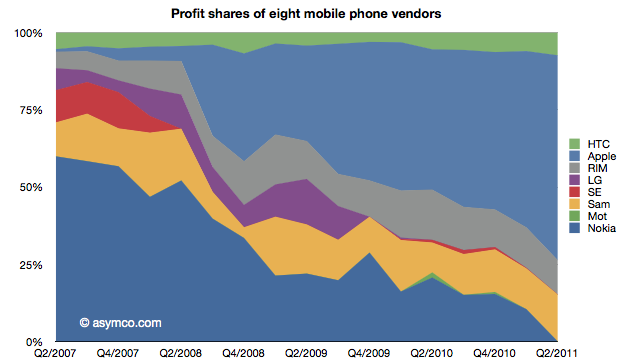
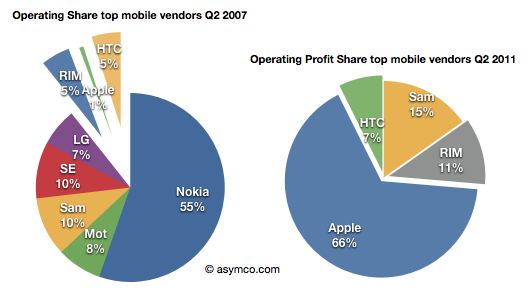
This quarter saw a slight sequential decline in overall profit for the sector, but four vendors did not manage a profit from selling phones. Nokia, Motorola, Sony-Ericsson and LG all saw losses. The other vendors split the slightly decreased pie with Apple getting two thirds of it (66.3%)
This share is up from 57% in Q1 and 50% in Q3 and Q4. Samsung's share went to 15%, though that's not a peak level historically. In Q1 2008 the company was at 21%. RIM was at 11%, a level in a range that has been unchanged for three years. Finally, HTC captured 7.4%, a new high and an increase from 6% since last quarter. The profit share chart follows:
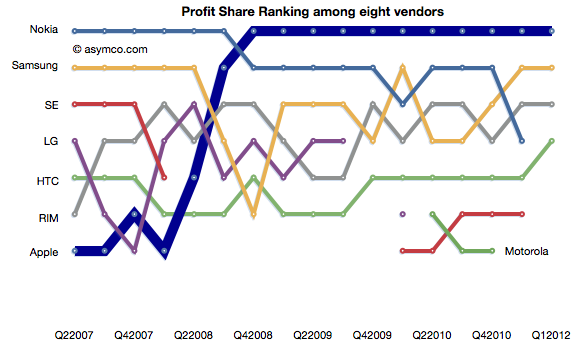
The ranking chart for profitability follows:
Finally, the "before-and-after" view of profit capture showing the change in profit share over a four year period.
The story remains largely unchanged from last quarter: Three companies which captured 11% of the profits before the modern smartphone era started (four years ago!) now capture 84% of the profits. Only one global brand phone vendor selling non-smart voice-oriented feature phones is still profitable however, as we shall see later, the only reason profits still exist for any vendor is due to the strength of their smartphone portfolio.
As Verizon has reported iPhone sales for one and a half quarters, it's time to try to discern the impact on the product. There were several hypotheses floating around prior to the "big bang" of Verizon.
Some assumed that there would be a large migration away from AT&T and that AT&T iPhone sales would slump. Others that there would be no Verizon iPhones volumes at all because there were so many Android users already converted. There were also suggestions that the iPhone would explode in growth with two major operators carrying it.
What really happened?
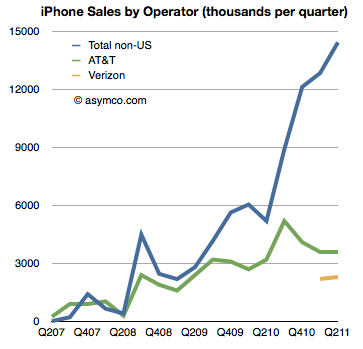
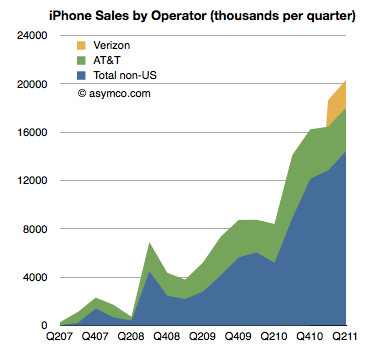
The first chart shows historic AT&T activation with Verizon activations added. It also shows sales to "none of the above", namely non-US sales of iPhones[1].
AT&T iPhone activations show no significant impact from Verizon and Verizon itself shows a modest start to sales[2]. What did not happen is an exodus from AT&T. We also did not see a rejection of the iPhone by Verizon customers long exposed to anti-iPhone Droid advertising. We also did not see a considerable impact of Verizon on growth.
Verizon did contribute (4.5 million Verizon iPhone users is nothing to sneeze at) but the contribution was to a degree that was nowhere near a big bang.
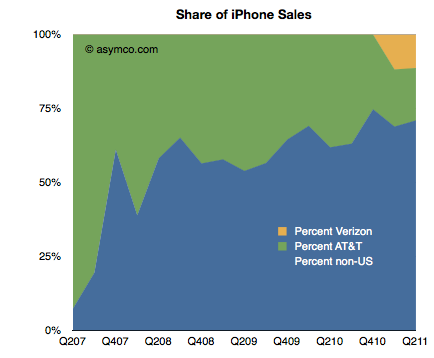
That was because the real big bang was from the rest of the world. The same data in the first chart is shown below as a stacked area chart and a share chart. Had Verizon not come on board the business would still have grown year-on-year over 100% (and sequentially).
The US activations have been decreasing as a percent of total iPhones sold. Before Verizon came online, the US share was decreasing (from an average of 45% share in 2008 to 33% in 2010). After Verizon, the US continues to slide to an average of 30% share (two quarters).
After waiting nearly four years, American observers of the iPhone could perhaps be excused for their obsession on the impact of expirated AT&T exclusivity. But the real impact is that by the time it came, it was moot.
It would be a mistake to look upon Q1 and Q2 and say that the explosive growth was due to Verizon or the end of US exclusivity.
The global market is far greater than the US and the iPhone business has simply grown to reflect that.
---
Notes
Non-US sales are total iPhones sold minus activations in the US. There is the possibility that some of the unactivated phones were activated on T-Mobile or that there is some delay between purchase, channel inventory and activation, but the time frame shown should smooth out any of the noise.
What we don't know is what was the impact of iPhone sales start on Verizon's other smartphone platforms. Unfortunately, Verizon does not report overall smartphone sales/activations so we can't conclude directly that iPhone has slowed other platforms on Verizon. Some other data (NPD, Changewave, ComScore) do indicate some slowing in Android growth in the US but we have no definitive data to prove it.
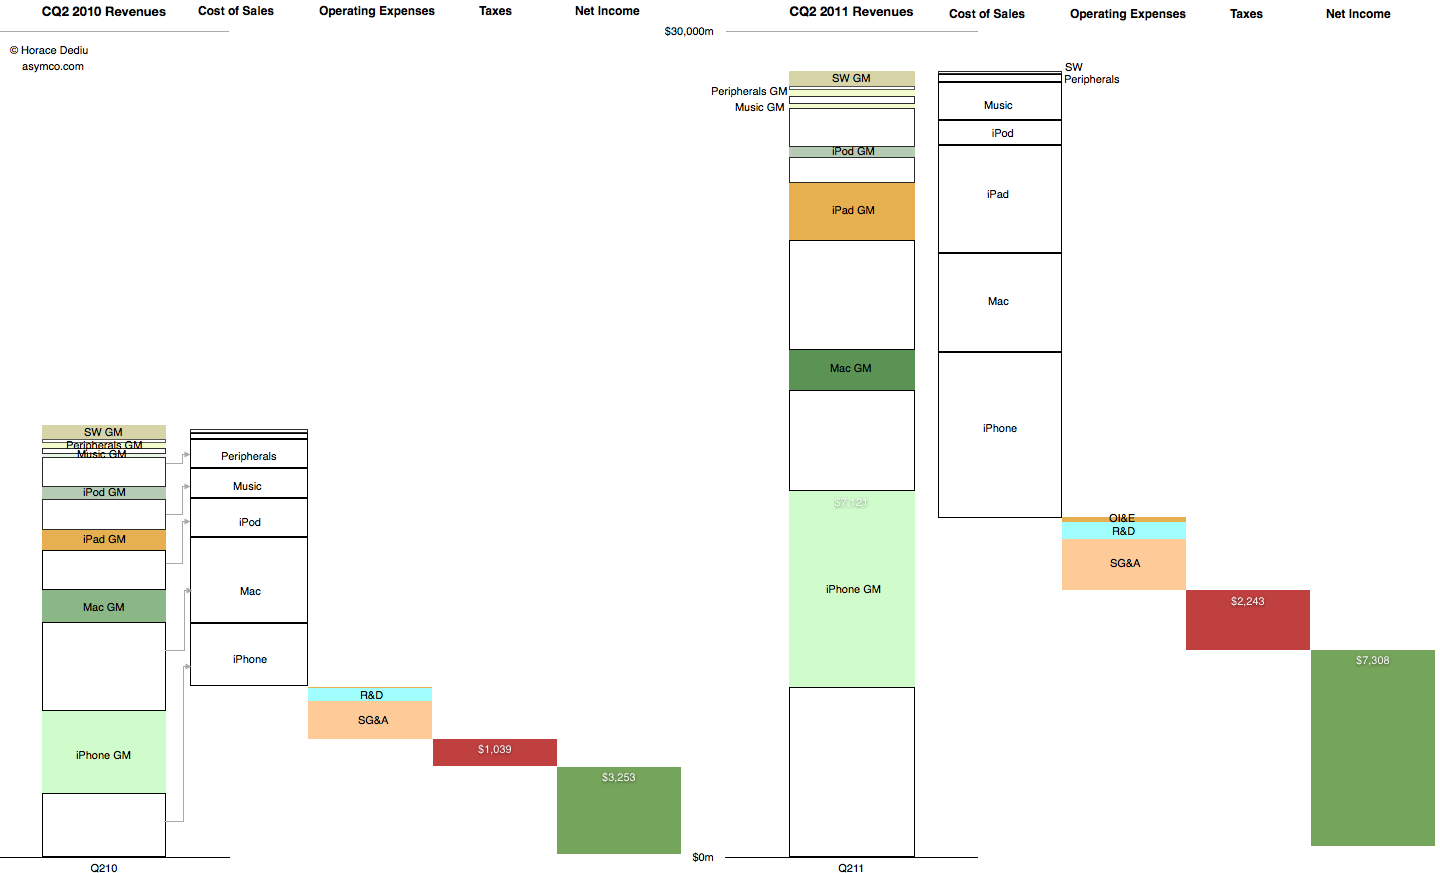
This graphic representation of the current and year-ago sources of income and sources of expense for the company shows how the business evolved in the last year.
The colored segments in the first column are Gross Margin contributions per product for Calendar Quarter 2, 2010. The white segments are cost of sales for those products. These costs are combined in the second column and the operating expenses are shown in the third column, taxes in the fourth and Net Income is shown in the fifth.
The same information is shown for Calendar Quarter 2, 2011. Click for larger view (1440 x 873 pixels)
The increase in the first columns is the "top line" growth and the increase in the last (fifth) columns is the "bottom line" growth
Similar charts for the last few quarters are shown here:
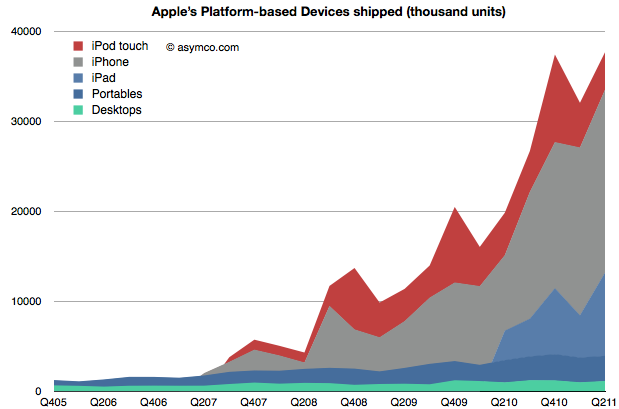
When Apple changed its name from Apple Computer to Apple Inc. they signaled that their business has moved on. We can say it's to devices or to mobile computing or to the Post-PC era. To understand that this is not a shift driven only by wishful thinking we can plot the change in volumes for the platform-based devices Apple sells.
The stack of products is shown in an increasing level of mobility. At the bottom is the non-portable desktop Mac, above are Mac portables (laptops) followed by the iPad, iPhone and iPod touch. The mobile computers Apple sells are explosively more popular (and important).
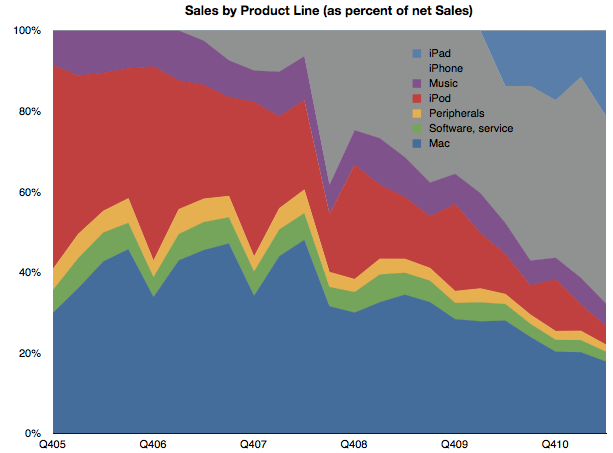
To gauge importance consider the following chart which shows the unit values above multiplied by the average price they are able to obtain for a picture of the sales mix.
(I also added Peripherals, Music and Software sales as well as iPod (non-touch) for a complete split of revenues).
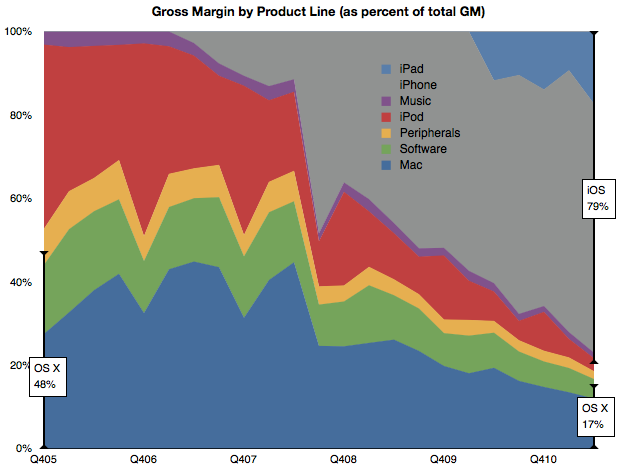
Mobile computers are now well above half the revenue base for Apple. Finally, if we consider the contribution to profitability of each product line, we can see how iOS-enabled products (as a proxy for mobile computing) have become the vast bulk of profit creation for Apple.
By this metric, we can see that mobile computing (as opposed to portable or immobile computing) is driving 80% of Apple's profitability. This 80/20 mix of mobile/non-mobile should put aside any doubts that Apple has moved on to be a business oriented around mobility rather than traditional computing.
This cannot be said for many of Apple's contemporaries. Microsoft derives negligible revenues from mobility. Neither does Intel, nor Dell or HP and even Google's revenue lines don't make mention of mobile income.
In fact, the only companies which do have mobile revenues as 80% of their income are those dedicated to telecom markets. Namely, Nokia, Motorola, Sony Ericsson, RIM et. al. But, as we shall see in the quarterly mobile market overview, few of Apple's mobile-focused competitors are doing well.
So Apple is a unique company that has made the transition from one industry to another and, in so doing, captured the bulk of the profits. In passing, I should also mention that the traditional Mac business is still doing well and, by some measures, is capturing the bulk of the PC hardware profits.
So the key to much of assessing Apple's value and opportunity should be based on this new market (mobile computing) rather than the traditional competitive landscape of PCs and operating systems. The company has moved on, now we wait to see how long before analysis of the company follows.
In a new ad for the iPad Apple once again makes the case that the tablet is a good substitute for a PC in a number of use cases (and permits some new ones.)
We'll never stop sharing our memories. Or getting lost in a good book. We'll always cook dinner and cheer for our favorite team. We'll still go to meetings, make home movies, and learn new things. But how we do all this will never be the same.
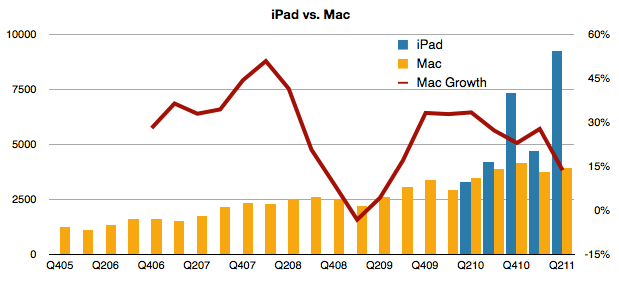
This belief that the iPad "cannibalizes" the PC is a powerful concept. The growth of the PC has certainly been affected. But has the Mac's growth also been affected?
Tim Cook seems to think so. In the earnings call he said:
In terms of cannibalization, we do believe that some customers chose to purchase an iPad instead of the new Mac during the quarter, but we also believe that even more customers chose to purchase an iPad over Windows PC. And as I've said before, there's a lot more of the Windows PC business to cannibalize than the Mac.
If we look at the behavior of Mac vs. iPad, the following chart may be useful:
First off, we can observe that since introduction, iPad has always sold more units than the Mac. Now it's selling more than twice as many units and the revenue from those units is higher than those of the Mac. The other line to look at is the growth (y/y). During the time that the iPad has been shipping, the Mac growth has been declining.
Yes, it's still growing at five times the rate of the PC market (and 7.5 times the rate of Windows only PCs), but the iPad phenomenon is indeed affecting the Mac.
With the launch of Lion, Apple is clearly showing that there is dramatic improvement potential in traditional personal computing. But increasingly the improvements are "borrowed" from touch interfaces. Clearly, as the ad implies, computing will never be the same again.
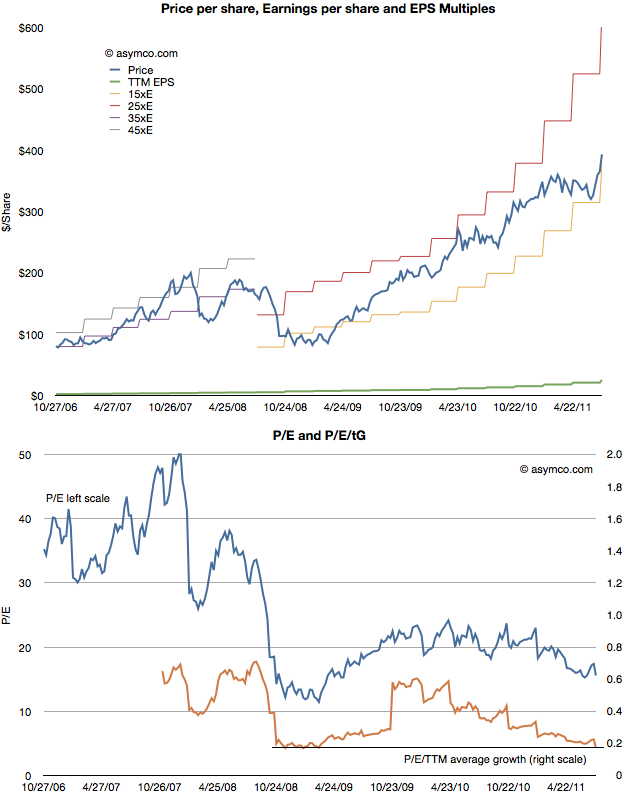
After Apple reported earnings growth of 125% its share price dropped to a P/E of about 15. This reduction in valuation is part of a trend I've written about for over a year so there were no surprises. The first chart below shows how the stock has traded between increasingly lowered P/E bands.
As the second chart shows, not only is the P/E ratio declining, but when seen against the trailing twelve months (TTM) average growth rate, the P/E/TTM ratio is now at the lowest since the great recession (around 0.17--a value of 1.0 is a rule of thumb for "fair value" in a growth stock).
Those values include cash. Excluding cash, the P/E as of Friday was 12.4. On a forward basis (my estimate--which has shown be be conservative lately) the P/E is around 7.
Perhaps some day in the future investors will come around to looking at Apple as a growing company, but there has been no such inclination for over two years. As I've pointed out numerous times, growth and valuation are moving in opposite directions.
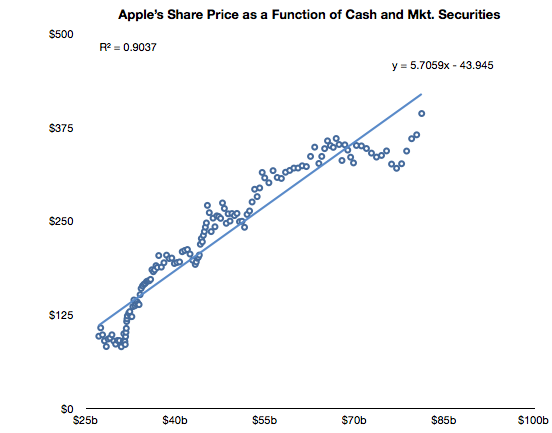
The only correlation to the stock price has been found on the balance sheet, not the income statement. Looking again at the relationships between cash and the stock price, we see a clear relationship (r squared of .9)
After a lapse during the first quarter, the relationship that has been in place since October 2008 is returning.
Note the formula of the trendline which allows some interesting guesses on what the stock price will be. For example, putting $95 in cash per share results in a share price of $500. Let's see if the relationship holds until then.
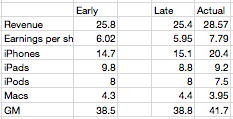
Later in the quarter I updated them for submission to Philip Elmer-Dewitt's blog at Fortune. The original and updated figures are shown in the following table (with actuals).
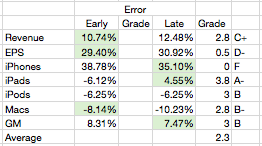
The changes were not significant except in a reduction of iPads. Three items were better in the early call and three were better in the late with one item equal. Using a simple method for scoring the results I gave myself the following report card:
As the Revenue and EPS figures are dependent on the other line items, the most significant error is clearly the iPhone where the error was over 30% (and hence deserves an F). The other figures were not very close either so the overall grade point average is a very mediocre C (2.3).
So, as in previous quarters, nailing the iPhone number is everything. Having failed to guess correctly, the whole performance fell apart.
So how did I manage to get the iPhone number so wrong?
My forecasts depend on a few theories:
Overall production capacity is increasing at approximately 100%/yr.
There is significant seasonality due to production ramps as the product is updated on a yearly cycle. These cycles are tuned to reach maximum throughput during the US holiday period. I discussed this theory here.
Demand is practically unlimited and is throttled by both production schedule and distribution agreements
I successfully applied these theories to the iPhone for over three years and it has always yielded very good (above average at least) results. However, when we reach a point of failure we need forensically consider where the theories failed.
What I suspect happened is that the second theory no longer holds. What I expected was that as the iPhone 4 was reaching the end of its cycle, growth would moderate (as it did last year with the 3GS and we ended up with 61% growth into the last quarter). The reason growth would moderate was that Apple slowed production of the old model in order to switch out to the new model--we saw the same thing happen with the slowdown in iPad 1 and transition to iPad 2.
Instead, what Apple did this year was open the taps on production of the iPhone 4 as it extended its lifetime beyond the traditional 12 months. In other words, the pipeline was not "drained" ahead of a new ramp. Distribution was also boosted with a burst of new operator deals which actually enlarged the pipeline.
So we are witnessing a pivotal moment in the product's strategy. By slightly lifting off the gas in terms of product cycle, Apple actually set the iPhone loose. The imposition of a yearly cycle on the product coupled with unlimited demand caused it to be artificially constrained.
So I can only reach a conclusion dripping with irony: by stepping off the gas the product actually accelerated.
This phenomenon will allow the company to unleash a wave of unprecedented growth which might claim another theory as victim. Namely, is the limit of 100% growth about to be breached?
----
Footnote:
A theory approach to forecasting means that you have to stay true to the theory even if there is anecdotal evidence that may suggest you are wrong. If you bend to the anecdotes then you will not learn from failure. If you stick with the theory and ask where it went wrong, you will build a better theory.
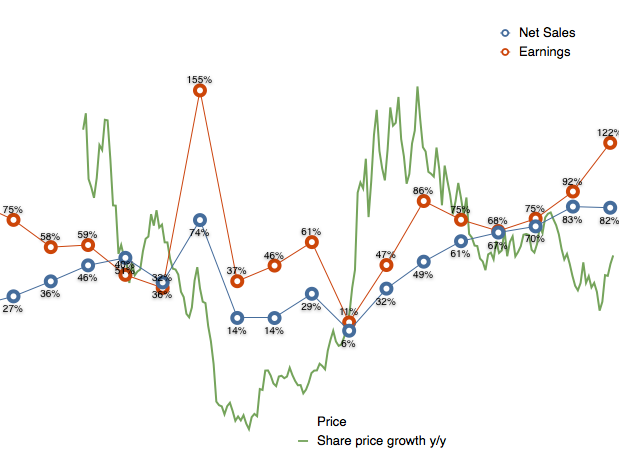
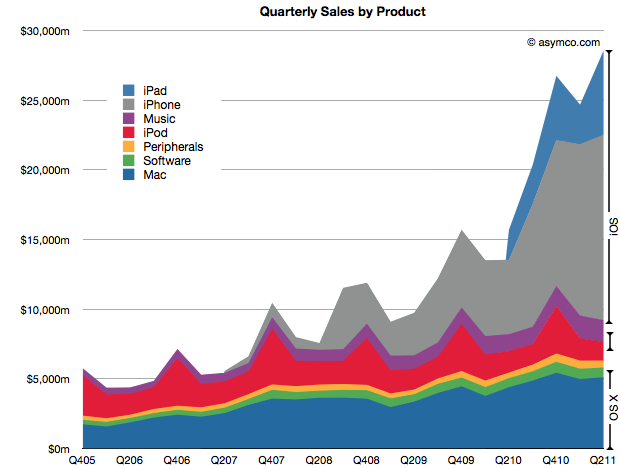
Apple's second calendar quarter was a record breaking performance. This is surprising because it shows super-seasonal performance. For as long as I can remember the fourth calendar quarter (i.e. holiday) was always the strongest quarter, by a large margin. This quarter was higher than the last holiday quarter. A glance at the following chart shows the anomalous performance:
iOS products make up 71% of sales (and at least 78% of profits) which makes the following growth scorecard a bit moot.
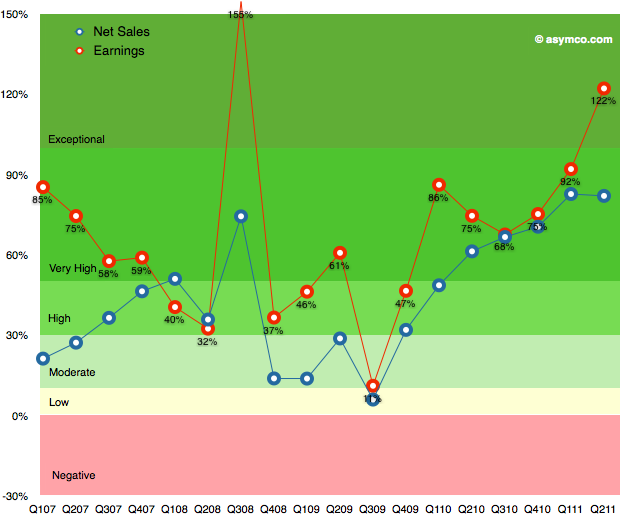
The growth in iPhone sales of 150% is hard to understand given the previous product cycle, but more about this later. The 122% growth in profits is (nearly) unprecedented. The growth in Q3 2008 was due to the launch of the iPhone 3GS and since there was no iPhone launch this quarter the growth shatters existing assumptions about the franchise.
The pattern in the table above is shown in the following chart:
This performance needs to be digested and contemplated a bit longer but I will make one early conclusion: One of the most common themes during the last year was that Apple's growth rate was unsustainable. The theory cited was one of the "law of large numbers". Apple's performance shows it to be nonsense.
Instead of decelerating, Apple's growth is accelerating.
Almost all valuation models for Apple assume it's a hardware company. The modeling algorithm for hardware is simple:
For each year in near future
For each product line
Compute contribution
Determine company value by summing contributions and multiplying by a P/E ratio
The major difficulty is in predicting the growth of each product line. This is difficult because buyers can be fickle. Companies employs all sorts of tools in order to secure repeat customers but if switching costs are low, the company can crash in value. For this reason, analysts pick various ways to predict device sales. Some choose to index each product on production (channel checks), demand (customer surveys,) or even on a top-down share of total (market research on growth of whole market and assumptions of share).
Although simple and convenient, this model does not probably match the way Apple is managed. The company does not build hardware products to sell and forget. It builds platforms which are best seen as sources of recurring revenues. Users are incentivized to continue buying devices. iCloud, iTunes and other Apple properties are expressly designed to that goal--and they are not cheap to run. So, the company must see the world through a different set of lenses than the default model shown above.
To think about the business like they do, we need to put the data through a similar set of lenses. I began with a modest proposal last month to value each user as a source of recurring revenue. Now it's time to expand on this method.
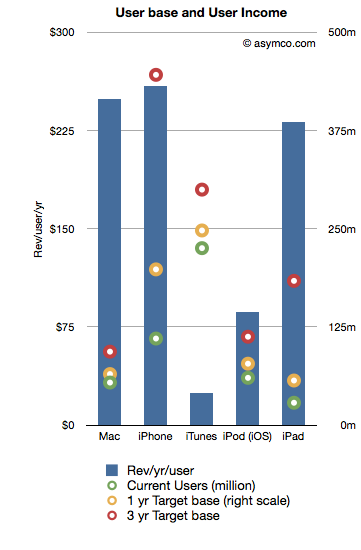
The following chart shows the recurring revenues per user by product and the current and possible future size of user bases.[2]
Revenues/yr/user are bars with the left axis and the User bases are various colored circles indexed with the right axis.
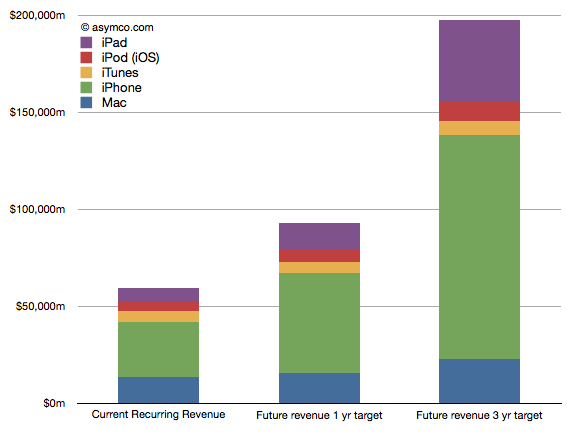
The assumptions that went into the data are as follows:
Device life span is as per previous article linked above
User base growth for 1 year is: Mac 20%, iPhone 80%, iTunes 10%, iPod 30%, iPad 100%
User base growth for 2nd and 3rd years (recurring): Mac 20%, iPhone 50%, iTunes 10%, iPod 20%, iPad 80%.
The Revenue per user is assumed constant
Note that the user base growth figures are lower than the product growth levels seen historically. Obviously, the model is highly sensitive to these growth assumptions so they need to be scrutinized and tested rigorously.
Nevertheless, as a straw-man proposal, the recurring revenues for all these products[1] is shown in the following chart:
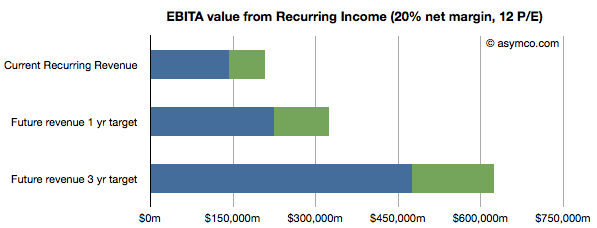
Once the income is estimated, we can take that value and assume a profit margin (net) and then multiply the earnings by a multiple. Using a 20% net margin and 12x P/E yields the following chart.
(I added an assumed level of cash in green.)
This model would imply that the company today could be valued at $208 billion on the basis of its installed base alone. That value would be about $323 billion in one year and $620 billion in three years. Dividing by the number of shares outstanding (935m this year increasing at 2% a year) yields a share price of $222, $339 and $629 by mid 2014.
These values can be considered "lower bounds" on valuation since they assume income from previously secured customers. The speculative part of investment would be based on what the future bases will look like (so, for example, if one believes these assumptions, the $629 figure could be considered a target to be discounted to today).
---
Notes:
Excludes Software, Peripherals, non-iOS devices, and any other service revenue.
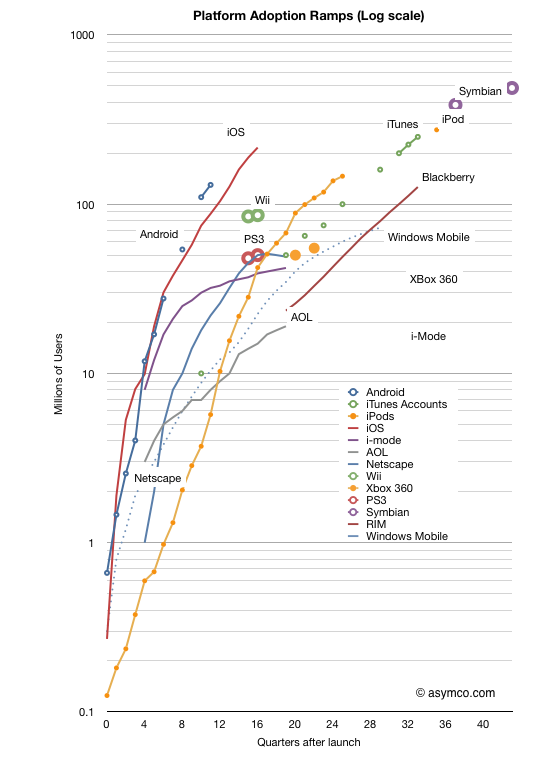
In the last two weeks we received two more data points which allow an update to the "race to a billion" platform growth trajectories. Android reached 130 million active users and iOS reached 200 million.
The updated picture looks like this:
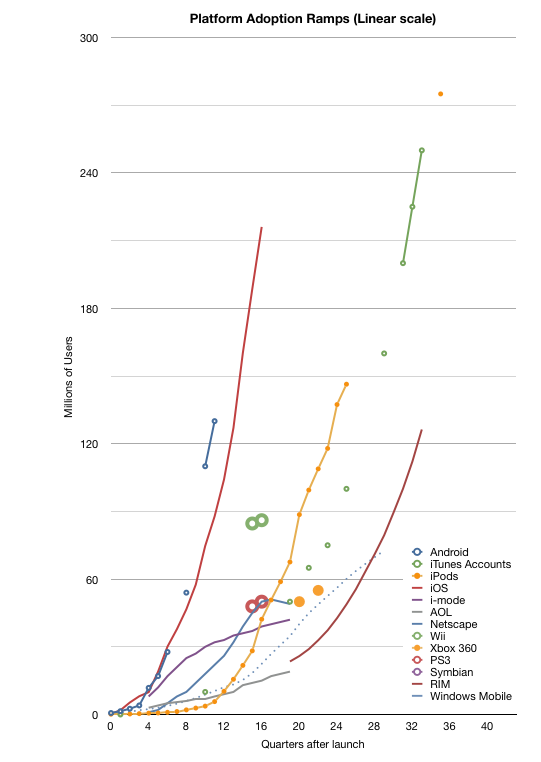
Note again that this is a log scale graph. Every major horizontal gridline is an order of magnitude (10x) larger than the one below. It's a busy graph. The linear version follows:
For the detail-minded, it makes for some interesting comparisons, but I want to create a more compelling visualization. One where each platform can be judged for potential and impact at a glance.
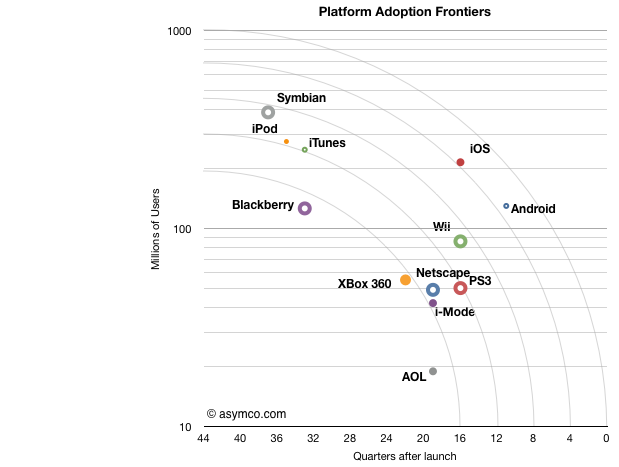
To that end I came up with something I call the platform "adoption frontier" view. Based loosely on the Pareto efficiency concept the chart is reduced to show the latest known figure of (users,time) and overlay concentric arcs centered on 10 million/10 years and radii of unit years (x-axis).
Note that the time axis is reversed from the chart above. This was to allow the best performers to be shown at the upper-right of the chart.
The way to read this is as follows:
Each platform is represented by a point which shows its currently known peak in users and time to reach that number of users.[1]
The arcs (frontiers) represent possible performance classes.
The lowest frontier spans "four years to reach 10 million" to "10 years to reach 200 million". The highest frontier spans "<1 year to reach 10 million users" to "10 years to reach 1 billion users". Each frontier can be read in a similar way.
The main assumption is that a platform can reach more users but it takes time. Better performance is when a platform moves toward a frontier further from the origin.[2]
I chose the limits of the chart specifically: 10 years is roughly the limit of most platforms[3] in the current cycle time of technology disruption; One billion users is an upper bound set by Windows.
One thing you can read from the chart is to say that "from a growth point of view, Blackberry is weaker than any of the other platforms." Sitting below the lowest frontier with fewer users than Android which has been in the market for less than a third of the time it seems to be less impressive. It is, however, in a similar band of growth as Xbox 360, which, by some measures, is a success story. So the performance standard is relative.
One can also see the rough equivalence in growth between iPod and Symbian, both having crossed the second frontier. But iOS and Android are in a different league. They sit alone beyond the fourth frontier. The fifth frontier is the "billion user in a decade" potential and it seems within reach for both.
What this view also offers is an answer to the question of competitiveness. Although platforms can co-exist and don't necessarily overlap, the question of becoming overwhelmed with "good enough" by widespread low end alternatives looms for the specialized platforms. For example, game consoles look very vulnerable because they simply do not have the potential to cross high frontiers and orders of magnitude of casual gamers (with potential TV connected devices) might orphan the consoles.
I've also included some platforms that have peaked and faded (AOL and i-Mode and Netscape) as a warning. The frontiers illustrate of how hard it is to reach the upper limits of growth. Each level is exponentially more difficult than the last and achieving it with paying customers is a remarkable story of value creation.
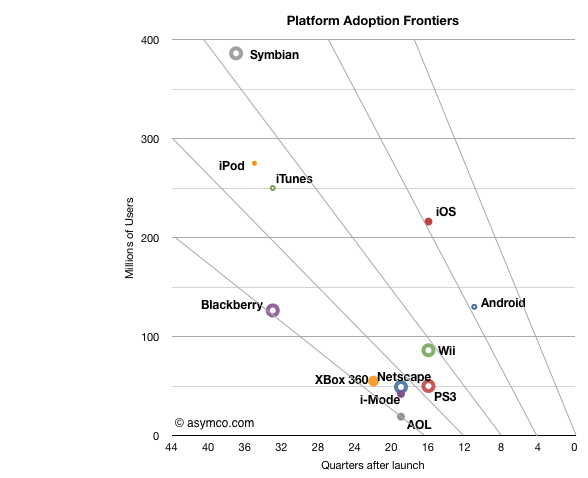
[UPDATE]
I add below the frontier chart with a linear vertical axis. Note that the frontier lines are not equivalent to the frontier arcs in terms of coverage.
---
Note:
The data I have is for platforms where users have to pay something to participate. I exclude platforms where users are the only merchandise being sold (i.e. social networks or email provision).
I only include the initial ramps not upgrades. Windows is anomalous because it is so old. During its first decade (1985 to 1995) it reached over 17 million users but placing it on this chart does not do it justice given the growth occurred in its second decade.
See Symbian and Windows Mobile. However again, Windows which is nearly 30 years old, is an exception.