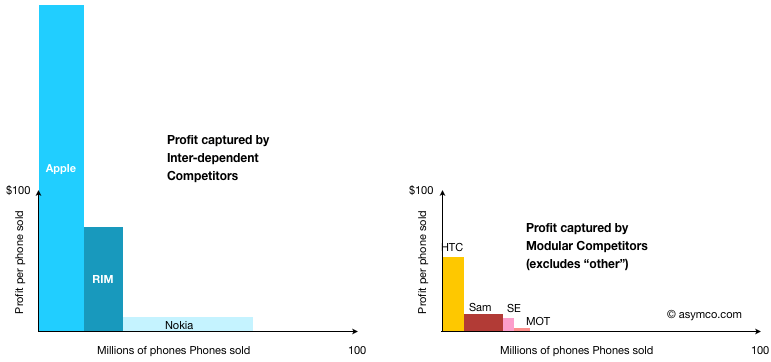
Following-up on the profitability discussion for the top eight vendors, I built a chart to show estimated profit capture from smartphones, further dividing the vendors into inter-dependent (own OS) and modular (licensed OS)[1].
The areas shown represent total profits by vendor and architecture. The totals:
Inter-dependent: $3.83 billion
Modular: $0.59 billion
Most of the modular profits came from selling Android devices.
[1] Samsung and Nokia profits from Smartphones are not directly available and are estimated.
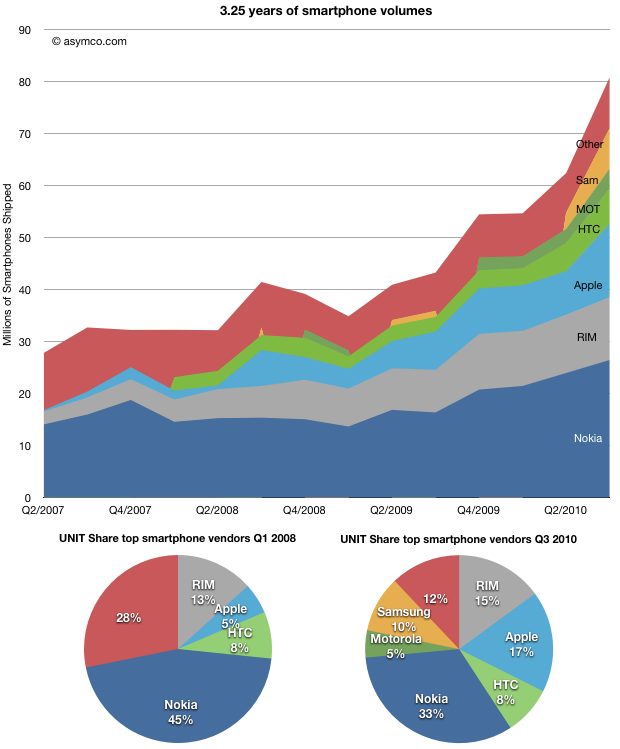
If we look at the growth of smartphones independently from all phones, the category looks impressive:
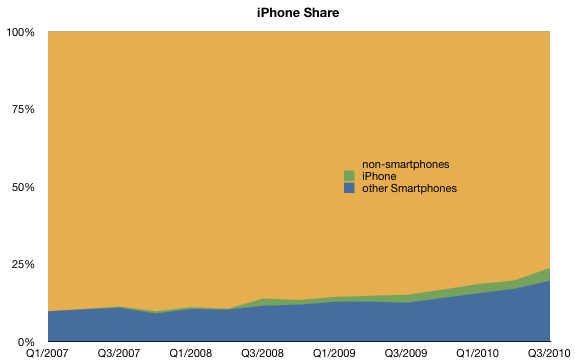
Smartphones are now almost 24% of all phones, up from 10% three years ago.
What's also impressive is all participants in the market grew their volumes. The rising tide did lift all the boats.
For this reason it's somewhat perplexing to hear absolute statements about the imminent death of certain smartphone competitors. The non-smartphone market is still 76% of the total phone market. And it's the biggest and easiest target for all smartphone competitors. The data shows that, for the time being, calling the end for vendors or platforms in a market that's doubling every three years is premature.
But what I really want direct attention to here is a subset of the market: modular platforms.
If you recall from the modular vs. inter-dependent dichotomy discussion, modular architectures are a way to implement products by licensing core components rather than keeping an integrated development model. I stated that modularity tends to be the better approach when markets are mature/over-serving and inter-dependency is the better approach when markets are young and the products not-good-enough.
Looking at the chart above you should note that the market is growing extremely quickly so it's not "mature" in that sense, implying a healthy future for inter-dependent players.
So how are modular vendors faring at this stage of the market and what are the prospects of module suppliers (i.e. mobile operating systems).
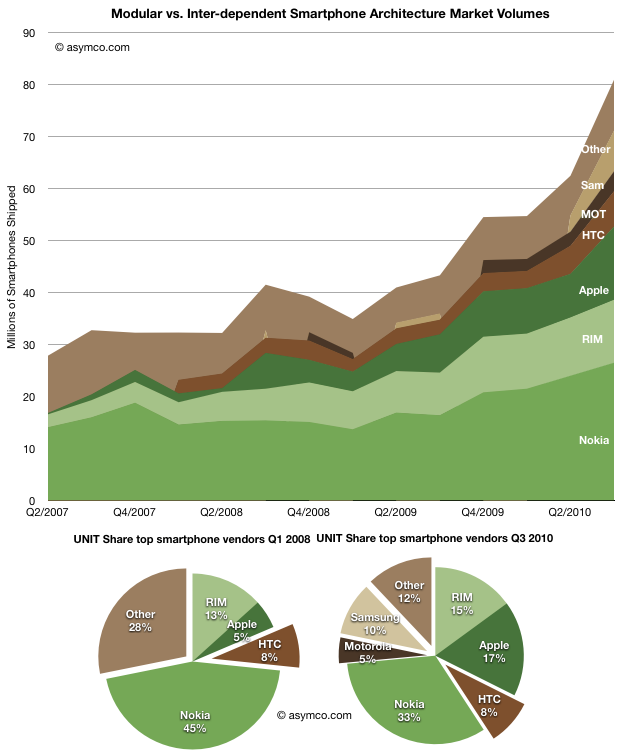
To help clarify, rather than looking at vendors individually I grouped them by architecture. I took the charts above and changed the colors so that modular vendors (in shades of brown) are represented separately from inter-dependent vendors (in shades of green).
When looking at the market this way we can make some important observations:
Even though the overall market grew, the share of the market held by modular architectures is smaller than that for inter-dependent. It's also not increasing. In 2008 modular players held 36%, in late 2010, they held 35%.
The suppliers to the modular market changed over the same period, so to a large extent they are fungible. During 2007, the vast bulk of the brown area above was using Windows Mobile. The vast bulk in 2010 is using Android.
The addressable market for Android is constrained to the modular market. Therefore the growth potential depends on whether that brown area increases dramatically relative to the green.
Vendors don't change architecture easily. My knowledge of the competitors makes me believe that none of the green players will change from Inter-dependent to modular, and even if they wanted to change it's not a simple thing to do. Conversely, changing from modular to inter-dependent is enormously challenging. Company processes, competencies and priorities must change dramatically.
So what's the bottom line?
For an Android dominant future, several conditions must be met; one will need to believe all of these to be true:
The addressable market for modular solutions will have to grow much faster than that of inter-dependent vendors. [The chart shows in-line growth--again due to the overall growth of the market. The green guys above won't just roll over.]
The split of licenses between Android and Windows Phone within the addressable market must favor Android. [Again, this is unlikely as "politics" will interfere. (I won't even touch IP issues.)]
The current modular vendors will not become inter-dependent or the current inter-dependent vendors will become modular. [Now why would they tear themselves apart if they are growing?]
The profitability of Android vendors must be high enough to make modularity sustainable [more about this later.]
Talk of Android (or iOS) "domination" is still wishful thinking. With the acceptance of Windows Phone within the value chain (device vendors, operators, developers), the brown area above will be served by two very powerful and motivated competitors. Politics and lawsuits will add drag on growth. Established brands are important to consumers and new brands (like ZTE and Huawei) will have a hard time joining the top tiers with or without Android. Established integrated vendors like Nokia, RIM and Apple don't have modular DNA but do have massive distribution.
In the end, the real limitation is that the brown area itself is not going to get disproportionately large. Android is limited by its addressable market and that market is a lot smaller than the whole market.
Looking at the world through modular/inter-dependent lenses lets you see that mobile platform dynamics will not evolve as they did in the PC era. At least not for the foreseeable future.
[Wedge Partners analyst Brian Blair] also contends that Apple’s production forecasts suggest the company thinks it can sell 100 million iPhones next year. “While a staggering number any way you look at it, our checks reflect full calendar 2010 builds in the 48-50 million unit range,” he writes. “While this number can change and adjust downward or upward based on demand, we believe it is incredibly bullish that Apple feels it is possible that they could see nearly 100% year over year growth for iPhone in 2011 as this would mean that exiting 2011, Apple would have approximately 10% share in the global handset market.”
Apple is, in my estimate, likely to sell at least 47 million iPhones in calendar 2010. (16 million in the current quarter, or 85% y/y growth).
The 100 million in 2011 estimate assumes 100% growth on average. Is it really "staggering" to forecast another year of triple digit growth?
The history of growth is one indicator. There the news is good: the product has been able to sustain that level of growth for three years.
The second indicator is room to grow. Apple largest competitor is smartphone non-consumption. This competitor holds 76% share, but is rapidly losing share. Consider the the following chart:
I've heard the mantra that smartphones are not for everybody and that the vast bulk of consumers will opt for voice-oriented phones indefinitely, especially in low-GPD/capita countries.
To this I point out that there are no technical obstacles to implementing smartphone technology in all price points nor that there are any constraints on distribution, network technology rollouts or shortage of capacity to produce these products for all current mobile users (5 billion at last count). I also believe that user demand for this level of product utility will shift rather more quickly than supply.
So, in my mind, the headroom looks pretty good as well.
Lastly there is the question of alternative platforms. I'll get to that shortly.
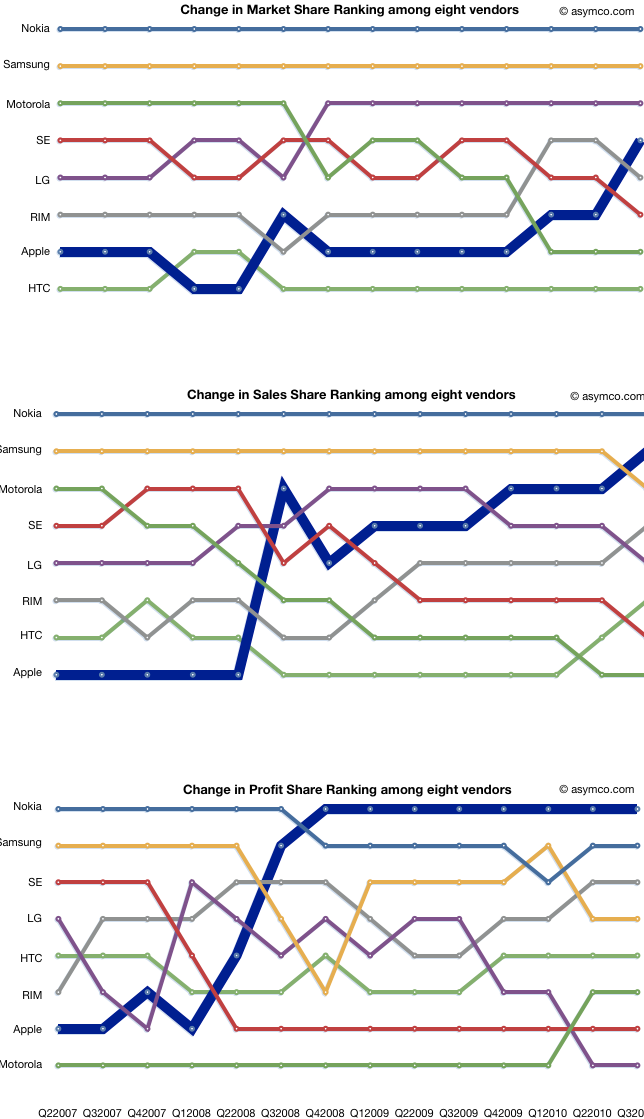
In previous posts I detailed shares for units, sales and profits. I also offered different ways to look at the data like rankings and profit "area" maps.
This article is about the absolute numbers. What is the total market in terms of units sold, sales and operating profits.
The time frame remains from the second quarter in 2007 to the third quarter of 2010. The same eight vendors are analyzed (with "Other" available for units analysis only).
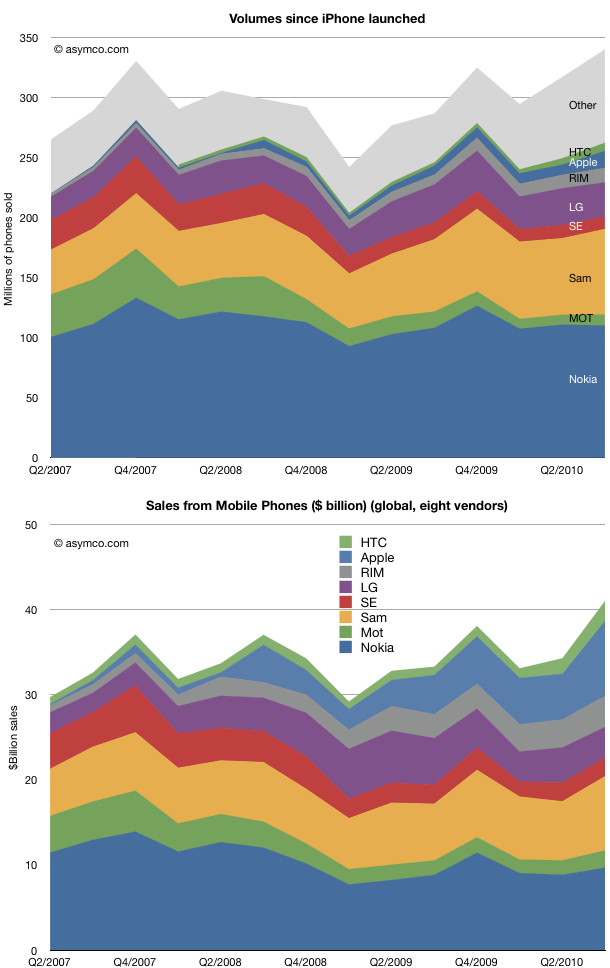
The first observation is that the market grew to new heights in Q3. 340 million phones in the quarter means that we might be looking at a very good holiday season. The market was range-bound due to the recession and its over-hang, but there seems to be a good indicator of macro-level recovery
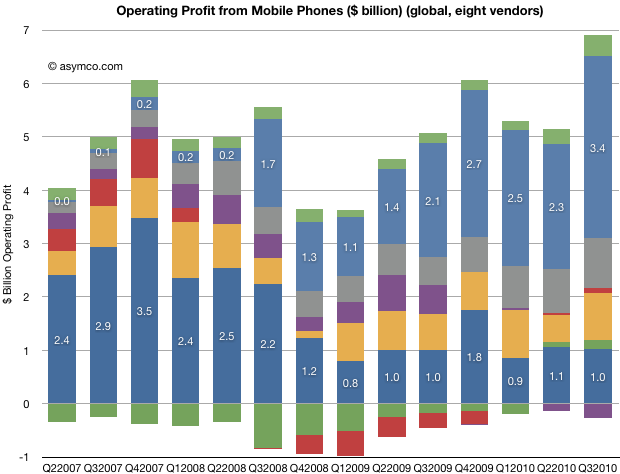
On an individual competitor basis, the share snapshot pictures we saw earlier gave a good summary of the condition of competitors. Here we see the evolution of absolute units and sales over time. It's instructive to scan the two charts as a pair to see how units and sales are affecting the positions of the participants.
I clustered the "pure smartphone" vendors at the top of the charts so you can visually separate them from the broader portfolios of the others.
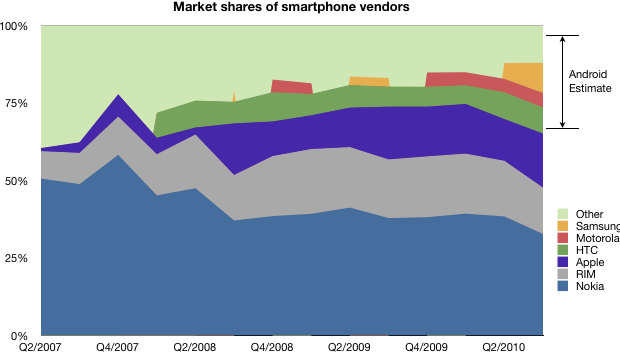
Finally, here is the evolution of total profitability (operating) for the participants. I annotated Nokia and Apple for calibration.
(note the color coding legend in the pervious charts).
What is most impressive is how LG, Motorola and Sony Ericsson seem to be in the same boat. At the same time, Apple, RIM and HTC are outstanding in performance. And Nokia and Samsung are stuck in a dilemma. On the other hand, every vendor is different in many ways, and it's inaccurate to paint them with the same brush.
Overall, we see a pattern of increased absolute value in the market. All but one vendor is profitable, and sales are increasing. A large part of the growth is due to the transition of the market to smartphones.
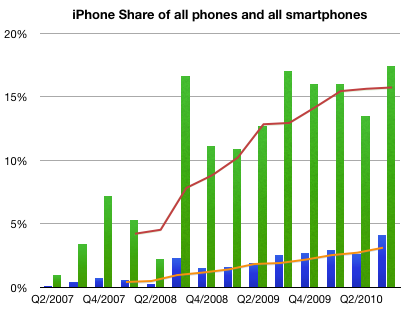
Take a look at this chart. It combines the known shipment data with the total market size for smartphones as defined by Canalys.
Knowing the platform/vendor make-up we can estimate the percent of the market that was Android.
Note that the major unknown is still how much the platform hedgers (Samsung, Other) split their volumes between Android and Windows Mobile (yes, it's still being sold).
Given this information, I would estimate Android share was around 30% globally. Canalys estimates 25%, which makes this analysis look reasonable.
On a platform basis, Android gains were mostly at the expense of RIM, Symbian and Windows Mobile as we know that the iPhone share remained steady.
Note that in years past the licensing vendors predominantly opted for Windows Mobile, a market that Microsoft wants to regain.
There is some confusion with the latest Canalys teaser press release. The implication is that Apple has lost smartphone platform share due to the Android surge.
Using the published data, it's easy to see that Apple has continued to increase share in both smartphones and handsets as a whole.
I used green bars to represent quarterly share of smartphones and blue bars to represent quarterly share of all phones.
I used orange line to show trailing four quarters (TTM) share in regular phones and red for smartphones.
Here are the Q2 to Q3 changes in share for the vendors whose data is published:
Nokia 38.4% to 32.7%
Motorola 4.32% to 4.7%
Samsung 5.11% to 9.71%
RIM 18% to 15%
Apple 13.5% to 17.4%
HTC 8.65% to 8.41%
Other 12% to 12%
Sequentially, Nokia lost 5.6% of share, Samsung gained 4.6%, RIM lost 3% and Apple gained 4%, Motorola, HTC and Other remained largely unchanged.
In the mobile phone industry, and indeed, in most technology sectors, price decline is a fact of life. Component prices tend to drop while their performance increases. This rapid obsolescence drives prices down constantly. Competition also plays a part as undifferentiated products are rapidly imitated.
This phenomenon has its own term: price erosion. It's built into most business plans and forecasts.
But how real is it? What are the implications in terms of market share if one accelerates price erosion or reverses it?
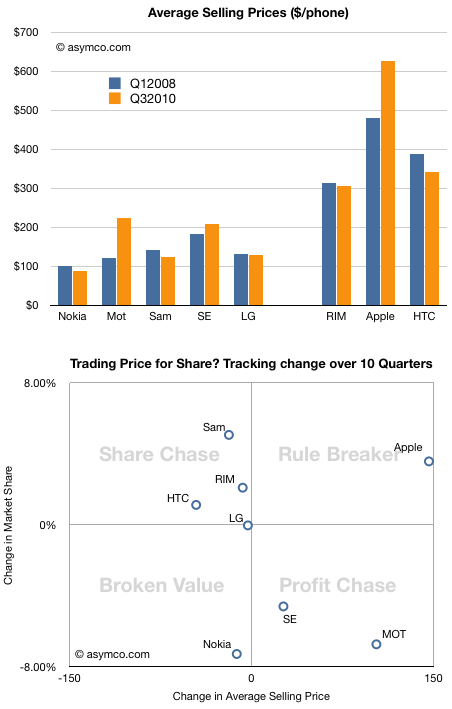
This chart shows the average selling price for all the vendors whose data I maintain over a period of time.
Normally, a drop in price is followed by an increase in share, and an increase in price by a drop in share. To test this hypothesis, I tacked on another chart that shows how share and price have been traded off in the market over the last ten quarters.
Note how prices have dropped for all but three vendors. Two of those vendors (Motorola and Sony Ericsson) have lost share. One, Apple, has gained share. The rest, whose prices did drop, had increases in share, very roughly in proportion to the price drops. Again, we have one exception, Nokia, which suffered both price and share loss.
Except for these two anomalies, the vendors are placed on the -45 degree diagonal that would show expected price elasticity in the market.
I took the liberty of breaking the chart into four quadrants, and gave them names suggesting the strategies of the companies.
Lying along the traditional trade-off axis are either Profit chasing or Share chasing strategies. Anomalies off the axis are either Rule Breakers or Broken Value propositions.
This view of the companies allows us to abstract and think about market evolution.
It would be interesting to think how these players will evolve over time.
It's quite possible that LG will move into the profit chasing model (as they already indicated they would by building more smartphones). These strategies are typical of companies squeezed from the bottom and the top. I once called this group "the biggest losers" and suggested that they are the best target for Android.
It's also possible that Nokia will move into the same quadrant, though their profit algorithm favors share above all else.
The biggest question is whether Apple's rule breaking is sustainable. It's not clear whether they are interested in share as that does not have all that much to do with their definition of "greatness". But a platform strategy begs for volumes.
This remains the biggest puzzle facing observers of this market.
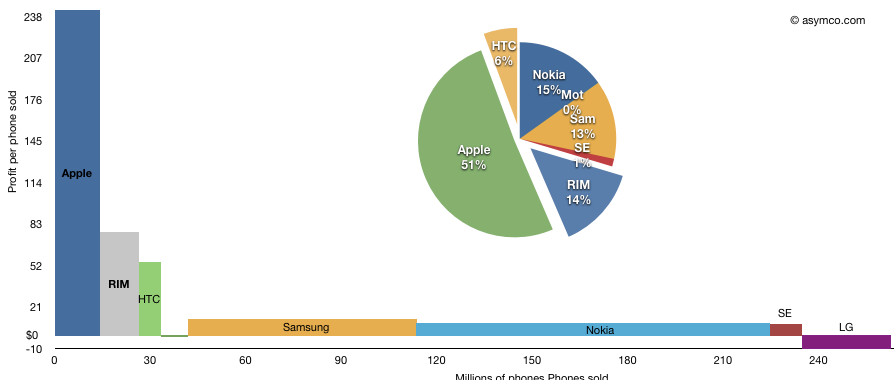
The following chart shows the third quarter's profitability of eight top phone vendors as a measure of phones sold multiplied by profit per phone.
I've added the pie-chart showing the rectangular areas as a percent of available profit in the peer group. Note that LG losses are excluded from the pie chart but included in the area chart.
The total area represents total profit. This representation shows how the largest vendors make relatively little profit per phone but the large unit profit for Apple and RIM gives them a significant share of total industry profits.
Based on a reader query, I tried to find out where, by city, my readership is concentrated. I also sought to break this audience down by operating system.
Here are some observations:
For the last 30 days, here are the top operating systems used to reach Asymco.com, with the number of views from each.
Macintosh 153,768
Windows 101,329
iPhone 78,716
iPad 34,878
Linux 7,262
iPod 5,516
Android 4,869
(not set) 1,236
BlackBerry 447
SymbianOS 396
Looking at each OS, I can list the top cities where readers came from.
Macintosh 153,768
London 6,513
San Francisco 5,316
New York 5,089
Cupertino 4,293
Austin 2,589
Sydney 2,182
Helsinki 2,131
Los Angeles 1,918
Seattle 1,847
Portland 1,482
Windows 101,329
London 3,827
New York 3,275
Helsinki 1,598
San Francisco 1,504
Seoul 1,409
San Jose 1,260
Chennai 1,226
Sydney 1,116
Seattle 1,100
Melbourne 1,035
iPhone 78,716
San Francisco 5,203
New York 4,406
London 4,053
Chicago 2,328
Seattle 1,836
Los Angeles 1,638
Melbourne 1,430
Seoul 1,402
(not set) 1,376
Sydney 1,261
iPad 34,878
London 1,759
New York 1,060
San Francisco 1,020
Chicago 857
Melbourne 739
Outremont 694
Santa Rosa 585
Seattle 555
San Jose 456
Santa Clarita 440
Linux 7,262
San Francisco 376
London 233
Helsinki 180
New York 131
Cambridge 126
Bangalore 109
Nantes 109
Sydney 107
Perchtoldsdorf 93
Paris 86
iPod 5,516
Eau Claire 471
Melbourne 396
Seattle 290
Abuja 248
San Jose 214
Hudson 197
Sydney 195
Budapest 109
Boston 95
London 86
Android 4,869
Seoul 761
(not set) 325
Dallas 248
New York 169
Amsterdam 148
Calcutta 131
San Francisco 81
London 74
Los Angeles 74
Bergen 72
BlackBerry 447
New York 121
(not set) 78
Waterloo 56
London 50
Buenos Aires 16
Hong Kong 9
Oldsmar 9
Fairfield 7
Wappingers Falls 6
Boston 5
Symbian OS 396
Helsinki 216
Kauniainen 23
London 21
Seoul 13
Tehran 10
Frederiksberg 6
(not set) 4
Chennai 4
Krakow 4
San Francisco 4
The first surprise for me is that Seoul is the most popular source for Android views.
The second is that London is so prominent. Although the US is the biggest source of traffic by far, London is a very concentrated source from the UK.
The third is how there seem to be no Blackberry readers in the SF area.