Asymco

Asymmetric Intelligence

Latest from Asymco

  1. Discerning Apple's international product positioning through the big Mac index

    Research · 31 comments

    Thanks to all those who contributed to the big Mac index there is a substantial amount of pricing data available in one location.

    The analysis that I hoped to perform on the data was to see if Apple was pricing specific products differently in international markets. It was prompted by some apparently anomalous pricing of the iPhone 4S in Brazil.

    To summarize, the idea is to calculate the "expected" price of an Apple product by taking the untaxed US price and adding duties and tariffs and taxes to determine what that product "should" cost in another country. Then taking the difference between this "expected" price and the actual price to determine if Apple is using pricing to signal in a particular market.

    The analysis basically eliminates the effect of government on price and leaves currency and actual pricing signals from Apple as variables.

    The analysis is not simple because there are many obscure tax rules. Some products are taxed differently in the same country. I have not completed the country-level analysis but have been able to see some averages over the countries reported (total of 45 reports.)

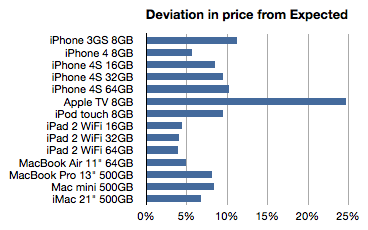
    The following chart shows the average deviation from "Expected" as a percent:
    Here are some potential interpretations of this data:

    • The more a product deviates from expectation (e.g. the Apple TV) the more it's likely to be targeted to the US or potentially has advantages of scale in the US
    • The less of a deviation (nearer to zero, e.g. iPads) the more the international market is interesting to Apple. They are essentially signaling that those products are targeted at wide distribution.

    If we take this train of thought it takes us to these conclusions:

    1. The Apple TV is being "subsidized" in the US. The price is so low there probably because it is benefiting from content sales. This is a compelling argument and it might suggest a strategy for Apple TV closer to that of Amazon's Kindle than to any of the telecom or computing products Apple sells. This may have significant implications in the pricing of any future "TV" product from Apple.
    2. The iPhone 3GS seems to be a US-targeted product. Anecdotal  evidence shows that the product is not particularly strong selling in international markets. Apple is seemingly not trying to stoke demand with discounting.
    3. The iPhone as a brand is not tuned to compete on price globally. Indeed, the iPhone 4S is the most "overpriced" product and seems to be premium priced vs. iPhone 4. The iPod touch is also something of a prima donna when it comes to pricing.
    4. In contrast to the iPhone, the iPad is being positioned through pricing for broad global distribution. This is undoubtedly due to their unlocked nature but there might be some other penetration tactics at play here.
    5. Macs in general are not priced aggressively internationally. However the Air does seem to be positioned for volume growth (while the mini is not.)

    Admittedly, these are quite aggressive conclusions given the limited data. What gives me some confidence in these conclusions is additional circumstantial data. The demand for some products is clearly higher outside the US than others. I believe and this data seems to support the notion that the overall strategy for the iPhone, iPad, Mac and iPod is being tuned for the international markets with some precision.
  2. Subscribe to Asymco One for full access to our research.

  3. The TV store

    Research · 74 comments

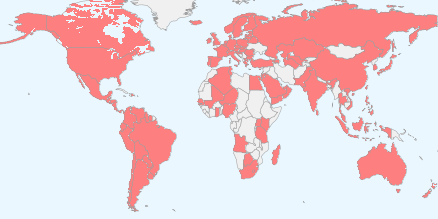
    The following map shows the countries where iTunes Apps are available.

    It represents 123 countries. It also shows where the iPhone is currently available.

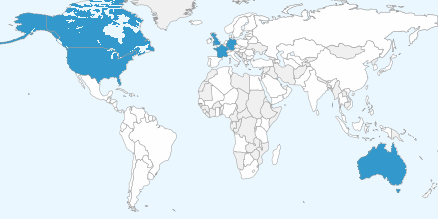
    The following map shows the countries where iTunes music can be purchased.

    The countries in white are countries where apps are available but music isn't. There are 51 countries where you can buy music and 72 where you can buy apps but not music.

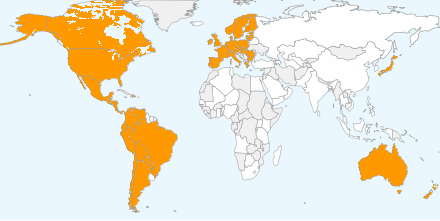
    The following map shows the countries where iTunes TV shows can be purchased.

    As in the previous chart, the countries in white are those where apps are available but TV shows aren't. There are six countries where you can buy TV shows and 117 countries where you can buy apps but not music.

    The data is here (along with a widget which lets you generate the maps--if there are errors, please correct them and let me know).

    Digital music (as iTunes defines it) started expanding outside the United States in 2004 and managed to reach these 50 other countries in seven years. TV shows took a much slower route. Not only has there been a limited selection of countries in six years of expansion but even in the US, the programs available are a tiny subset of what is being produced.

    Is the TV business going to expand digital distribution at the glacial rate of music or not at all? In either case, the distribution of Apps as a digital medium is positively viral.

  4. Subscribe to Asymco One for full access to our research.

  5. 5by5 | The Critical Path #18: Who's Paying for My Lunch?

    Podcast · 15 comments

    Dan and Horace ponder why some companies are more mysterious than others. We ask whether transparency and simplicity of business models is a sign of strength or weakness. We compare the measurement, creation and capture of value and why we should celebrate the mortality of businesses.

    via 5by5 | The Critical Path #18: Who's Paying for My Lunch?.

    Notes:

  6. Subscribe to Asymco One for full access to our podcasts.

  7. Who is being reasonable now?

    Research · 49 comments

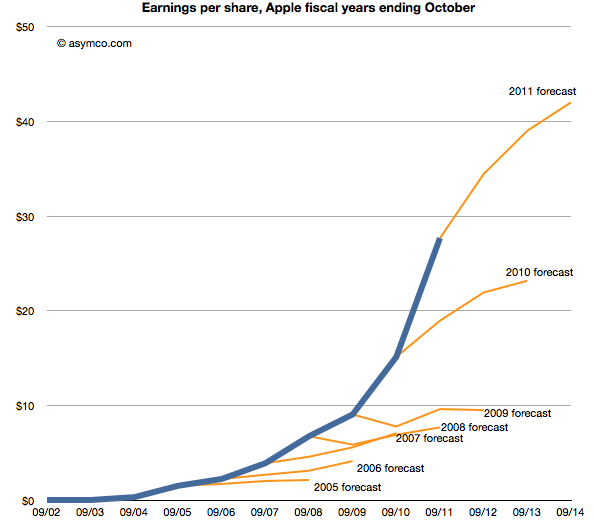
    Last week Horace wrote about the apparent "reasonableness" of analyst Apple estimates. He explained how the consensus for Apple's growth was always deeply pessimistic because its performance could be argued to be anomalous. It was just too good to be true. We reproduce the chart here:

    The estimates look like characteristic "tell-tales" of a company running strong into the wind.

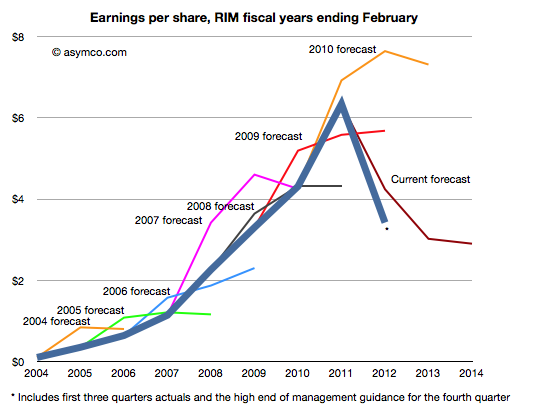
    This conservatism in the face of rapid growth sounds "reasonable" but is it always practiced? And what about the ability of this conservative strategy to predict dramatic changes in growth? To test, we started to look at the predictions for RIM. RIM has also enjoyed strong growth over a similar time frame as Apple. How did analysts predict its performance? The following chart was prepared using the same technique as the one for Apple[1].

    Surprisingly, the "tell-tales" look very different.[2] For every year we looked at the first year estimates were over-optimistic with a decline expected after one or two years. This pattern is remarkably consistent within the RIM data and remarkably inconsistent when compared to Apple.

    It's as if there was nothing in common with the methods used. This is perhaps appropriate, but the "quality" of predictions are not much better. With RIM they were too optimistic in the short term and too pessimistic in the medium term. With Apple they were far too pessimistic consistently.

    More worrisome, the 2010 forecast did not offer any hint of the dramatic decline which followed only a few months later. And after three quarters of really bad news, the consensus is still higher than what will likely happen (ensuring an uninterrupted string "misses").

    The study of these two companies' forecasts is a study in contrasts. We can say that the forecasting is disturbingly consistently inaccurate but we can also say that there seems to have been a bias of pessimism for Apple and optimism for RIM. We can only guess at the cause, but the consistency of bias points to something institutional.

    ---

    Notes:

    1. The three year forecast consensus (sourced from Bloomberg) was sampled one month following the end of each fiscal year. This should offer the analyst enough time digest the year passed and deeply contemplate the future.
    2. If we may stretch the analogy, these are indicative of an imminent stall.


  8. Subscribe to Asymco One for full access to our research.

  9. Subscribe to Asymco One for full access to our podcasts.

  10. How many Android phones have been activated? (Updated)

    Research · 87 comments

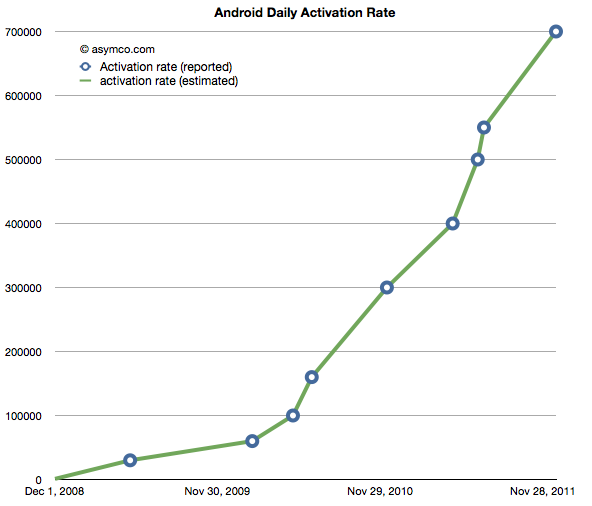
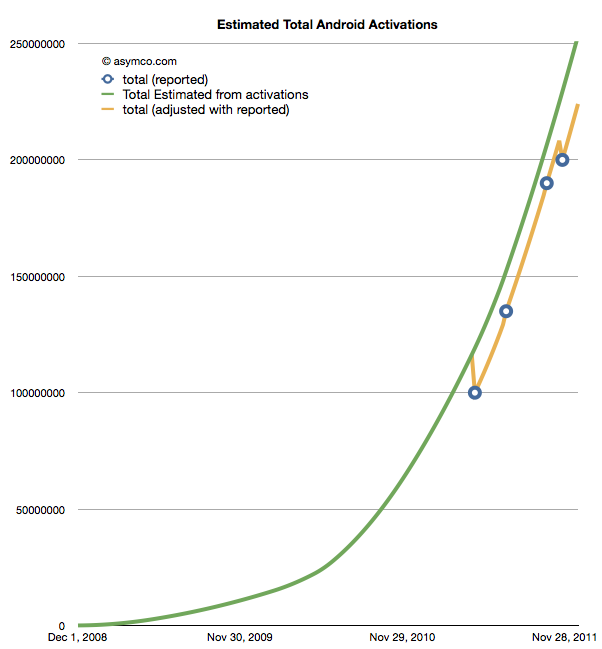
    The following chart shows the reported (circled points) and estimated (lines) for Android activations. The resolution of the sampling is every seven days.

    If we take these estimates and then compile a cumulative total of activations we get the green line in the chart below.

    The wrinkle in the picture is that Google also occasionally reports cumulative estimates of total Android shipped. They are shown as the blue circles in the chart above. There is some room for error as the cumulative totals may not be reported the same day they happen and the assumptions in the activation rates may not be reflecting occasional slowing.

    However that leads to a problem. By adjusting for the reported totals we get the orange line. The trouble with it is that it has these improbable "kinks" where the total is adjusted down, something that is not happening in reality. It's a kludge we need to make estimates fit reality. Normally, this is something we can sweep under the carpet, but with the size of the market, the errors creep up to tens of millions of unitis.

    The first downward adjustment would have been 19 million in May. Today, the difference between the green line and the orange is about 25 million.

    So the best we can say right now is that there have been between 224 and 253 million Android devices activated to date. Why Google does not report this data regularly and consistently remains a mystery.

    Update: The data used in the charts above is available as a Google Docs spreadsheet here.

  11. Subscribe to Asymco One for full access to our research.

  12. The big Mac (and iPad and iPhone) index (Updated)

    Research · 94 comments

    Apple's products are globally consistent. They sell the same exact[1] product in all countries. An unlocked iPhone is the same everywhere. It makes the products "liquid" in that they can be easily bought and sold across borders.

    However, laws do not permit the import and friction-free trading of electronic products. In addition to regulations there are duties levied and there are sales or consumption taxes levied on the purchase.

    However, knowing the retail price of an Apple product in a particular location, and knowing the tax and duties levied, can we work out if the price is consistent?

    Here is an example:

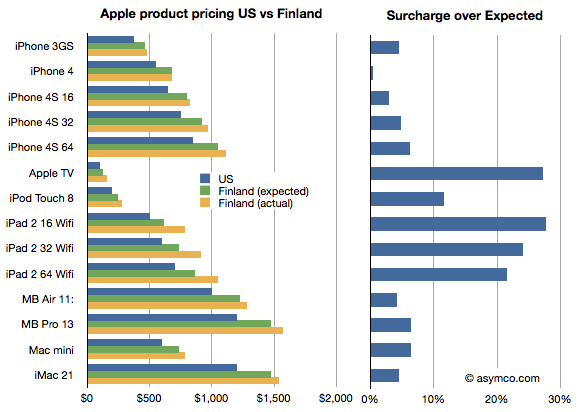
    I illustrated the price of a basket of Apple products in the US online Apple store in blue and the same products in the Finnish online Apple store where the prices were converted to US dollars in yellow. I also calculated what the price in Finland "should" be if the products were sold with the known VAT of 23% added. I called this "Finland (expected)" price and it's shown in green.

    I then took the difference between the "expected" and actual prices as a fraction of the expected and called that the "surcharge". The surcharge can be interpreted as "how much more does a buyer in a different country pay over the price in the US (excluding US sales tax) plus VAT and duties."

    What the chart shows is that not all Apple products are treated equally by Apple. In this particular case Apple TV and the iPad are "overpriced" significantly. Interestingly, the iPhones are nearly what would be "expected" price.

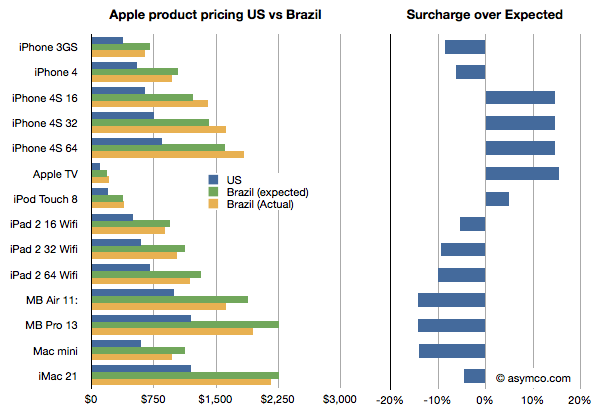
    It gets curiouser when comparing with other countries. In this case I compare the same basket in Brazil.

    Here the story is reversed. The iPads are cheaper than one would expect while the iPhones, especially the 4S, are more expensive, though not by as much as the iPads are in Finland.

    Why is this?

    I don't know. These prices are set by Apple though they may be influenced by operator deals they have locally or other terms. It would require local knowledge of the market to solve this.

    What would also be instructive, I believe, is to collect data from many more countries. If you are living in another country, you can help by providing the following data: For each of the products in this list,

    iPhone 3GS
    iPhone 4
    iPhone 4S 16
    iPhone 4S 32
    iPhone 4S 64
    Apple TV
    iPod Touch 8
    iPad 2 16 Wifi
    iPad 2 32 Wifi
    iPad 2 64 Wifi
    MB Air 11:
    MB Pro 13
    Mac mini
    iMac 21

    provide the retail prices (preferably from an online store) and the local VAT or duty that is expected for electronic products (enter data here.) You can provide the prices in local currency. We can then try to put a global picture together and understand what affects price differences across borders[2][3].

    Update: You can view and enter data in the spreadsheet here.

    Notes:

    1. There are minor differences like power adapters but they are not materially more expensive to produce.
    2. See also The Big Mac index.
    3. Thanks to Paulo Silva for supplying the prices from Brazil and asking the pertinent questions.
  13. Subscribe to Asymco One for full access to our research.

  14. The parable of RIM

    Research · 155 comments

    Here are the highlights from RIM's latest quarter:

    • 14.1 million BlackBerry smartphones shipped, 13 million sold through
    • 150k PlayBook shipped with sell-through slightly higher. 800k PlayBooks shipped so far.
    • BlackBerry subscriber base up to 75 million
    • High growth cited for U.K., France, South Africa, Mexico and Argentina, Indonesia, Saudi Arabia and South Africa. RIM is the #1 smartphone vendor in the Latin America and Caribbean region. Sales outside the US, UK and Canada were 61% of revenues. US is now 20% of sales, UK 11%.
    • Hardware growth outside the US was 56%
    • There are 630 carriers
    • 50k apps in App World with 5 million downloads per day
    • Forecasting 11 to 12 million smartphones next quarter

    Given the channel fill with a new product, the device business was marginal at best. The company obtained -1% growth y/y in units but 31% sequential growth from a transitional quarter. The average selling price (inclusive of service revenues) is $354 and about $280 excluding service revenues. I estimate that operating margins have dropped to about 11%. Not a good story, but one we have been warned to expect.

    But a crucial new twist to the story is that RIM announced that they don't expect new BlackBerry 10 devices until late next year. That came as a surprise and the stock sold off significantly, valuing the company at well below book value.

    Stepping back, the biggest surprise is that the company seems to have had no plan for sustaining itself.

    Let me explain.

    If you go back to 2005 or so the world of smartphones was a mix of modular OSs and integrated platforms, much as it is today.  Not unlike Android today, Windows Mobile was successful in licensing to dozens of vendors who in turn released hundreds of products. Symbian also was licensed but most volumes came from Nokia and they held the lion's share. Then there was the BlackBerry integrated solution which worked smoothly and had devoted fans who upgraded every chance they had and operators who were joyous at the new ARPU. There was also PalmOS as offered by PalmSource trying to be a "third horse" and unseat stodgy old Microsoft.

    It was into that fray that both Apple and Google jumped. Google acquired Android in 2005 and Apple was busy polishing a version of OS X that would became iOS. In three and two years respectively these platforms would be in the market.

    Regardless of the actions of rivals, all competitors must have faced the same questions in 2005: As technology was changing rapidly and as they all had access to component roadmaps, what is the best technology approach to this market? Should they embrace certain innovations to sustain their business trajectory? RIM had a tightly integrated software, hardware and service offering. What could make it better? Nokia was also basing its products on a more loosely integrated offering (nominally it was modular, but only just). It saw the writing on the wall and began developing a Linux variant (Maemo) as a potential candidate to replace Symbian. Microsoft was basing its solution of a modular approach. Windows CE was ok as a kernel but they had layers on top which were optimized around stylus-based user experiences (analogous to mouse actions). Could it take on a rich computing experience?

    There were many experience candidates. Stylus, keypad, keyboard all had adherents. There was a lot of hesitation. After the iPhone launched with capacitive (finger) touch, resetting user expectations, it still took a year for many of the vendors to re-consider their technology plans. The weakest changed first.

    Microsoft felt the pain quickest. They also had the least to lose since revenues from Windows Mobile were paltry. By 2008 internally they turned 90 degrees. They embarked on re-building their user experience and orphaning the Windows Mobile ecosystem and many of the vendor relationships they had built. Palm dropped PalmOS and built WebOS internally quite quickly. They licensed Windows Mobile as a stop-gap. Around the same time Nokia doubled down on Maemo and joined with Intel to form MeeGo. They did not orphan Symbian though and kept trying to adapt it to the new experiences and input methods.

    But RIM did nothing. Almost nothing. They were the healthiest competitor. They felt no pain from iPhone's entry. The platform they had built was still growing and they were tweaking it constantly. There were always improvements to point to but fundamentally the code was limited. It was very difficult to adapt it to touch input and the first attempts at a touch UI were embarrassing. But there were no signs of a new platform that reflected the Unix-like competition.

    As I pointed out in an earlier post, Unix-like operating systems were having their revenge. To a computer scientist the future of mobile computing would mirror that of personal computing in terms of architecture. The foundations of the early smartphones were built on constraints that were disappearing while being unable to accommodate new input methods. In other words, the early efforts were optimized around those constraints and sub-optimal for rich user experiences. They had to be. There were limited processors, memories and screens and battery life.

    It turned out that all the early mobile operating systems were unsuitable for the advances in technology that came after 2007. Companies which were able to adapt or embrace Unix-like operating systems in a mobile context gained the ability to grow with the new input methods. The sooner they "pulled the trigger" on the shift, the better off they were. This is in fact what enabled entrants to gain footholds. Entrants entered with Unix-like OSs straight away while incumbents had to justify changing and the more successful they were the harder it was to justify changing.

    RIM had trouble justifying this change. It waited until 2010 to finally acquire the QNX asset that would offer them a stronger software foundation.  It still had to adapt this acquisition and it looks like it won't be done until at least 2012, seven years after they should have started. And this should be seen as a sustaining technological change. A new OS is not a disruptive technology to what is already a mobile computer.

    However, delays like these can be fatal. We see the impact on Microsoft who was earliest to push the reset button in 2008. It still took two years to rebuild Windows Mobile into Windows Phone and is now still struggling to regain lost share (less than 2% today). We see the impact on Nokia which was unable to affect a transition to MeeGo due to a litany of issues and had to throw in the towel on self-determination. We see the impact on Palm which lost its independence as WebOS was a bit too little too late.

    These companies had the right technical strategies but suffered from execution and business architecture issues. RIM is years late in embracing what appears to be a sustaining improvement.

    But whenever you see what appears to be a coordinated effort by companies to fail simultaneously you have to ask if the change they struggle with is really sustaining or disruptive. The pattern makes me suspicious that what RIM, Microsoft, Palm and Nokia faced was more than a failure to embrace a sustaining improvement. I suspect that the failure is evidence of tectonic shifting of business models.

  15. Subscribe to Asymco One for full access to our research.

  16. On being reasonable

    Research · 144 comments

    The discussion on why Apple is cheap was very useful. The debate brought into focus the possible causes for pessimism in the face of overwhelming evidence to the contrary. But maybe there is yet another explanation. The way the data was presented was as a difference between historic and projected growth rates. Is this the way analysts actually think?

    Perhaps they don't project growth based on historic growth, but project earnings given historic earnings. In other words they don't look at the first derivative (change in earnings) but the  shape of the actual data.

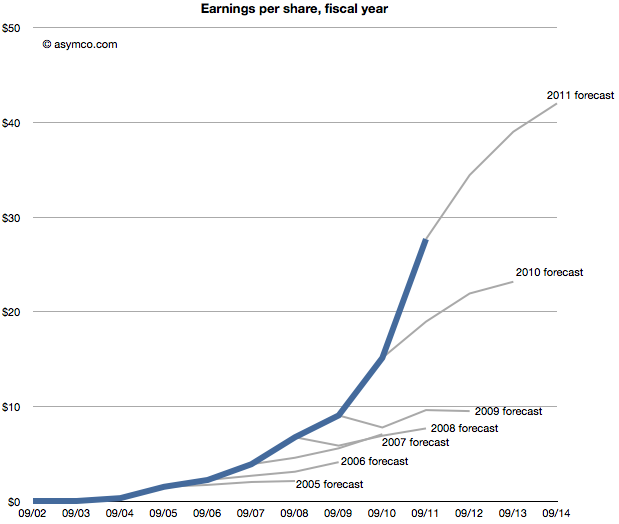
    The following chart shows that data, i.e. forecasts as an extension of a sales trajectory. The blue area are actuals and the grey branches show projections at a given end of fiscal year.

    Seen this way, we can imagine how the projections can be considered "reasonable". Some appear to be linear extrapolations while others show up as the end of "S-curves".[2]

    What none of them imply is  exponential growth. But would forecasting exponential growth be considered reasonable? Clearly not since it's never been consensus. But disruptive companies do follow non-linear growth. In fact, every company that has gone from being small to being big (which is to say all large companies) went through non-linear growth phases. The "natural" shape of growth is exponential.

    The failure is therefore not of reason but of failing to use a model that assumes acceleration of sales. I believe that institutional financial advisors are conditioned (or coerced) into assuming that nothing unreasonable ever happens. That seems like a completely flawed foundation to stand on.

    ---

    Notes:

    1. This post is inspired by the New York Times chart showing budget forecasts.
    2. The same data shown on a log scale: 
  17. Subscribe to Asymco One for full access to our research.

  18. Why Apple is cheap

    Research · 186 comments

    Imagine it's late 2005. Apple's fiscal year just ended and they reported their performance. You're an analyst whose job includes forecasting the company's performance for next year. This is a weighty responsibility.  Your forecast will be blended with those of your peers and used as a "consensus" average. That consensus for the next year will be used to measure the current value of the shares in a ratio called the forward PEG or Price/Earnings/annual earnings Growth. You are supplying the earnings and hence growth forecast while the market offers a price.  As a stock is meant to measure future earnings, your forecast is a crucial and frequently cited figure about whether a stock is priced fairly.

    There is some comfort in knowing that there will be many others who will offer such a forecast and your contribution is thus not the only way investors can calibrate the price. However, you should think hard about what you are predicting as it also will reflect your skill in predicting such a visible company.

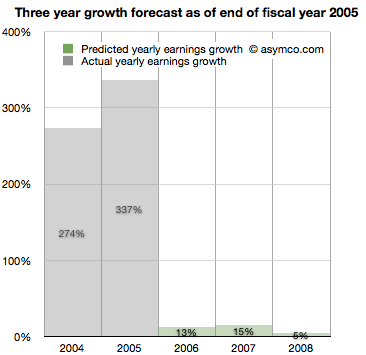
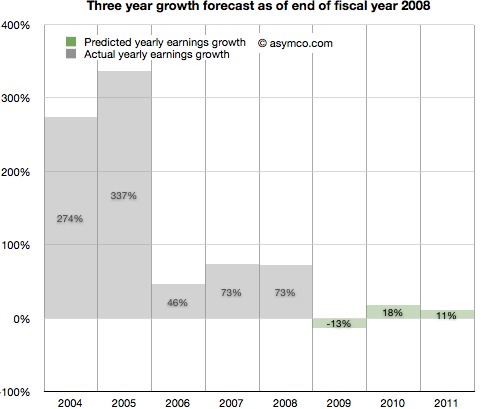
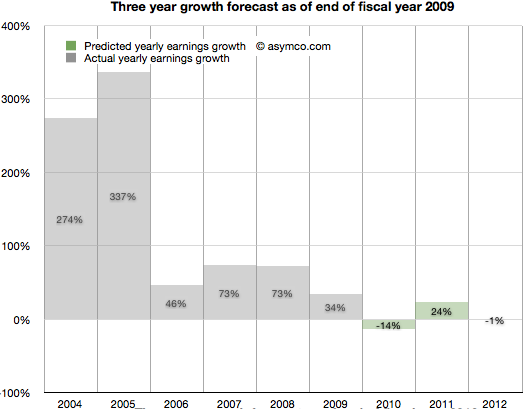
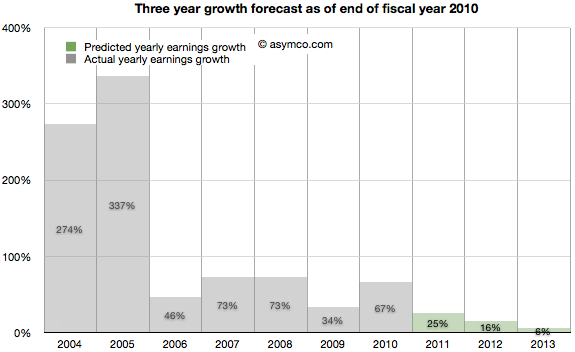
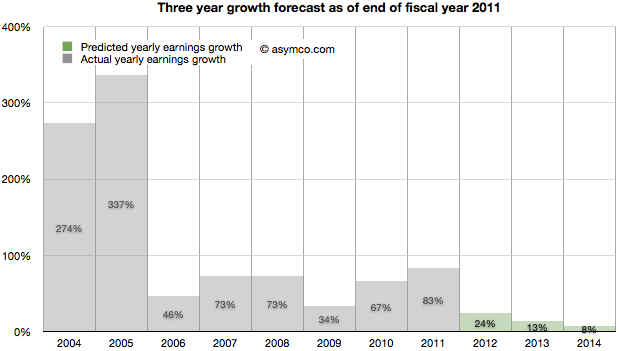
    Apple just had a tremendous two years. 2004 and 2005 saw EPS grow at 274% and 337%. This is largely due to the runaway hit iPod. Given all that is known about the company, what will you put forward? While you're at it can you also forecast two years forward, namely provide a growth forecast for 2006, 2007 and 2008?

    Here is what you and your cohorts publish as a consensus:

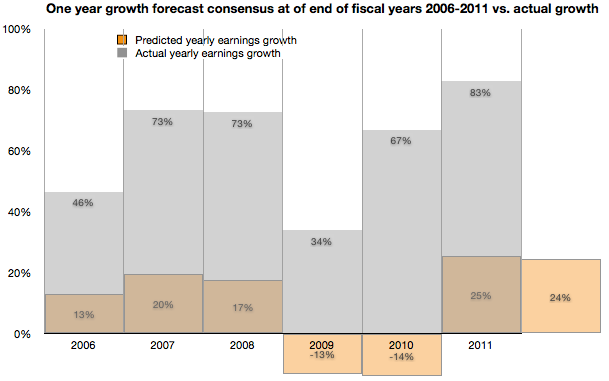
    You go with a 13% growth for 2006,  15% for 2007 and 5% for 2008. The chances are, you reason, that the iPod will not carry the company's growth much longer. The competition is sprouting all over and Microsoft is rumored to be launching its own music player.

    It makes sense to be conservative and offer a modest growth of 13%. At the same time you can rate the stock a buy as it is still growing. The stock just doubled in the last 12 months and the law of large numbers says that growth cannot last at the same rate as we've just seen.


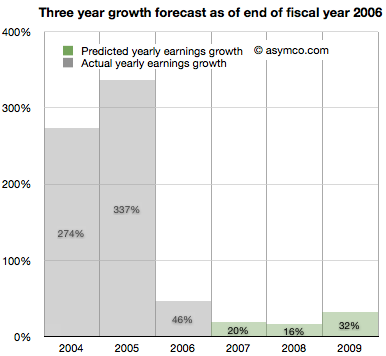
    It's now late 2006. Apple just closed out another big year. Contrary to your forecast last year, the company grew at a rate of 46%, more than three times faster than you expected.

    It turns out the iPod still has some legs and the company's Mac business seems to be growing. Looking forward you take your 15% growth for 2007 and increase it to 20% and suggest 16% for 2008 and 32% for 2009.

    There are rumors of Apple getting into the phone business.


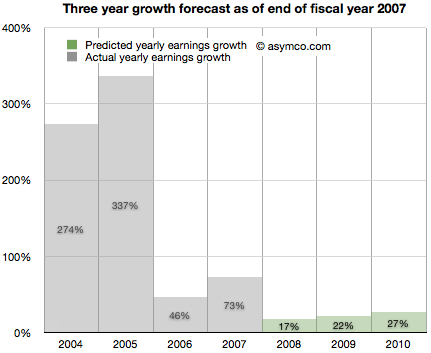
    It's now late 2007. Apple just launched the iPhone and even though it was available in limited numbers on one carrier for one full quarter, the company still turned in an amazing 73%. Again more than three times faster growth than you forecast. What do you do about 2008?

    It might make sense to increase the previous 16% estimate to 17% but since there is a real estate bubble brewing, the 32% growth for 2009 should come down to 22% and defer that growth out to 2010, dialing in 27%.

    It's now late 2008. Apple closed out another huge year. 73% growth was once again more than triple your forecast of 17% growth. It's clear that the iPhone is a huge hit.

    However, there is a credit crunch and talk of a huge recession, even depression looming. Apple is a luxury/premium brand and it is unlikely that those expensive products will sell well into these "macro headwinds". You predict a decline in the earnings of 13% in 2009, inline with many other tech stocks. You are optimistic however that 2010 will be a year of recovery and predict 18% increase from recession lows followed by a more reasonable 11% growth in 2011.

    It's now late 2009. To everyone's surprise, Apple grew through the credit crisis. It turned in 34% growth (vs. your predicted 13% decline). The success is hard to believe but the iPhone had a lot to do with that. There are new competitors coming and the recession has proven resilient. With unemployment still high you predict 2010 will still be a tough year. You go with -14% growth for 2010 and postpone recovery out to 2011 with 24% "bounce". Longer term you see 2012 as a flat year, with Apple earnings shrinking slightly by 1%.

    2010 ends with Apple achieving 67% growth. Shocking relative to a -14% growth forecast. But then again, Apple launched the iPad and who could have thought that was a hit? Apple achieved growth throughout the recession and it looks like it might keep going. Your 2011 forecast of 24% looks weak so you increase it to 25%. The 2012 decline thesis is abandoned in favor of 16% growth and, given the likely competition in smartphones, you tone down growth in 2013 to 6%.

    It's November 2011. The company turned in 83% growth. It's  more than three times faster than your forecast. Some people are suggesting that Apple may have a lot of headroom with the iPhone and iPad but the law of large numbers is what it is. The company became the largest by market cap in the world and Android is gaining huge market share. However, in deference to their strong recent performance you increase the 2012 forecast from 16% growth to 24% growth. 2013 goes from 6% to more than double: 13% and 2014 is when growth begins to slacken, though still a healthy 8%.

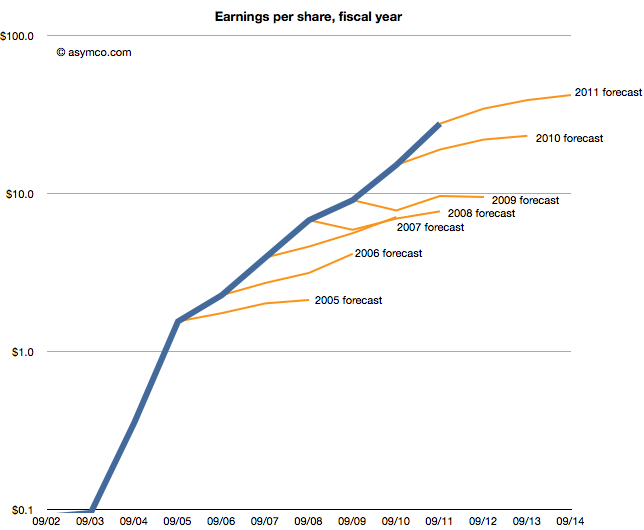
    As the following chart shows, look ahead one year accuracy has not been all that great, but you are at least consistent. In any case, everything you based your decisions on showed remarkable consistency with consensus. You're just reflecting common sense.

    Note:

    • Though the numbers are all real, the narrative is fictitious. I suspect however that the truth is actually stranger than this fiction.
  19. Subscribe to Asymco One for full access to our research.