Asymco

Asymmetric Intelligence

Latest from Asymco

  1. iTunes now costs $1.3 billion/yr to run

    Research · 83 comments

    The iTunes store continues to grow. The data that Apple published in the last event included the following:

    • 15 Billion iTunes song downloads
    • 130 million book downloads
    • 14 billion app downloads
    • $2.5 billion paid to developers
    • 225 million accounts
    • 425k apps
    • 90k iPad apps
    • 100k game and entertainment titles
    • 50 million game center accounts

    As this data is added to the existing data and cross-referenced additional insight into the economics of iTunes is emerging.

    Since we know something about the average price of songs and apps, and we know the split between developers and Apple (and roughly between music labels and Apple) we can get a rough estimate of the amount Apple retains to run its store.

    The following chart shows iTunes "content margin" by month. This margin is what Apple "keeps" after paying content owners but before paying for other costs like payment processing and delivery/fulfillment which should be accounted as variable costs. Strictly speaking this margin is not "gross margin".
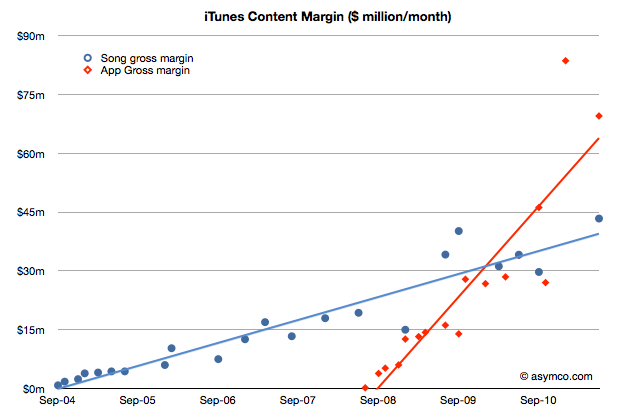
    If we add the content margins from music and apps and assume the store runs at break even we can get an idea of what it costs to operate the store.  The latest number is $113 million per month (from a total income of $313 million/mo.). It implies over $1.3 billion per year.
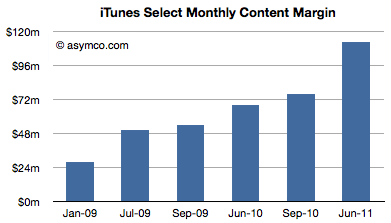
    Much of that cost does go into serving the content (traffic and payment processing). Some of it goes to curation and support. But it's very likely that there is much left over to be invested in capacity increases.

    I would like to hear alternative opinions, but my guess is that much of the capex that went into the new data centers Apple built came from the iTunes operating margin.
  2. Subscribe to Asymco One for full access to our research.

  3. Getting to one billion iTunes accounts

    Research · 37 comments

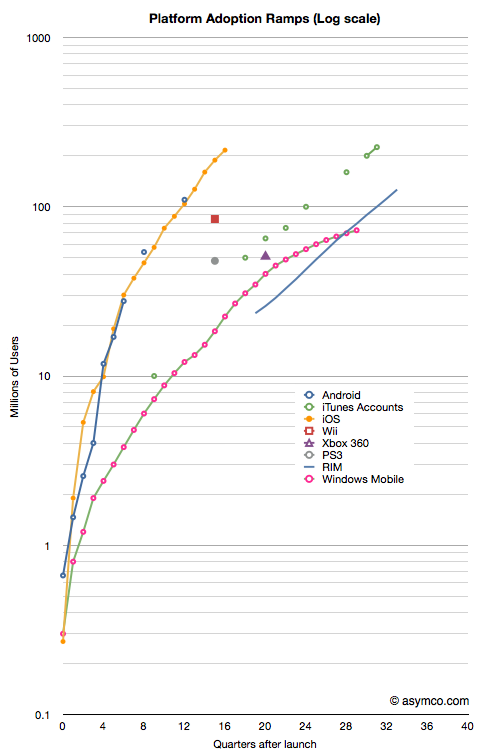
    There are 225 million iTunes account holders. 25 million joined in the three months. As the iTunes store has been operating since April 2003 it's possible to step back and look at its history and measure the rate of growth relative to other ecosystems.

    The following chart shows various platforms/ecosystems in terms of adoption. In the case of phone operating systems and consoles, the cumulative units sold is shown. The scale is 10 years by 1 billion users with users measured on a logarithmic scale.

    What can be easily observed is that iTunes continues to grow on a logarithmic scale even at its advanced age of 7 years. This cannot be said for console-based gaming systems or for some alternative mobile phone platforms (e.g. Windows Mobile or Symbian).

    The reason for this prosperity at an advanced age may be due to the fact that iTunes has survived the transition from one device (the iPod) to a device platform (iOS). It also was able to embrace multiple media from music, to movies to TV and apps. iTunes turned out to be far more flexible and resilient given what was technologically foreseeable at its birth.

    Looking to the future, is it possible that iTunes could grow in parallel with iOS toward the 1 billion user limit that the slope in the chart implies? Much will depend on gaining users who are unlikely to have credit cards and live in emerging markets. If there is one obstacle to the iEmpire it's the addressability of markets which lack consumer credit infrastructure. I suspect, however, that these problems are not unsurmountable given that telecom infrastructure leapfrogged credit infrastructure growth with nary a ripple. Apple could certainly offer that service directly to the consumer.

  4. Subscribe to Asymco One for full access to our research.

  5. Android developers are more prolific but less persistent than iOS developers

    Research · 29 comments

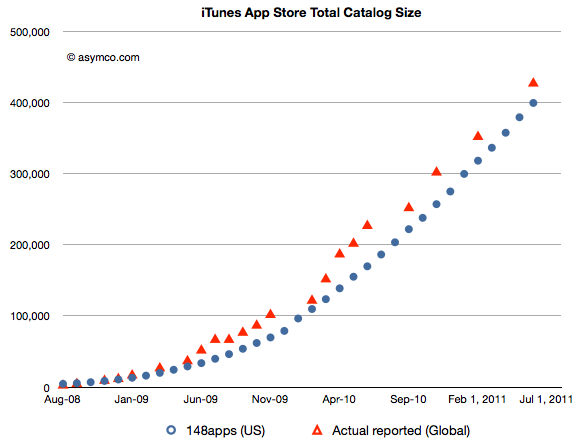
    According to 148apps.biz, the App Store has seen over half a million apps since inception. The number of available apps, according to Apple, is now 425k. (148apps claims 402k apps available in the US store.) The history of the App store catalog is shown in the following chart (showing both US and World-wide measures).

    In an interesting new post by Appsfire, APPtrition - or why app store size does not matter that much... Ouriel Ohayon makes a good point: available is very different than accepted. When comparing catalogs it's important to distinguish between these measures. Apps are published and then unpublished for various reasons. He calls this app attrition and details the reasons it might happen.

    What makes this interesting is the contrast between attrition rates on Android's Market and those on Apple's App Store. About 80k (or 16%) of Apple's catalog has been removed while nearly a third of Android apps have disappeared from the catalog. (By another measure, the submission total is tracked here and shows nearly 375k apps while Ouriel points out that there are 206k available. An apparent attrition rate of 45%.)

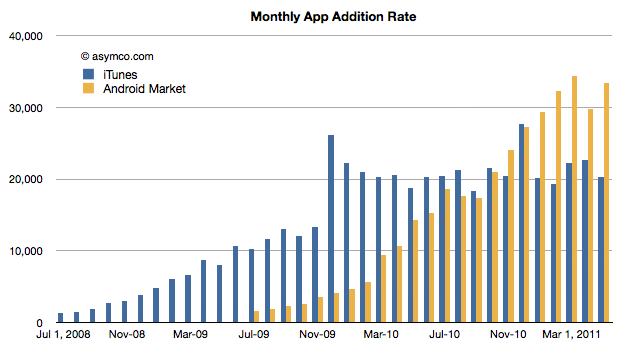
    We can compare how the two marketplaces are adding apps here:

    (The iTunes data is US only)

    This data would indicate that the iTunes App Store has plateaued at about 20k apps per month while Android is still growing and adding at about 30k per month. The challenge for an observer is to reconcile the growth in Android submissions with the apparently far higher attrition rate.

    In other words, Android developers and producers seem to be more prolific but less persistent.  With few if any constraints on submission it's understandable that there will be more apps thrown into the catalog. But why would they be so rapidly removed remains a mystery. Maybe economics, maybe policing, maybe something else altogether explains this.

  6. Subscribe to Asymco One for full access to our research.

  7. A new show launched today. Critical Path #1: The Five Year Plan - 5by5

    Podcast · 45 comments

    Critical Path #1: The Five Year Plan - 5by5.

    Critical Path is a talk show contemplating the causality of success and failure in mobile computing. Using Apple as a lens to look at both telecom and traditional computing markets, we try understand what it means to be great.

    In this inaugural episode, Horace Dediu and Dan Benjamin try to weigh the strategic implications of Apple’s WWDC announcements. We take a look at the impact on RIM, operators, Google and Apple’s flirtation with Twitter.

  8. Subscribe to Asymco One for full access to our podcasts.

  9. Songs, Books and Apps: What do the three media types tell us about the future of consumption?

    Research · 30 comments

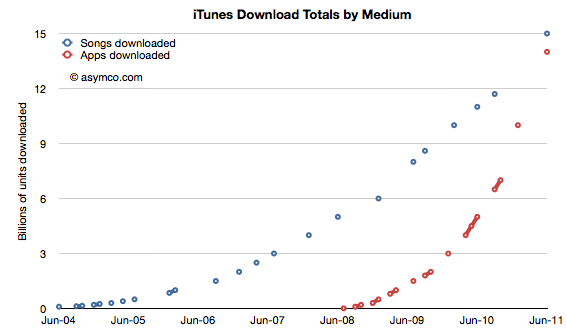
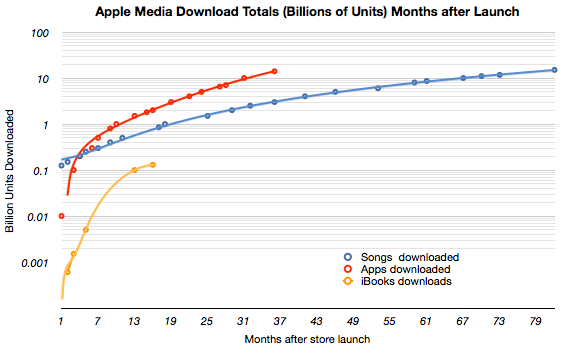
    The 200+ million iOS devices have caused 14 billion apps to be downloaded in less than three years. The iTunes music store caused 15 billion songs to be downloaded over a 7 year period.

    The two media download totals are shown in the following chart:

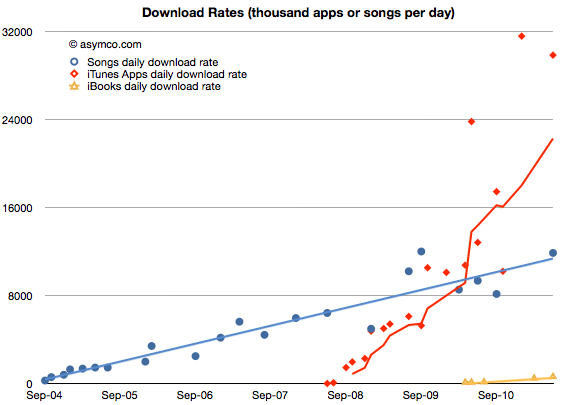
    About 9 months ago I predicted that Apps would overtake song downloads. I was off on the timing by a few months. The app download rate slowed down in the last few months. However, the crossover point is imminent. The song download rate is running at about 12 million per day while the app download rate is at about 30 million per day (the iBook download rate is still growing but is only at half a million per day). The following chart shows the three media types and their download rates over time.

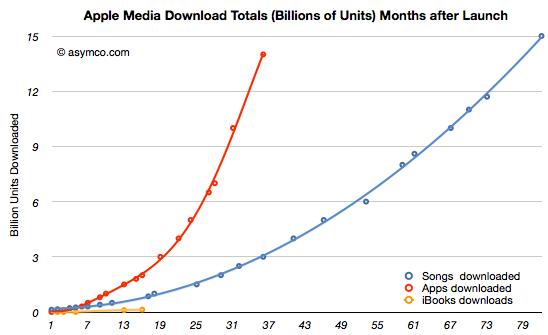
    Although it took about 35 months for Apps to reach 14 billion downloads, the equivalent time for the Songs was about 80 months. You can see the different "ramp rates" (cumulative totals indexed to the same starting date) for the three media on the following chart.

    Given the large numbers involved, a better view might be had looking at a log scale chart of the same data:

    What I would point out is the emerging pattern that the three media ramps are separated by about an order of magnitude. In other words songs are 10x more downloaded than books (at a given point in the life of the media store) while apps are 10x more downloaded than songs. You would see this pattern emerge within the log chart as the three lines run parallel and equidistant.

    Obviously, apps are going to be more popular than songs since many are free. And obviously songs are going to be more popular than books because many are much cheaper.

    But painting this picture with price is only a rough sketch. The ways that these media are consumed (and consumable) fills in the details. The amount of energy needed to enjoy each varies greatly. The "digestibility" of the material is different. In a way, these are the same factors which are drawing consumption toward tweeting, blogging and browsing and away from paper based media.

    The new technologies are allowing consumption to conform more closely to people's lives. They are like clothes that fit a bit better and are more comfortable. They may not look as good as formal attire, but in the end casual always wins.

  10. Subscribe to Asymco One for full access to our research.

  11. Subscribe to Asymco One for full access to our research.

  12. Peak RIM

    Research · 37 comments

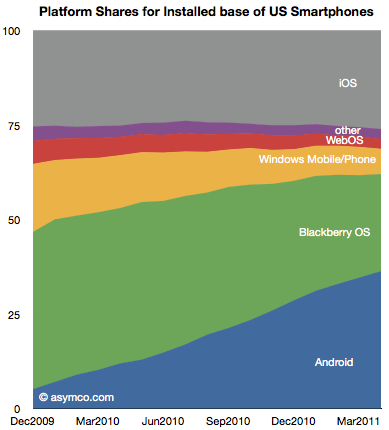
    In their monthly survey update on US phone usage, comScore reported that by the end of April 74.6 million people in the U.S. owned smartphones. In the same period a year ago only 48.1 million did. The percent of smartphone users out of total phone users has reached 32%.

    The following data points can also be deduced:

    • 2.1 million or 474k people/week became smartphone users during April.
    • 62% of smartphones in use in the US are either Android or iOS. The sum a year ago was 37%.
    • There are about 20 million iPhone users and 27 million Android users in the US today. A year ago there were 12 and 6 million respectively.
    • RIM's US user base peaked at 22 million in Sept 2010. It is now 19 million and dropping.
    • Usage of Microsoft mobile operating systems in the US is in steady decline dropping from 7 to 5 million users in one year.
    • During April 475,000 people abandoned their Blackberries.
    • Android and iOS gained 3 million users in April. One million switched from other smartphones and 2 million switched from non-smartphones.

    The following chart shows the evolution of installed base share of platforms among users of smartphones in the US.

    The impressive share gains for Android are apparently at the expense of RIM and Microsoft. Over the period shown, Android gained 25 million users while RIM gained only about 2.8 million.

    Although perhaps comforting to see some growth overall, the situation for RIM is more grim than that. During the first half of the period (December 2009 to August 2010) RIM had gained 4.6 million users. During the second half (Sept 2010 to April 2011) RIM lost 1.8 million users.

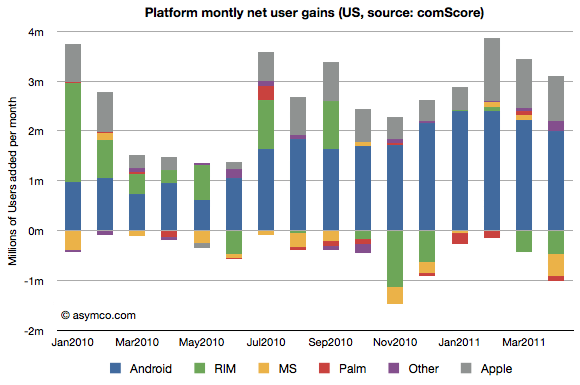
    The net user gains and losses for the various platforms is shown in the following chart:

    Note how RIM (green bars) went from being a consistent net usage gainer to a consistent net usage loser during this 16 month period. In addition, note how Microsoft's platforms (yellow bars) have had a very poor showing with very small gains during four months and moderate losses during the others. The losses in usage even increased after the release of Windows Phone late last year suggesting no traction whatsoever for Windows Phone.

    The other point to be made is that if we assume smartphone users remain smartphone users, then those platform losses are gains by other platforms. In other words, the areas less than zero in the chart above represent smartphone "churn" or switching between platforms (As a percent of all smartphone users that number represents 1.35%.) That number is far lower than the total smartphone gains, so it's safe to say that most of the iOS and Android gains were at the expense of feature phones rather than other smartphones. And since iOS share is consistent (and supplies are constrained), few if any Android gains are at the expense of iOS.

    There are many interesting patterns to observe in the data, but I think the most evocative is the erosion of Blackberry usage. If the Blackberry peaked, and a follower platform not yet in sight, the question is how long will RIM survive?

  13. Subscribe to Asymco One for full access to our research.

  14. Does the phone market forgive failure?

    Research · 59 comments

    One of the details of Nokia's warning which did not get a lot of attention was the mention that profitability for the current quarter could not be guaranteed. That is to say that Nokia may make a loss, perhaps for the first time in more than a decade.

    This may not be that newsworthy except for the strange fact that as far as I've been able to observe, any company in the mobile phone market that ended up losing money has never recovered its standing in terms of share or profit (i.e. AMP index value has never recovered).

    Here is a list companies that have "hit the rocks" in terms of mobile phone profitability and their fates (in no particular order).

    1. Alcatel of France. Sold its brand and operations to TCL Communications of China in 2004.
    2. Siemens of Germany. Exited in 2005 through acquisition by BenQ of Taiwan.
    3. BenQ of Taiwan. Mobile devices division declared bankruptcy in 2006.
    4. Ericsson of Sweden. Exited by merging with Sony in 2001 even though third in volume share the prior year.
    5. Sony of Japan.  Joined with Ericsson to form Sony Ericsson in 2001. Held less than 1% share prior to merger.
    6. Motorola of the United States. Even though once the largest vendors, after a period of severe distress, Motorola spun off Motorola Mobility. Market value shows long-term viability still a concern.
    7. Casio of Japan. Merged with NEC and Hitachi in 2010.
    8. NEC of Japan. Merged phone units with Casio and Hitachi in 2010.
    9. Hitachi of Japan. Merged phone units with NEC and Casio in 2010.
    10. Fujitsu of Japan. Merged with Toshiba in 2010. Held 15 percent of Japanese market prior to merger.
    11. Toshiba of Japan. Merged with Fujitsu in 2010. Held 4% share in Japan.
    12. Palm of the United States. Sold to HP in 2010.
    13. Handspring of the United States. Sold to Palm in 2003.

    That makes 13 large phone brands that, in less than a decade, have either exited or lost independence after suffering crises of profitability.

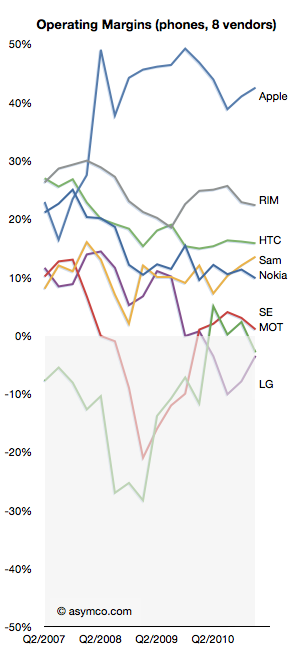
    As the following chart shows, at this time Motorola, Sony Ericsson and LG are still operating but have been dipping into the red.

    The three suffered severe volume contractions in feature phones and have no differentiation in software or platform products which makes their position precarious.

    This cursory survey shows that it's difficult to be optimistic once a company reaches a point of crisis. It's a curious outcome given that the market is so vast and growth is so robust.

    But the fact is that because of the technology cycle time, rapid business model evolution and fairly low barriers to entry, there is great rivalry between competitors. Profitability is the canary in the coal mine. It causes a brand to be tarnished in the eyes of distributors who, because of sales cycle times, are extremely sensitive to obsolete inventory. A loss maker is seen as a maker of damaged goods.

    It then turns off the tap of incentives, promotions and hence visibility in the eyes of consumers. It's a vicious cycle from which few (if any) can recover. Past greatness offers no succor.

    And so, with Nokia about to join the list of loss-makers it's only natural to question its fate as an independent company.

  15. Subscribe to Asymco One for full access to our research.

  16. Is Nokia worth less than Skype?

    Research · 57 comments

    Yesterday Nokia warned that its guidance for the quarter and the year were "no longer valid." The surprise to me is that management was surprised. In February I warned that even if Nokia could fool consumers into buying products whose platform was publicly executed, distributors and operators would not likely go along with the deception. Pricing collapse is the proof of a channel breakdown.

    That seemed predictable. What I struggled with was how Nokia itself could present such an optimistic forecast. Absent any explanation, Nokia's forecast of robust sales for Symbian products into the near future belies a failure of understanding of the dynamics of platforms and especially the impact of destruction of trust and brand value that commenced in February. Distress is a slippery slope and it does not model well in a spreadsheet. It takes a leap of non-linear faith to predict the piling-on effect on the up- and the down-side.

    Faith in the company's guidance meant that the market reacted to the bad news by discounting Nokia down to a market cap of $26.7 billion. One analyst even cut his target price down to $4/share, 57% of yesterday's close. How can this fair? What is Nokia's phone business worth?

    Here's a quick sum-of-the-parts analysis. After yesterday's hair cut Nokia's overall enterprise value is about $20 billion. The Navteq part of the business (purchased for $8.1 billion in 2008) could get a value of $3 billion (based on about 3x sales) and the value of Nokia Siemens networks could be at $6b (less than 0.5x sales). That makes Nokia's phone business worth about $11 billion.

    An alternative view based on "the Motorola case study" $4 target price would imply an overall enterprise value of $11 billion. This either makes Navteq and NSN worthless and Phones worth $11 or it makes the phone business worth a lot less than $10 billion. Perhaps less than $8.5 billion which is what Microsoft paid for Skype. Should we be shocked? Nobody would argue that Nokia is worth more than Facebook so who's to say that Skype or Twitter aren't more valuable than a device company in crisis?

    I don't try to predict the market's behavior, nevertheless, the markets are now very skeptical that there is much in Nokia to salvage. It's perhaps unfair and illogical but this is the end game of disruption. It ends much more suddenly than it begins. It's the consequence of nobody noticing the beginning that makes the end so shocking.

  17. Subscribe to Asymco One for full access to our research.

  18. Announcing the Asymco Store and the first Asymco T-shirt

    Research · 26 comments

    In celebration of one year of Asymco.com, the Asymco store is now open.

    Home - Asymco Store

    I am extremely grateful to Michael Burgstahler of Two Tribes design for leadership in creating the first t-shirt design:

    Based in the home town of Mercedes Benz and Porsche, Two Tribes has been in the creativity business for 18 years with clients like Ricoh, State Bank of Baden-Württemberg, Bosch and Siemens. They even built an app "Favorelli" and opened a little shop for home decoration.

    This masterpiece, along with a logo only version is available now.

  19. Subscribe to Asymco One for full access to our research.

  20. Is RIM's management the cause of its failure?

    Research · 62 comments

    "Jim and Mike brought the company to where it is ... which is part of the biggest problem they're facing," said Charter Equity analyst Ed Snyder, who has covered RIM since its public listing in 1997, two years before the BlackBerry was launched.

    "They're stuck in the past. They know what worked and keep playing that card and it's not working any more, and they don't seem to have any ideas," he said.

    via BAY STREET-As RIM struggles, talk of a change at top surfaces | Reuters.

    In the case of Apple, the departure of the founder is considered a grave threat to the continuing success of the company.

    In the case of RIM and Microsoft, the continued tenure of the founders is considered a grave threat to the success of the company.

    Clearly, the theory that founders of successful companies can assure continuing success is flawed. Coupled to that implied causality is that departure of founders is always a problem.

    Both are reflections of the idea that companies are predominantly successful (or fail) because of the skill (or incompetence) of a small group of individuals.

    What the idea fails to explain is why companies fail (or succeed) as a cohort. RIM's troubles are similar to Microsoft and to Nokia's. Did they conspire or collude to fail simultaneously? Historically, incumbents fail simultaneously, regardless of who's in charge.

    And what about the problem that a company goes from success to failure (and vice-versa) while the same management is in charge. The "smart manager" theory of company success is as pervasive as the "stupid manager" theory of company failure. The perplexing thing is that while both of these theories are applied within the lifetime of a company, the management does not change.