Asymco

Asymmetric Intelligence

Latest from Asymco

  1. Apple's Opex Efficiency

    Research · 3 comments

    asymco | Apple's R&D Efficiency.

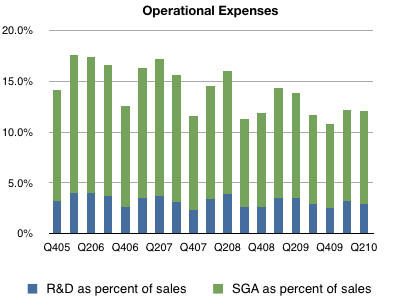
    Following up on R&D efficiency, we are measuring operational expenses for Apple.

    Here is the chart showing how, as a percent of sales, R&D + SG&A have declined, though R&D has been more resilient holding fairly steady at 3 percent and SG&A dropping from about 11% to approximately 9%.

  2. Subscribe to Asymco One for full access to our research.

  3. The iPhone growth rate

    Research · 14 comments

    John Gruber puts things in perspective:

    The key bit: “At the critical juncture […], when they should have gone for market share, they went for profits.” I think this encapsulates Jobs’s philosophy since taking over Apple in 1997. Take the high end of the market first, establish a brand and presence, then steadily start to expand.

    Daring Fireball: N92.

    I've long argued that Apple is in the phone business to win significant share (i.e. greater than the share they have had in the PC business).  Since the phone market is vast (1.2 billion phones sold in the last four quarters) iPhone volumes must be as well.

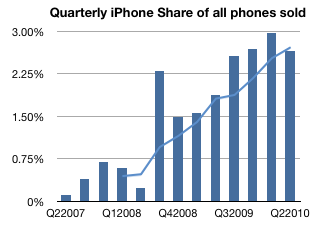
    So how has share evolved, and what can we expect? This is a graph of quarterly share for iPhone including a four period moving average:

    The trend is clear to see.  With seasonal variation due to the launch cycle, the share is likely to increase over 3% and keep going. How far can it go? That's a strategic decision for Apple's management. If we are to take Steve Jobs' word that their plan is not to be a niche player in any market they target then I have to conclude that Apple is aiming above 10%.

    The volume expansion in the US due to the end exclusivity is only the latest in a series of distribution deals that Apple has brought to bear: International expansion, dropping exclusivity in other countries and broadening the portfolio (including earlier models in current line-up) are all natural and obvious moves in a broader market push.

    Pricing might be considered another lever that Apple could use, though that seems unnecessary today.

    I conclude that growth in iPhone sales of 50% per year seems entirely possible for the next few years. Such growth would allow Apple to reach 10% of the world's 3G subscribers by 2013. That would still be only 4% of all phones and 20% of smartphones.

  4. Subscribe to Asymco One for full access to our research.

  5. Subscribe to Asymco One for full access to our research.

  6. The near-death experience prerequisite

    Research · 3 comments

    All phone vendors saw smartphones coming.  They hired all the right market research companies and spent lavishly on analysts to confirm that phones with operating systems were imminent.

    Nokia was one of the early movers, establishing its own software platforms group as early as 2002 while others like Samsung licensed Windows Mobile or PalmOS as early as 2003. Yet not much happened to sales. The number of smartphones units sold as percent of total has been fairly low.

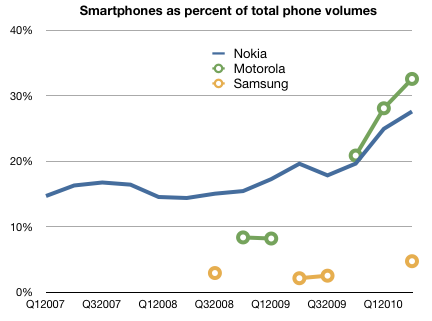
    The following chart shows the number of smartphones sold as a percent of all phones sold for the top three vendors (as of the time when the chart starts early 2007). Note that the percent of smart products shipped did not accelerate or grow dramatically for the largest two vendors even into last year.  It's still a pittance at Samsung (<5%) and even less at LG.

    The one vendor that did stage a shift was Motorola. (and Sony Ericsson, though later and softer) Both converts did this shift when faced with near-death experiences of sequential earnings losses and catastrophic market share collapses.

    Nokia is showing signs of a secular shift to smartphones but it's been a decade-long process so far, a slowness that ripped shareholder value to pieces.

    So is the precondition for a shift to smartphone focus a collapse in the core business?  It certainly seems so from the data. Motorola first, Sony Ericsson second, Nokia presently and Samsung and LG later.

    Each of these decision points reflect precisely the timing of pain points with the core businesses.

    Why this asymmetry? At first glance, the smartphone business should be sustaining and an attractive option to be exercised as soon as possible.  It offers better margins, better prices and a better return on capital.

    So why is there this disconnect? As regular readers of this blog can probably guess, my hypothesis is that the smartphone business is disruptive.  Incumbents are motivated to ignore this business because it makes money in ways they cannot control. More importantly, their best customers are signaling (in non-transparent ways) that they don't want their top vendors to participate in this market.

  7. Subscribe to Asymco One for full access to our research.

  8. Is an iPhone worth 8 Nokia phones or 2 Blackberries?

    Research · 4 comments

    Pricing is a leading indicator of value. Some might argue price and value are often out of whack but, in the long term the two converge.

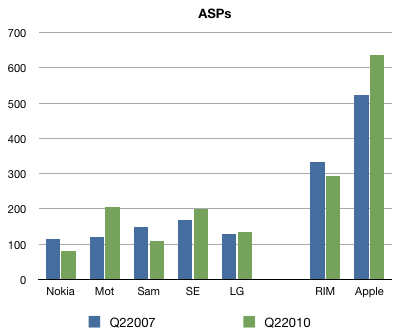
    So it's instructive to measure how a vendor creates value by what it's able to charge for its goods. In the case of mobile phones, price is summarized by something called ASP (average selling price) which is measured each quarter across a vendor's entire portfolio.

    Again, there might be local fluctuations, but the trend is your friend here.

    Take a look at these charts I prepared based on the group of seven vendors I previously analyzed in terms of their sales and volume performance.

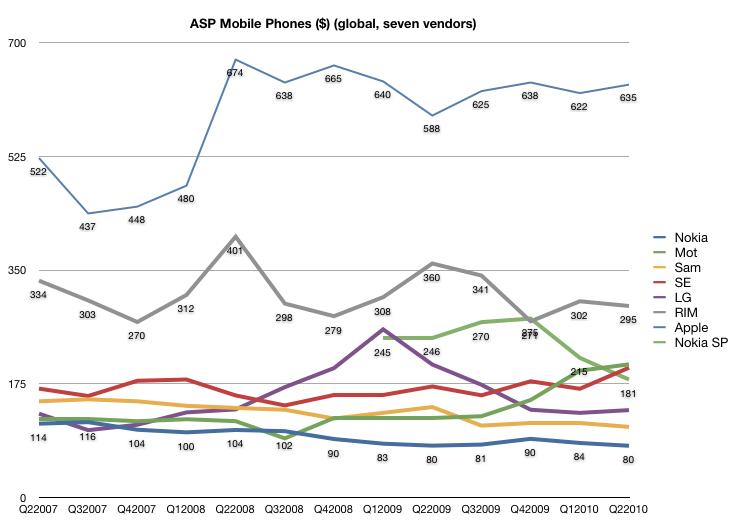
    First, a history of pricing since Q2 2007. All figures are in US dollars current as of time of reporting.

    Here we see the ASP erosion inherent in the large incumbents with Nokia and Samsung both seeing price slides. LG went through a phase of price growth but has returned to a point near to where it started three years ago.

    While Sony Ericsson and Motorola were following the downtrend until 2008, they reversed and began an ASP climb while fleeing upmarket (at the expense of volumes).

    Finally we have RIM and Apple both holding the line on pricing while growing volumes. Not only are the lines steady (with Apple slightly increasing and RIM slightly decreasing) but they are way above their competitors; Apple's shockingly so.

    Here is the before-and-after view:

    During the three year window we're looking at, Apple and RIM showed ASP durability while incumbents showed ASP erosion.

    Pile these data points on top of the volume and sales data and we can move forward.

    (In answer to the question in the headline, the answer is: Yes.)

  9. Subscribe to Asymco One for full access to our research.

  10. In phone sales, RIM plus Apple equals Nokia

    Research

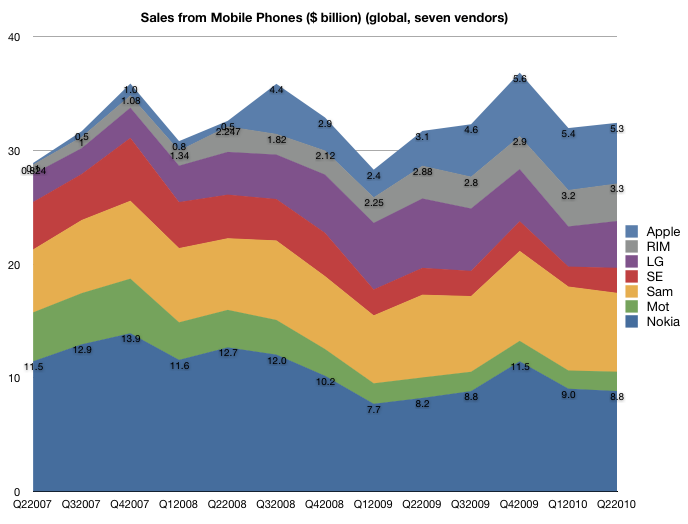
    Following up from the last article on the global phone units sold over the last three years (Visualizing the winners and losers of three years of smartphone share growth), we take a look at the sales in dollar terms over the same period.

    Remember that in the article on units, the pure-play smartphone entrants HTC, RIM and Apple grew from a combined unit share of 1.3% in Q2 2007 to a combined unit share of 7.7% in Q2 2010.  That's a 6 fold increase in volume share. Quite remarkable for companies lacking the vast resources and industry connections of the incumbents.

    However, when we look at their performance in value (dollar sales) vs. units sold, the performance of the entrants begins to look miraculous.

    The sales figures can be obtained from the company reports, though I caution that not all vendors publish data and data published is in local currencies. Fluctuations in exchange rates may lead to differences in reports of sales from different sources.  For the sake of consistency, I omit all "other" vendors and focus on the top seven: Nokia, Samsung, Motorola, LG, Sony Ericsson, RIM and Apple.

    First, the cohort's overall performance is shown in the following graph:

    I again annotated Nokia and RIM and Apple with actual sales (USD) figures for some perspective.

    The first thing to note here is that the whole industry sees a low rate of growth (unlike in the units picture). Total sales in Q2 2007 were $29 billion and total sales in Q2 2010 were about $32 billion. A mere 12% growth over three years and only 4% compounded over three years. Total units in Q2 2007 were 255 million and total units in Q2 2010 were 318 million, or 24% over three years and 6.2% compounded. This means industry-wide sales growth is half the units growth.

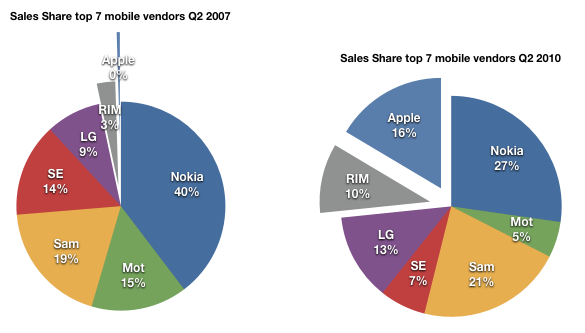
    The second thing to note is that the Apple+RIM group grew from 3.3% share of cohort to 26.6%.  That means that more than 1 in 4 dollars sent to these 7 companies was spent on Blackberries and iPhones!

    Jointly, Apple and RIM took $8.6 billion and Nokia took $8.8 billion.  Compare that with three years ago when Nokia took 40% of the income and RIM + Apple took 3%.

    So whereas the entrants increased units share by 6x in this time period, at least in this large subset of the market, they increased revenue share by 8x.

  11. Subscribe to Asymco One for full access to our research.

  12. US as epicenter for mobile data utilization

    Research

    Japan and Korea have further 3G reach but use it significantly less.

    His findings support notions that Android and iPhone are controlling data use in the US. The iPhone's current exclusive home, AT&T, and Android-favorite Verizon both make up 75 percent of American data use

    via Smartphone data use up 50% in just six months | Electronista.

    Is there any surprise that in the country where the iPhone and Android are most popular there is the highest data usage even though it has one of the poorest mobile data infrastructures in the developed world?

    What does that say about the importance of the device (and not the network) to the adoption of data services.

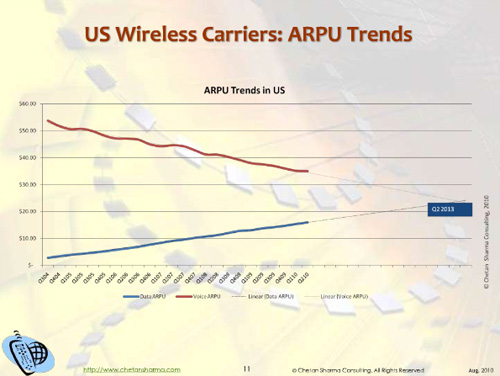
    There are implications about the relative power shift between operators and device vendors. Within the mobile value chain, as mobile data overtakes mobile voice, the economics and value propositions will shift. The motivation of participants will begin to diverge and a schism will occur.

  13. Subscribe to Asymco One for full access to our research.

  14. Visualizing the winners and losers of three years of smartphone share growth

    Research · 2 comments

    Many consider June 2007 to have been a pivotal moment in the history of mobile phones. Apple's entry with the iPhone has re-defined the market in many ways. However, there was a smartphone market before then. About 28 million smartphones shipped the quarter when Apple launched out of an overall phone market of 265 million. Apple's entry with 270k phones was a drop in the bucket.

    I thought it would be instructive to chart what happened between that quarter, exactly three years ago and today. I collected the data from IDC, Gartner and Canalys and company reports to paint a few pictures.

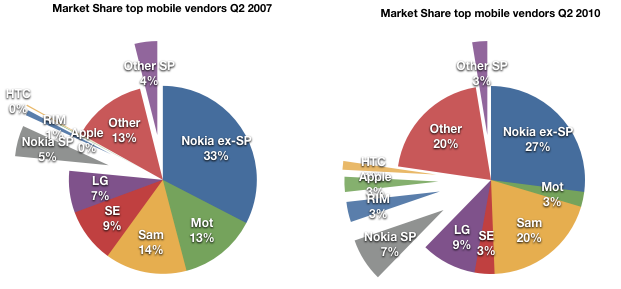
    First, the market shares (by units) of the top mobile vendors, Q207 vs. Q210. I highlighted the smartphone vendors by separating their wedges from the pie. Note that I also separated Nokia's smartphones from Nokia's regular phones as two separated wedges--Nokia ex-SP for no smartphones and Nokia SP as their "converged" units. I did the same with "other".

    The first thing to note (beside the large increase in smartphone share) is that "other" non-smartphones are a huge part of the pie. At 20%, the share of "other" is now equal to the share of Samsung. Other consists of a group of mostly low cost Chinese vendors. The growth of the low end "other" went from 35 million units in Q207 to 65 million in the last quarter. It's this competition that is driving profit out of the core businesses of Nokia, Samsung and LG and forcing a flight to smartphones (more about this later).

    The second thing to notice is that Motorola and Sony-Ericsson are highly visible victims of the last three years. Sony Ericsson shipped 25 million devices in Q207 and only 11 million three years later going from 9% share to 3%, on par with RIM and Apple. Motorola did even worse, shipping 35.5 million in Q207 and a mere 8.3 million last quarter, losing 10 out its 13 points of share.

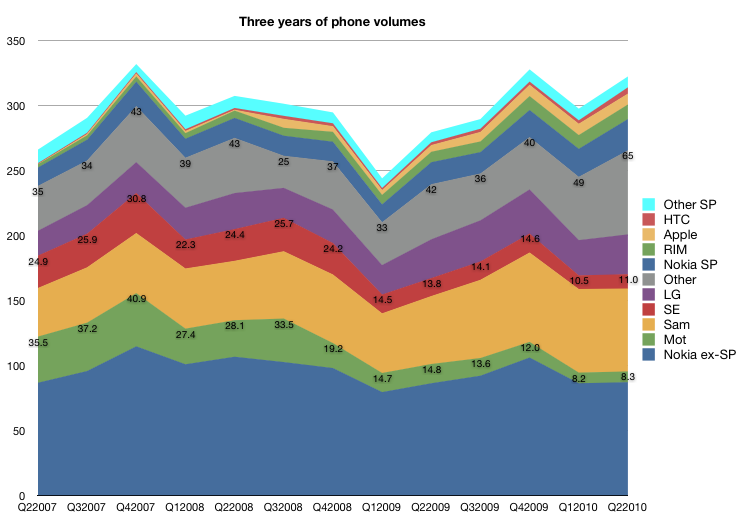
    Viewing the overall units market, one can see the gouge in units that the recession took out. The following graph shows three years of volumes by the top vendors with the smartphones separated at the top (Nokia SP, RIM, Apple, HTC and Other SP--everything above the grey band are smartphones).

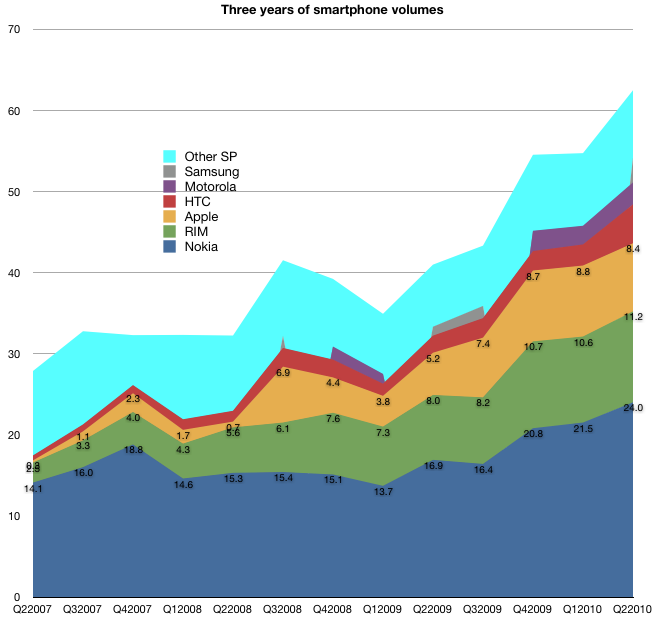
    However, separating out the smartphones, one can see their volume increased with barely a ripple during the recession. Although Nokia retains the top share spot, the entrants have jointly grown much faster.  I have annotated a few of the competitors' volumes with the actual values.

    One thing to note is that "other smartphones" has traditionally consisted of Windows Mobile licensees but that is quickly shifting now to Android. I also had only fragments of data for Samsung and Motorola, so their bands are incomplete.  However, one could note how minimal their participation has been in the market.  LG has been practically absent from this market.  For these latecomers to smartphones, it's clear what Android offers: a chance to stay in the game.

  15. Subscribe to Asymco One for full access to our research.

  16. The parable of the transistor

    Research · 6 comments

    This weblog could be read as a diary of the disruption of the mobile industry. There is lots of topical analysis and opinion, but sometimes I'll post on the "theory" which describes what's going on in a more abstract, and long-term, level. Theory is like a bullion cube: savory, but too concentrated to be enjoyed undiluted. For this reason, the most palatable way of administering theory is through example. So we kick off with an example of what happened to another technology industry as a result of the emergence of a disruptive technology.

    The following is a draft article I wrote describing the "electronics industry" for POSTWAR AMERICA: AN ENCYCLOPEDIA OF SOCIAL, POLITICAL, CULTURAL, AND  ECONOMIC HISTORY. It is itself based on a presentation by Clayton Christensen at the Open Source Business Conference in 2004.

    ----

    The consumer electronics (CE) industry began in 1920 when radio broadcasting commenced in the United States. Radio technology sustained a growing electronics business throughout the 1930's and 1940's, however, the electronics industry underwent a major transformation after the war. The critical development came after 1948 when the transistor was first invented. The transistor and the subsequent development of solid-state semiconductors dramatically and profoundly changed the industry. The change the transistor brought was not just evident in measures of technical performance but also in the economics of the industry and the business models required of its participants

    "Electronics" has a precise definition: technology based on the controlled flow of electrons. Prior to the transistor, the control of electron flow in a system was through a component called the electron tube (or vacuum tube). The tube in its simplest form is a gas-filled glass cylinder, much like an incandescent light bulb, with two electrodes or terminals inside. When the negative terminal is heated it emits a cloud of electrons which the gas inside the tube carries to the positive terminal. This device allows current to flow in only one direction since the positive terminal is not capable of emitting electrons. It is called a diode and is simply a one-way current or conduction valve. Hence the "semi" in semiconductor. Semiconductors can be designed into complex products that amplify, store and communicate; the core applications of CE devices.

    The transistor is significant because it is a "solid-state" semiconductor. Solid-state means that it is composed of solid components, unlike tubes which required a sealed gas to operate. The consequence of this shift from gas to solid components completely changed the industry and created unforeseen growth, wealth and societal change.

    NEW ECONOMICS

    The invention of solid-state semiconductors allowed new economies of production: components were smaller, cheaper and could be produced with a process closer to printing than to assembly manufacturing. Because of the subsequent advances in assembly, the cost of electronics products decreased even as quality and reliability increased. Power requirements and physical dimensions were also reduced, allowing greater portability.

    These implications might have seemed foreseeable to the engineers and businessmen of the 1940s who first looked at a transistor, but what happened is something completely unexpected: almost all the companies dominant in the electronics industry in the 1940s and 1950s who spent huge fortunes to perfect the transistor for their products went out of business or withered away to insignificance. New, giant CE companies emerged in Japan who perfected new product categories rather than challenge the incumbents and their existing products.

    The emergence of Japan as a powerhouse of CE has been debated as a motivation for changing US industrial policy toward a more interventionist model. Transistor technology was seen as a strategic national defense asset and the innovations and production associated with it were not to be allowed out of US control. Additionally, American politicians argued the case that it was US taxpayer-funded defense, educational and space efforts which produced these innovations, hence they "belonged" to the United States government, and future innovation will similarly need taxpayer funding. Unless something is done, Japan would dominate American industry.

    What happened in fact was far more mundane. The transistor disrupted the industry. Small upstarts were able to take the invention, wrap a new business model around it that motivated the current players to ignore or flee their entry. They thus successfully displaced the entrenched incumbents even though the incumbents were investing heavily in the technology and the entrants weren't.

    THE INDUSTRY THAT EMERGED

    The postwar half-century began with the radio as the center of the CE world. It ended with the television dominant, alongside a whole galaxy of mobile devices.  All employed the transistor, which itself underwent dramatic increases in power and equally dramatic decreases in size. Some of the significant breakthroughs along the way are listed in Table below. Note in the table the absence of any companies which dominated the CE industry before the transistor (RCA, GE, Zenith, Westinghouse, Philips, Magnavox, Curtis-Mathes, ITT, Packard-Bell, Philco, Siemens, Sylvania, Western Electric).[3]

    • 1957 Sony TR-63 Transistor Radio. Portability enabled privacy which allowed young people to listen to Rock-n-Roll.
    • 1960 Sony portable TV. Made a second television in the bedroom possible.
    • 1962 Sony CV-2000, first home videotape recorder. The concept of "time-shifting" was born.
    • 1970 Olympus Zuiko Pearlcorder Microcasette recorder. Audio recording became a discrete affair.
    • 1972 Pulsar Quartz Digital Watch. Quartz meant cheap but accurate watches for everybody.
    • 1972 HP-35 Pocket Electronic Calculator. The end of the slide-rule.
    • 1976 Atari Pong Game. A new use for TV: interactive games.
    • 1976 JVC HR-3300 VHS VCR. Mass-market cartridge-based video recording. Video rentals took off.
    • 1977 Atari 2600 Game Console. Game cartridges added a new category of content consumption.
    • 1979 Sony Walkman. Portable high fidelity music for your ears only.
    • 1980 Sony Boom Box. Portable high fidelity music for you and your neighborhood.
    • 1983 Sony CDP-101 CD Player. Loss-less audio reproduction for all.
    • 1984 JVC Camcorder. Home videos were born.
    • 1986 Motorola Bravo Pager. Contact somebody even if they are not near a phone.
    • 1996 Toshiba SD-3000 DVD Player. Loss-less video reproduction for everybody.
    • 1998 Nokia 5100 mass-marketed phone. Easy to use, customizable cheap mobile phone.
    • 1998 Diamond Multimedia Rio. Mobile digital compressed music consumption.
    • 1999 Tivo Series1 Digital Video Recorder. Skip commercials and freeze real-time video.
    • 2001 Apple iPod. All your music with you all the time.

    DISRUPTIVE IMPACT

    When the transistor was introduced in the late 40s and early 50s, most designers considered it inferior to existing vacuum tube technology as far as performance was concerned; transistors could not handle the power that was required to be used in the main CE products popular at the time, notably, the big tabletop radios and floor standing televisions. The transistor could not amplify sound as well as a tube, but it was small, solid, and used low power. Therefore, RCA, Zenith, and Westinghouse looked at the transistor as a electronics component with great potential, but one needed to be improved to match the tube as an amplifier before it could be used as a substitute.

    Every CE company was required to receive a license for the transistor from its creator AT&T, before they could put it in their products. But they took out these licenses in order to experiment with the new technology, hoping they themselves could improve it sufficiently for use in the CE products.  Altogether, these CE companies spent an aggregate $2 billion (in today’s dollars) trying to make solid-state electronics good enough that they could make popular high-end CE products with them.

    And while tube companies were trying to fit the transistor into large products, other companies, especially in Japan, were developing the first transistor-based products.  One critical one was a transistor hearing aid, first marketed in 1952. While hearing aids were a tiny market in comparison to radios and televisions, it was a market that valued the miniature size and low-power requirements of the transistor. In 1955, Sony introduced its first pocket radio. The sound quality and reception of those radios was very poor relative to the "console" systems available in living rooms. But Sony chose to sell the pocket radio to teenagers. Teenagers were delighted to have a product that was inexpensive and that they could carry with them, allowing them to listen to the rock and roll music their parents may have disapproved of.

    Thus, a booming new market emerged based on a hitherto neglected feature that transistors made possible: portability. Meanwhile, the existing big American CE companies felt no need to change their business plans because the new products, in their opinion, were going to new customers not existing customers. Had Sony tried to sell its pocket radio to the parents, the product would have been judged to be inferior because they had the alternative of a high quality vacuum tube radio in their homes. Then in 1959, Sony introduced its first portable television, and again, the portable television was marketed to a whole new cohort of consumers who could not afford expensive, tube-based consoles. Since the alternative for these consumers was no TV at all, they were willing to accept a product with a somewhat inferior picture and reception.

    By the 1960s, solid state electronics had become capable of handling the power required to make larger CE products, making it possible for the big American CE companies to incorporate solid state electronics in the big home products area that they dominated.  And, indeed, by the end of the decade all of the products for the mainstream living room market were using solid-state semiconductors. However, they were largely being made by Japanese companies. The Japanese perfected the semiconductor components through their foothold markets to such an extent that the American offerings were not nearly as good. The venerable vacuum tube companies were doomed.

    THE CYCLE REPEATS

    The table ends with four company names that are distinctly non-Japanese. The phenomenal process of innovation-based disruption is under-way again. This time, the incumbents are the same Japanese companies that used the transistor to disrupt the previous incumbents while the new entrants are small companies focused on microprocessor-enabled digital media or communications. In a cruel irony, the incumbents framed the innovation of digital media products as not good enough for the living room while the entrants saw it as good enough for a new, non-consumptive mobile or time-shifted usage. The existing customers saw the digital products as inferior while the new customers saw portability as a fair trade-off for quality.

    A future article will discuss how the telecom industry saw voice mobility as sustaining but data mobility as disruptive.
    ----

    REFERENCES

    1. Electronics (2nd Edition), Allan R. Hamley, Prentice Hall, August 3, 1999.
    2. The Innovator's Solution, Clayton M. Christensen, Michael E. Raynor, Harvard Business School Press, September 2003.
    3. "The Top 100 Gadgets of All Time", Chris Null, Mobile PC, March 2005.
    4. Sony, John Nathan, Mariner Books, April 2001.
    5. The Road Ahead, Bill Gates, Nathan Myhrvold, Peter Rinearson, Viking Press, November 1995.

  17. Subscribe to Asymco One for full access to our research.

  18. Warner Music slows while iTunes grows

    Research · 3 comments

    Revenue from digital sales of recorded music grew just 3.7 percent to $169 million. That's a slower pace than the 4.5 percent growth posted a year ago and 39 percent growth two years earlier.

    via Warner Music CEO looks `beyond iTunes' amid losses - Yahoo! Finance.

    For the record, iTunes did grow at 35% in the quarter that Warner Music grew digital sales by 39% two years ago.

    But the two diverged a year ago with 17% iTunes vs. WMG's 4.5% and this past quarter iTunes grew at 27% vs. 3.7%.

    Gives us an idea of how much Apps have swelled iTunes' top line.

  19. Subscribe to Asymco One for full access to our research.

  20. Why Apple's cash is worth more than Microsoft's cash

    Research · 11 comments

    My recent exposé of Apple's cash (and cash equivalents and long-term securities and short-term securities) drew quite a bit of attention, which is good. Because it needs to be demystified. However, the story does not end there. Part of the problem of cash is that the liquid stuff can often itself change in perceived value due to mis-management.

    Cash has to be valued on the basis of what's to become of it. So what can become of it?

    The value in liquid assets can be returned to shareholders in the form of a dividend, which means double taxation on profits; not the best idea usually. Or it can be returned in the form of share re-purchase which tends to have only a temporary effect on share prices, again not a great return. The value can also be increased by means of investment in projects that return higher than what investors expect their cost of capital to be. This is the best option but investment is difficult when the amount involved is so big that no project or set of projects could possibly cost enough to employ the capital. Finally, the value can be completely destroyed through large acquisitions.

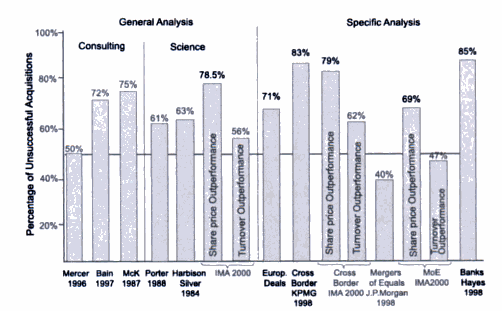
    I say destroyed because the history of large acquisitions is almost universally known to be value destructive (1). The urge to M&A is why cash on the balance sheet for large companies is usually discounted and share prices "get no credit for it." This is plaguing Apple with a P/E ex-cash in the teens.

    Is this fair?

    Companies faced with low growth are more likely to blow their cash on desperate acquisitions than those with high growth, but the best way to judge the probabiliy of cash evaporation is by looking at management track records.

    Which leads us to Microsoft.  Their pursuit of Yahoo shows how desperate they had been in trying to catch Google and how poorly that would have turned out. Having failed only because Yang refused to sell, Microsoft would have gone through a large part of its cash and even raised debt to finance a dud.  With this propensity, it's no wonder that Microsoft's cash is considered an endangered quantity.

    Microsoft used to have the largest cash position in tech. They still have $44.5 billion--a mere billion or so less than Apple. Some of the value already evaporated on dividends and medium sized acquisitions ($500 million for Danger that ended up as Kin(dling)). The chances that they'll blow billions again on desperate means to chase competitiveness are high. I would say it's a certainty.

    On the other hand we have a high growth company like Apple that has not traditionally spent money on business acquisition. (They do spend on asset acquisitions--IP, code, developers but not on new business models.) Thus, on reputation alone, Apple's cash can be considered "safer" and hence worth more than Microsoft's.

    Whether Apple can expose that cash to risk that enhances its value is another matter, but their CEO is on the record stating that "it's not burning a hole in their pocket" and the CFO repeats every quarter he is intent on its preservation.

    This, in my opinion, makes the difference between Apple's $45 billion and Microsoft's $44 billion a lot more than $1 billion.

    (1) Various studies have shown that at least 50% of acquisitions have been rated as failures. See failure rates by various studies charted below. Source: Prof. Dr. Thomas Straub (2007) "Reasons for frequent failure in Mergers and Acquisitions"