How The Magic Happens
Andre Briggs:
This is why is so hard to explain to outsiders what it is that I actually do sometimes. Sure, everyone on my team designs and develops but at the core we are constantly persuading with varying degrees of success.
Andre Briggs:
This is why is so hard to explain to outsiders what it is that I actually do sometimes. Sure, everyone on my team designs and develops but at the core we are constantly persuading with varying degrees of success.
How does an organizations structure, resource allocation and measurement dictate its capabilities? Horace and Anders discuss Amazons AWS business in comparison to their traditional online retail business and the Apple and Google strategies.
Apples Services business is growing by leaps and bounds. How much of that can be attributed to iCloud? Horace and Anders consider how big the iCloud business is for Apple, as well as Apples recent stock price rise in this "rolling show" on the way to the airport.
Research #Market · 23 comments
Apple has declared that what used to be "Other Music Related Products and Services" ((Includes revenue from sales from the iTunes Store, App Store and iBookstore in addition to sales of iPod services and Apple-branded and third-party iPod accessories.)) plus "Software, Service and Other Sales" ((Includes revenue from sales of Apple-branded and third-party Mac software, and services.)) which was formerly known as "iTunes/Software/Services" ((Includes revenue from sales on the iTunes Store, the App Store, the Mac App Store, and the iBooks Store, and revenue from sales of AppleCare, licensing and other services)) is about to become "Services".
"We'll also have a category that we refer to as services and this will encompass everything we report under the heading of iTunes software and services today including content, apps, licensing and other services and beginning this month it will also include Apple Pay."
"Services" will therefore encompass a massive amount of revenue. The reported revenues for the fiscal 2014 were $18 billion. Including all billings, the turnover in sales is over $28 billion. For next year, assuming that Apple Pay, which is just getting started, is unlikely to contribute greatly to revenues, Services turnover will top over $35 billion. That figure would make Apple Services alone one of the top 90 companies in the Fortune 500.
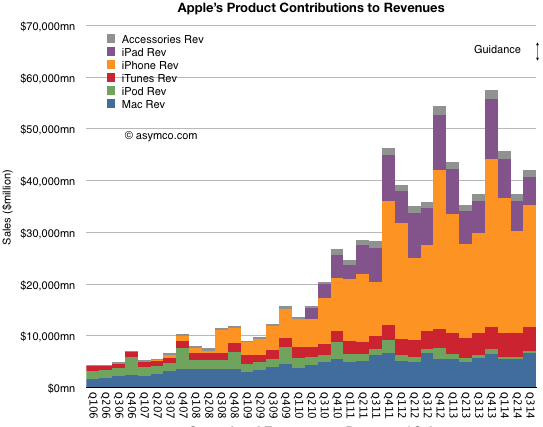
Regardless, as a component of overall sales, the group formerly known as iTunes/Software/Services (shown in red above) was a modest 7% of total sales in the last quarter. Using all available information regarding downloads, payouts and reported financials, an estimate can be obtained on how this 7% is itself divisible into nine sub-segments:
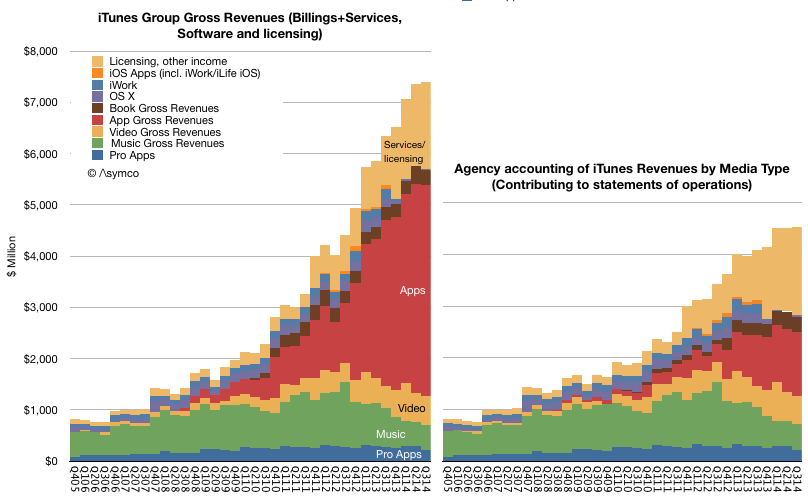
These are shown above as either contributing to statement of operations (i.e. as reported, on right) or using billings (or the actual "cash register takings", on left). ((The primary distinction is in Apps billings where the 70% paid to developers is not shown as revenue.))
What would be ideal in understanding this Services segment would be to break the "Licensing and other income" into its component parts. Namely:
In particular, it would be very interesting to know exactly how much revenue could be coming from iCloud. We have not heard from Apple on iCloud user numbers since mid-2013 and this was the data at the time:
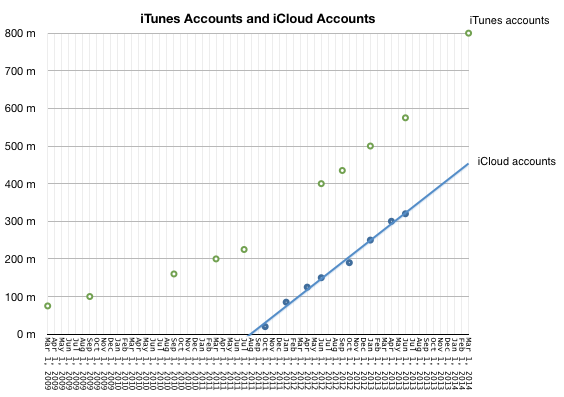
Couple that to "Licensing and Other Income" as deduced from Services accounting yields the following picture:
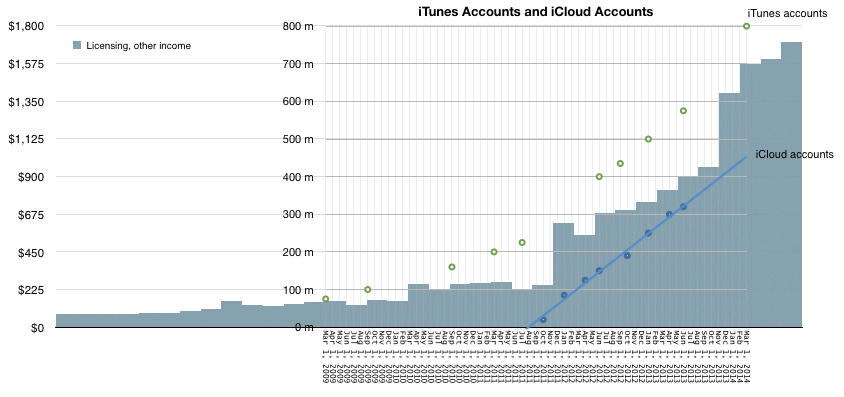
It would appear that iCloud accounts are growing in proportion to "Licensing and Other Income". Note that at the point that iCloud accounts were zero, revenues from Licensing were about $225 million/quarter and growing slowly. The real growth kicked in when iCloud accounts started ramping up. Since revenues from iCloud has to be in the "other income" and since no then it is, I believe, reasonable to assume that the iCloud user base growth is a principal driver of growth ((Of course, AppleCare could also be a driver but AppleCare should follow overall device sales patterns and this is not clearly evident in the Licensing/Other curve))
Also, bursts in the Licensing and other income line occurred after several iCloud-specific marketing events:
Mobile Me migration started in October 2011 and on September 30, 2013 the complimentary iCloud storage plans expired and were automatically adjusted to the free 5 GB plan (with an offer to upgrade to a paid plan). Correspondingly, Q1 2012 and Q1 2014 showed the largest increases in Licensing and Other Income.
This is a multiplication of many assumptions, but there is some intuitive logic. The only place iCloud can be found seems to be growing in proportion to iCloud users and plan marketing.
So how much does iCloud contribute to Apple's sales? My guess would be about $1 billion per quarter. That would be spread over 500 million iCloud accounts and therefore an average revenue per account of $2/user/quarter or $8/user/yr.
The lowest non-free iCloud pricing is about $12/yr (5GB plan is free). This would imply that two thirds of iCloud users are paying users (and one third are opting for the 5G plan).
I realize that this attach rate to a paid service is astronomical. Anything over 10% is unheard of. I would say the error in my estimates could be 20% but that still leaves a huge gap to what seems reasonable.
[Put another way, if the attach rate were only 10% then iCloud revenues would have to be in the $600 million range and thus only about 10% of what Licensing and Other income seems to be. This would force the question of what could be generating the remaining $5.6 billion/yr.]
What motivates a company to destroy its brand?
We start with Mini’s plans to sell 100,000 cars in the States by 2020, nearly double today’s pace and remember how Cadillac destroyed their brand and how Mercedes, Porsche, Ferrari et. al. can’t wait to do the same.
Also, might retail power in the form of strong dealer regulation limit brand’s ability to improve or address customer experiences? What motivated Warren Buffet to enter the American car dealer business? (With a long aside on what Buffett investment logic is all about and why it’s not contradictory to a growth investor).
Horace and Anders discuss Apple Watch pricing, Consumerism and Planned Obsolescence. In the closing segment Horace presents a new dichotomy of company values.
via 5by5 | The Critical Path #130: Determinism vs. Probabilism.
We talk about Samsung, Apple Pay (vs. CurrentC) and Xiaomi.
Research #Market #Theory · 112 comments
When the Apple Watch was launched, all eyes turned to the Swiss watch industry. Analysts measured it and asked if it's big enough to be interesting. Industry observers questioned the competitiveness of an entrant vis-à-vis the ancien régime. Marketers weighed in with segmentation hypotheses and how Apple's queer new device might best fit.
These are all mistakes in analysis.
The market for Apple Watch is not the Swiss (or Chinese) watch market. The market for Apple Watch is the number of wrists in the world. To the extent that those wrists will be covered with Apple hardware will determine whether it is successful or not.
Measuring the existing market is a mistake because the existing products are hired for different jobs. Those measurements will yield only an answer to how big that job is.
Assessing competitiveness vs. incumbents is a mistake because incumbents have perfected solving the problems of wrist-worn timekeeping devices over a century. Apple's watch is not a wrist-worn timekeeping device any more than the iPhone is a phone or the iPad is a pad.
Segmenting the market by whatever means are convenient today is irrelevant because the segments are currently positioned on the current jobs to be done. It's no more relevant than classifying the iPhone along the segments defined for phones in 2007. ((e.g. keyboard phones, flip phones, and feature phones))
Some have tried to wedge the Apple Watch among the "fitness tracker" market. This is no more plausible given that fitness tracking is no more interesting than timekeeping is to Watch.
The best way to measure the opportunity is to quantify the "wrist-space-time" continuum and deciding what is and what isn't addressable. The wrist is an interesting place to put a computer and Apple makes computers. The rest is left as an exercise to the reader.
Ben Bajarin:
A few weeks back Horace Dediu of Asymco and I were having dinner and we got to discussing some of this updated thoughts on disruption theory. One bit in particular was how the luxury tech market was causing him to evolve some thinking on the theory as it relates to consumer markets. I thought it would be great to have him on and we could chat more about disruption and the role it plays in the technology industry in the 21st century.
via Podcast: Discussing Disruption Theory | Tech.pinions - Perspective, Insight, Analysis.
Research #Industry · 76 comments
Samsung's smartphone ascent was breathtaking. From having essentially zero market share in the category in late 2010 to becoming the largest vendor took less than two years. In doing so it grew to become the largest phone vendor, smart or not--a goal which eluded them during the previous decade of effort. Samsung went on to capture not only the lion's share of unit volumes, they also took almost all the profits in the Android mobile phone market.
And in a market filled with competitors. Literally hundreds of vendors and thousands of products were available at every conceivable price point. Samsung did away with HTC, LG, and Motorola. HTC, the first Android vendor (and first to market with Windows Mobile), Motorola, Google's launch partner in the US and "Droid" brand partner (and future owner). Google's own Nexus products. Samsung Galaxy ruled them all.
Galaxy swamped the Chinese market and the Indian market, the largest in the world. They were so powerful that they were singled out both by Microsoft and Apple for IP royalties.
All within two years or the average life-span of one smartphone.
But something went wrong in 2014. Growth in shipments suddenly stopped. This was not a problem with the overall market, which kept growing. The slowdown did not affect other vendors, especially the up-and-coming Lenovo and Xiaomi and the second and third tier vendors whose names are known only in the local markets they serve.
The result of this slowdown is shown in the following graphs:
<>
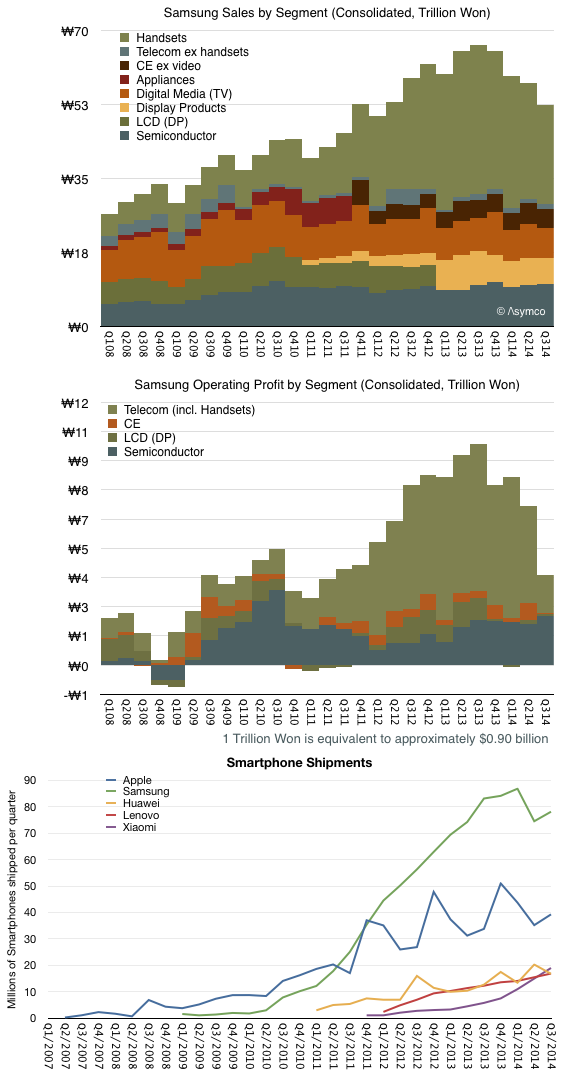
Note how the wobble in units shipped was foretold by slowing revenues and an even more profound effect in profits. Peak revenues and profit occurred in Q3 2013 while volumes continued to grow until Q1 2014. Even in the last quarter, shipments are at near year-ago levels. Profits however have dropped to 2011 levels.
At the same time, Apple shipments continue to grow as do those of Lenovo, Huawei and Xiaomi. Xiaomi in fact is growing in a trajectory eerily parallel to that of Samsung from 2010. It just hit the same level of volume that Samsung had in Q2 2011. And Samsung had been making phones for decades while Xiaomi is barely two years old.
Having seen a boom/bust rise/fall pattern with other vendors (e.g. Nokia and Blackberry) it should behoove us to ask what are the causes of success and failure in this business. Samsung management suggests that they perceive speed of action, product mix/portfolio choices and hardware experimentation are the keys to their success.
However, competitors which are rising rapidly (at the expense of Samsung) are not acting in the same way. Xiaomi is patterned as a Chinese Apple, offering design, brand, attention to detail and software as differentiation. Lenovo is building on its computing roots and expanding with acquisition. Huawei and ZTE leverage networking business and operator relationships.
The crisper answer to causality may be that the market is bifurcating into an "upper" market where new jobs-to-be-done are being explored with integrated offerings (Apple and Xiaomi) and a "lower" market which is in the throes of low-end disruption. Both are competing with non-consumption though the upper market is service non-consumption and the lower market is feature non-consumption.
Samsung is stuck right in the middle ((Just like Nokia was.)) It defines itself on the basis of what exists. It competes only within a defined market and positions itself agains existing products. They claim to be "better" than the competition and make the point loudly with their advertising. However, being better is never a solid foundation. At some point you'll be either good enough or someone more agile will be faster than you.
At some point the fast follower exposes themselves to being faster followed. Better to find new lands to conquer.
12 months ago I asked How many iOS devices will be produced in the next 12 months?
Based on the analysis of Capital Expenditures (as forecast by Apple in their annual 10K report) I concluded "iOS unit shipments should be between 250 million and 285 million."
The answer turned out to be 247 million. ((Including an iPod touch estimate of 9.5 million)) Including Apple TV the total would probably be around 251 million.
Since last year, I adjusted my model by observing corresponding iOS unit shipments for the calendar year corresponding to each fiscal year. Since the calendar year is offset by one quarter (FQ1 = CQ4) looking at calendar year means looking forward one quarter post-spending. I believe this is more accurate as spending generally happens in advance of production.
The resulting pattern is shown below:
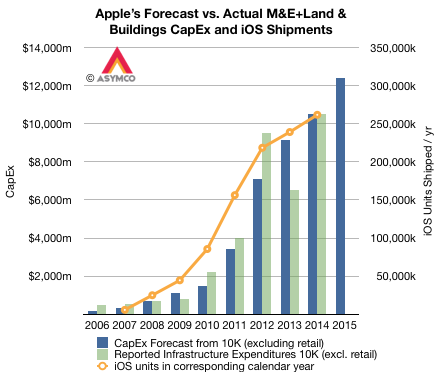
The company is currently anticipating spending $12.4 billion on non-retail CapEx. The spending for last fiscal year was almost exactly what was anticipated in the previous 10K. If we calibrate production (with a 3 month shift) to the 2014 benchmark, then 2015 calendar year would see about 310 million iOS units.
The big question is whether this will include Apple Watches. To answer this we have to make many guesses:
Does the company have a deliberate production plan for Apple Watches? What is the lead time? How quickly can production be ramped given channel and demand?
Do Apple Watches require significant capital expenditures? Do Apple Watches require capital intensity similar to iPhones and iPads? How unique are the watch cases, straps and computing cores? What are the demands of the digital crown, the sapphire crystal, the display?
The capital budget of $10.5 billion in F2014 had to cover the ramping of the iPhone 6/6Plus as well as some of the new Macs, iPads and the Arizona sapphire plant ((Note that some of that would have been in 2013 and at about $0.5 billion, the plant was about 5% of CapEx)). It also had to cover some of the new campus ((The construction cost of $1billion/yr would amount to about 8% of the capital spending (non-retail) )). In previous years the capital budget also covered data center construction ((Including vast renewable energy infrastructure)) which may not be present in the future budget.
The non-retail capital budget is anticipated to increase by 18%. There are more moving pieces next year than usual, but directionally at least, CapEx remains a strong indicator of future iOS growth. Especially as it's given to us a full year in advance.