The Birth of Silicon Valley
A short anecdote about the history of Silicon Valley told at Asymconf California last year using techniques taught at Airshow workshop.
Next workshop is in San Jose on Jan 30, 2014.
A short anecdote about the history of Silicon Valley told at Asymconf California last year using techniques taught at Airshow workshop.
Next workshop is in San Jose on Jan 30, 2014.
Research #Theory · 185 comments
A company is nothing more (and nothing less) than three things: people, processes and purposes. In the language of the software engineer these would be inputs, algorithms and specifications. In the language of classical business analysis they are assets (or resources), organization structures and business models. In military theory, these are logistics, tactics and strategy.
This is the trinity which allows for an understanding of a complex system: the physical, the operational and the guiding principle. The what, the how and the why.
When approaching any analysis problem, these questions form the foundation of causal inference. What is it, how does it work and why does it exist?
When analyzing nature the sciences often help with the what and the how but rarely address the why. ((Religion attempts to answer the whys which science leaves as unanswerable.)) In contrast, man-made systems (e.g. systems of law, religion and commerce) require an answer to the why as there is a presumption of a will in their creation and preservation. The why allows ultimate judgement on the merit of an enterprise. The why may escape us but it's assumed to always be there. For instance, in criminal law the motive is often a crucial piece of evidence but it's not always found. In business, the motive for action or for organization is a crucial piece of the puzzle which often explains the what, who and how, but here the ultimate why is usually profit. This the characteristic of a for-profit business, the purpose is explicit.
Some companies try to define their purposes beyond profit but they are often too vague or merely speak of values represent a quality not causality.
This is the case with Google. The problem isn't only that "don't be evil" isn't a priority or a purpose, but also that its resources are not applied to cohesive goals. In fact, there seems to be no interest in pursuing a direction aligned with generating income.
This is not in itself a bad thing. The notion of operating as a learning (vs. a deliberate) organization, informed but not driven by a goal, is the best approach when seeking new markets or discovering new needs and new business models. The difference with Google is that there seems to be no expectation of business model discovery. In other words, that the learning is not for any purpose other than learning itself.
This might be noble but learning for its own sake has not been attempted by public, for-profit organizations ((The Bell Labs story in an interesting possible exception but on deeper inspection it was the by-product of a government sanctioned monopoly and hence a ward of the state)) since there is an implicit fiduciary responsibility to generate profit and unrestricted experimentation, unguided by profit, is unlikely to ever learn the needs of markets.
The evidence I note supporting this is in the persona the company maintains, both internally and externally. There is no representation of themselves as a "business seeking profit" or even as a commercial entity. It's not simply because their business model is embarrassing. It's because all business models are embarrassing.
The representation is one of a research laboratory succeeding against difficult problems. Very similar to a successful academic or industrial laboratory sustained by grants from a benevolent (but messy) organization. Google becomes the embodiment of "big science" and "the world's laboratory" unfettered by politics and unsoiled by commercial interests.
There is a business in Google but it's a very obscure topic. The "business side" of the organization is only mentioned briefly in analyst conference calls and the conversation is not conducted with the same team that faces the public. Even then, analysts who should investigate the link between the business and its persona seem swept away by utopian dreams and look where the company suggests they should be looking (mainly the future.)
There are almost no discussions of cost structures (e.g. cost of sales, cost of distribution, operations and research), operating models (divisional, functional or otherwise) or of business models. In fact, the company operates only one business model which was an acquisition, reluctantly adopted.
It's as if the management is not only uninterested in its own profit model but deeply scornful of it. For all the technology innovations the company can claim, it has not had one internally sourced business model innovation.
But is this wrong? Again, we need to ask if Google breaks with convention then maybe convention needs to be broken. This is the radical bet underlying the Google thesis: are business models necessary? This is in fact a bet many VCs are implicitly placing within the current start-up culture. The notion of making a profit or even having an interest in doing so seems passé. This notion is directly traceable to the Google ethos as it acts as the source of acquisition funding and is driving the agenda of VCs and entrepreneurs. This is leadership by example and the example is one of blissful ignorance of market constraints.
But we have to go back to the profit model, even if analysts, observers and the company itself sweep it under a rug. The reason is that this laboratory runs only as long as the grant money keeps coming. No bucks, no Buck Rogers. So far the money rains down from heaven, but that rain is not infinite nor permanent. The answer seems to be diversification, even the creation of a conglomerate. In other words, the answer seems to be that if enough great technology is developed or acquired, then a business model will appear (think about it as a probability problem) and the vulnerability of revenue sources is managed. Clever? Convenient? We'll see.
But that's not the only problem. The deeper problem is in us knowing their intentions. The absence of a purpose rooted in profit makes Google resistant to analysis. There might be a purpose, known only to the founders ((or not known at all)), but it's one that is potentially naive, amoral or too abstract to be useful. Shareholders are aware of this and have agreed to entrust control to only three individuals. The purpose of the organization is in their hands alone and reflects their priorities. Bearing in mind that the road to hell is paved with good intentions, they must be brave indeed.
This would not be too troubling if the effect would be restricted to the company stakeholders. The trouble lies in that organization also having de-facto control over the online (and hence increasingly offline) lives of more than one billion people. Users, but not customers, of a company whose purpose is undefined. The absence of oversight is one thing, the absence of an understanding of the will of the leadership is quite another. The company becomes an object of faith alone. Do we believe?
As Philip Elmer-DeWitt is still interested in my estimates I provided the following:
Revenues ($B) 57.8
EPS ($) 14 (908m shares)
iPhone (units) 56.4 million
iPod (units) 7.6 million
Mac (units) 4.14 million
iPad (units) 26.5 million
iTunes/Software/Services ($) 4.2B
Accessories ($) 2.2B
GM% (percentage) 37.1%
I arrived at these estimates without looking at anyone else's (except for Apple's own published guidance). Soon after sending them I noticed that Daniel Tello published his own.
In the same format as above, I quote them for comparison. Please visit his post for additional detail.
Revenues ($B) 59.0
EPS ($) 14.92 (895m shares)
iPhone (units) 56 million
iPod (units) 9 million
Mac (units) 4.65 million
iPad (units) 25.5 million
iTunes/Software/Services ($) 4.3B
Accessories ($) 1.8B
GM% (percentage) 37.8%
The graph below shows the history of revenue guidance vs. revenue reported. The last quarter shows my estimate for net sales.
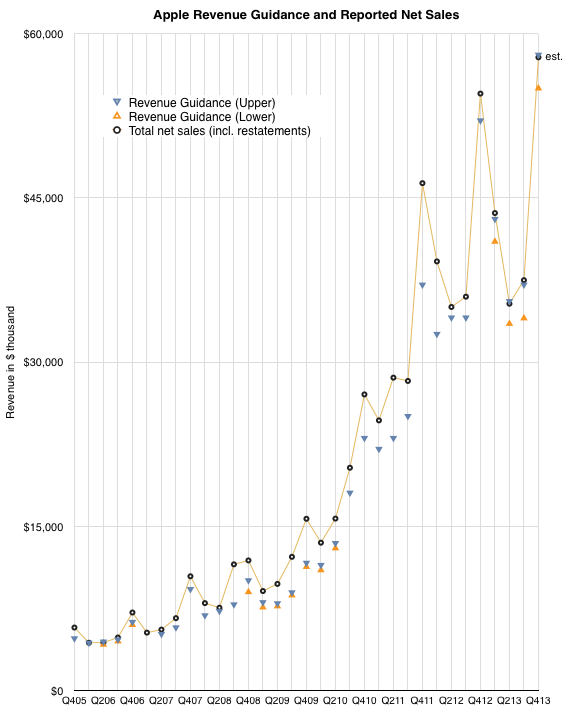
Note that the company achieved at or slightly above its upper guidance ever since they started offering a range for guidance (i.e. since Q1 2013). My estimate for sales is therefore very near the top of guidance. The figures for units earnings and margins all result from this assumption.
Research #Industry #Nostalgia · 418 comments
In 2013 there were 18.8 times more Windows PCs sold than Macs. This is a reduction in the Windows advantage from about 19.8x in 2012. This decline is mostly due to the more rapid decline in Windows PC shipments relative to the more modest decline in Mac unit shipments. Gartner estimates that about 309 million Windows PCs were shipped, ((This figure is not published publicly but can be derived from subtracting Mac shipments from the total PC shipments which are published)) down from 337 million in 2012 (which was down from 344 million in 2011, the year PCs peaked.) I estimate about 16.4 million Macs were shipped in 2013 down from 17 million in 2012.
The history of PC shipments relative to Mac shipments is shown in the following graph:
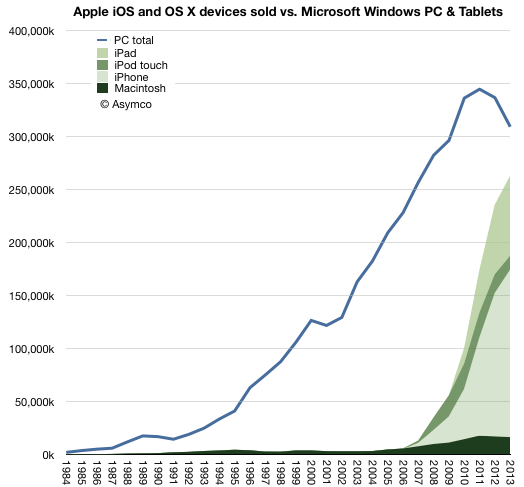
I chose to graph the Mac data as an area with additional areas for iOS devices layered on top.
When comparing these platforms, the contribution of the Apple mobile platform becomes striking.
Nevertheless, it's still important to understand the role of the Mac. In years gone, the advantage of Windows was measured in multiples of Mac sales. That peak occurred in 2004 when there were 56 times more PCs sold than Macs. At that moment, when the Windows advantage peaked, the Mac sold 3.2 million units into a market where 182 million PCs shipped. This means the Mac had 1.7% market share.
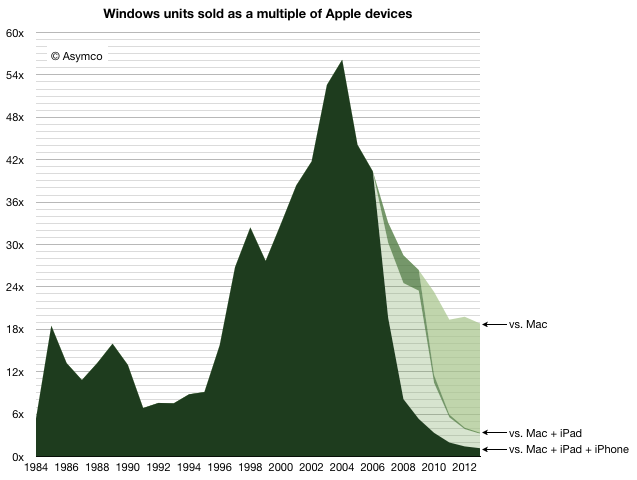
And yet, remarkably, even with 1.7% share, the Mac did not disappear. The figure of 3.2 million units was not great and below the peak to date ((which was 4.5 million in 1996)) but it was enough to sustain Apple while it developed its next products. At the time the iPod was starting to grow rapidly and development on iPhone/iPad was already underway. The point being that there were new products. 3.2 million was a sufficient volume to preserve the company until such time when they would be ready.
Today the situation is quite different. The total number of platform products Apple sold in 2013 was about 260 million ((This includes my estimates for Q4. We'll have the exact figure in a few days.)) The total number of users Apple has is above 550 million. ((Possibly 600 million.))
Note the effect in the graph above. Even if we only consider the Mac, the Windows advantage has decreased considerably, and the platform was certainly not extinguished. The new form factor Mac Pro and the continuing improvements in the thinnest of laptops shows how Mac has not just survived but prospered as the underdog which easily captures the bulk of profits.
But the bigger story is how Apple's mobile platform has nearly reached the sales volume of Windows. In 2013 there were only 1.18 more Windows PCs than Apple devices sold. Odds are that in 2014 they will be at parity. ((The prediction I made in 2012 was that "it’s safe to expect a “parity” of iOS+OS X vs. Windows within one or two years". The data so far does not change this expectation.))
But will it last?
It's important to understand just how the quantities involved here have a quality of their own. The quantities themselves speak of a change. It's not convincing to suggest that what comes around goes around and a reversal of fortune can be reversed yet again when there are several zeros added to the end of the figures involved.
We have to understand that the Windows advantage itself came from the way computing was purchased in the period of its ascent. In the 1980s and 1990s computing platform decisions were made first by companies then by developers and later by individuals who took their cues from what standards were already established. As these decisions created network effects, the cycle repeated and the majority platform strengthened.
But it was the large companies who made the core decisions. In the 1980s if the Fortune 500 companies all standardized on Windows then their suppliers and customers would also standardize on it. Add governments and other institutions and 80% of the market is probably decided. There was concentration in decision making. In other words, in the 80s a platform could win by convincing 500 individuals who had the authority (as CIOs) to impose through fiat a standard on the centers of gravity of purchasing power.
Today, with mobile products there are billions of decision makers. 500 decisions mean nothing. In fact, Apple with at least 500 million loyal and wealthy users is considered to be in a precarious situation. That's partly due to the way other platforms like BlackBerry and Symbian found themselves in crisis with tens of millions of users. ((and hundreds, perhaps thousands, of corporate buyers deciding to support its platform exclusively. What IT does matters for little.))
The decision making process for buying computers, which began with large companies IT departments making decisions with multi-year horizons, has changed to billions of individuals making decisions with no horizons. Companies have become the laggards and individuals the early adopters of technology.
The fundamental shift is therefore in the quantity of decision makers and the quality of those decisions. Those who buy are also those who use and their decisions will be perhaps whimsical, maybe impulsive and not calculated, but fundamentally, in the aggregate, wise.
Ultimately, it was the removal of the intermediary between buyer and beneficiary which dissolved Microsoft's power over the purchase decision. It's not just unlikely that this situation will be reversed, it's impossible. Computing decision making has moved to the furthest edge where use has been for decades. The computer has become personal not just in the sense of how it's used but in the sense of how it's owned.
Horace and Jim discuss shopping online for used cars and how and why the value of cars disappears so quickly. The conversation drifts into information asymmetry, the declining interest in auto maintenance and the perpetual closed-loop auto information model. We hypothesize on the impact of the coming self-monitoring and awareness of the lives of vehicles. Finally we ask whether the dysfunction in the industry is the cause or the effect of the ancient integrated factory model and the sustaining auto eco-system incentives that impede transformation.
Asymcar 9. Stasis: Depreciation, Brands, Information Intransigence | Asymcar.
Research #Market · 89 comments
Exactly one year ago, on January 7th, 2013, Apple announced that the App Store reached 40 billion downloads ((Unique downloads excluding re-downloads and updated)). Here are additional data points from that release:
This year, on January 7th, 2014, Apple announced a new set of data points:
The obvious:
The less obvious:
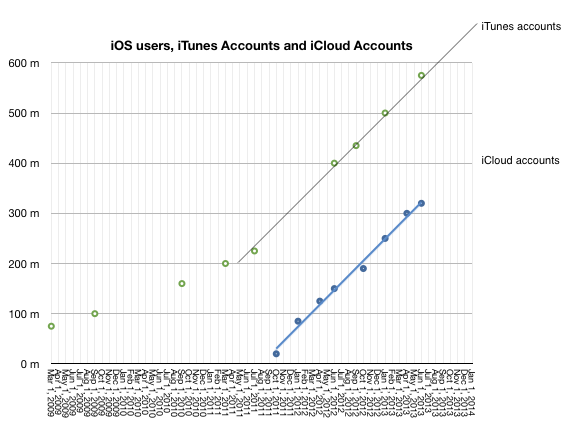
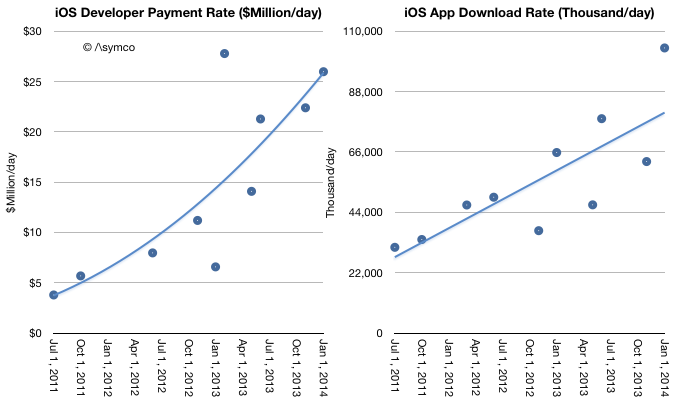
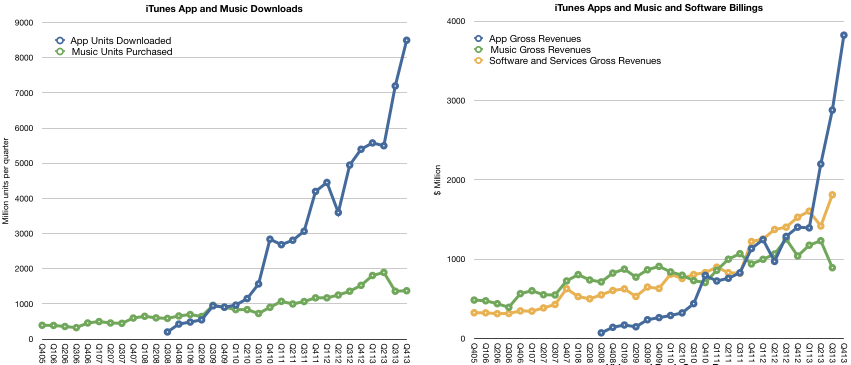
So much for the data. What is really happening?
First, it's tempting to look at music and suggest that music downloads are suffering from streaming, just as it was tempting to suggest that CD buying was suffering from piracy (and later, downloads.) But this is falling into the trap of defining a product's use by the metrics used to measure transactions. These metrics are but a proxy for what consumers are actually doing with their time.
Consumers have a fixed time budget, a more rigid constraint than their spending budget. Competition for a slice of a consumer's time budget is far tougher than competition for a slice of a consumer's wallet. So what's amazing is that apps have successfully grabbed a share of this time budget. I believe that the reason they succeeded is that they initially fit into niche time slices that were previously unoccupied. ((Interestingly, this was how music, especially digital music as enabled by the iPod, gained traction))
Downtime or "boredom" was filled with app interaction. This includes some social media consumption. These are not immersive experiences. They are "casual", inconsequential and trivial. At first anyway. And that's the rub. As apps enter a consumer's world they initially take on non-consumption, which is easy to beat. But as the experiences become increasingly compelling they "move upmarket" and compete more aggressively with existing media consumption patterns.
For instance, one might allow casual gaming to take root in non-consuming contexts such as commuting, waiting, and escaping time niches. But if the experience becomes addictive, the gaming takes over time previously spent watching TV or using console games. The same can be observed for app-based experiences of social media, shopping and chatting.
This is the insidious march of a disruptor. It gains a foothold in a context where it has no competition and then relentlessly gets better, eventually displacing the far better suited alternatives. This is what I believe is happening with apps. They are asymmetric in their competition with established media and as a result they are easily ignored and brushed off as irrelevant competition. That is until the incumbent media sees a sudden drop in consumption. Even then, the culprit blamed is not the upstart but some structural issue.
Music would appear less vulnerable to this app-based substitution because it's an eyes-free experience and can be easily consumed concurrent with another activity. There is however, a subtle de-emphasis and hence devaluation of the experience as it fades into the background. The "job it's hired to do" changes.
Second, and relatedly, the other meta-observation is that apps are media. They are produced, marketed and priced in ways analogous to other media types. This has implications for the artist/producer/creator. For them movement into apps is natural and effortless. It's how developers moved into them without thinking twice. Trouble is that this transition is not at all simple for those who distribute media.
I tweeted that the media industry deplored the shift of "digital pennies for analog dollars" ((Original quote was made by Jeff Zucker, president of NBC Universal, in 2008 in reference to the future of TV)) as the packaging of their product changed. The angst and trauma suffered by the media industry when dealing with what could be seen as a trivial change in the encoding of content are the stuff of lore and legend. Moving to apps could be even more troubling. Mainly because there is already a distribution channel in place. And it's owned by a set of companies whose motives and business models are completely different.
The app economy shows that there are big opportunities in "digital pennies" and that the figures are beginning to match even the "analog dollars". In fact, I suspect eventually digital pennies will dwarf analog dollars. The trouble is that these pennies will not be earned at the same control points. Bits are already big bucks. They're just not the bits we are used to.
Research #Industry · 43 comments
GSMA Intelligence reports provide valuable statistics on the growth of mobile networks. One in particular shows the history of regional smartphone penetration.
I took the historic data and plotted it as follows:
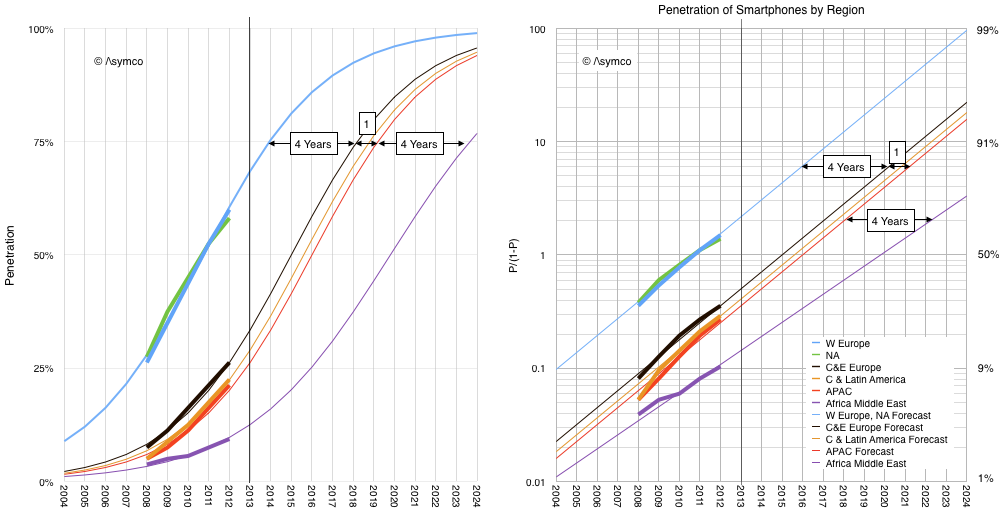
Note that I chose to model using the same logistic function that I have used to describe the US market (as measured by comScore) and the global Internet user market (as measured by the ITU) and the stove, landline phone, Electricity, automobile, consumer radios, washing machines, refrigerators, TVs, dryers, air conditioning, dishwashers, microwaves, VCRs, PCs, cellphones.
It's also the same model used to show the rise and fall of energy sources, canals, railroads, roads and air travel.
If we believe that smartphones in parts other than US and Europe will behave the same way as all the other technologies listed above then the forecast penetration is likely to follow the thin lines in the graphs above. ((This is a big if, and, judging by their forecast, one which the GSMA Intelligence team seems not to believe will happen.))
With the exception of Africa and Middle East, note that the primary difference between regions is not the rate of growth in penetration but rather the delay in adoption. I marked this delay as 4 years between US/EU and Central & Eastern Europe. An additional one year delay to Asia Pacific region and 4 years more to Africa/Middle East adoption.
The resulting smartphone user forecast is shown below.
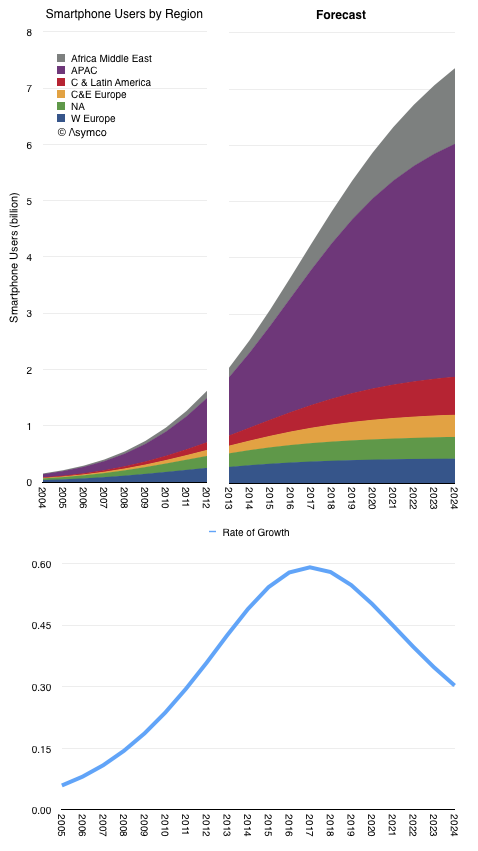
Although 2013 was often cited as the year when smartphones saturated ("everybody that wants one has one"), the total population of users will likely take another decade to reach maximum. The point of inflection in global growth could be expected in 2017.
What most observers sensed was the point of inflection in growth in North America and Western Europe. Those regions are 11% of the world's population.
With new ChromeOS and Chromebook data, Horace returns us to the topic of Google. How do they define and view their customers, products, and businesses? Who actually serves whom? What user data is collected, how is it used, and why?
Research #Industry · 56 comments
According to ITU data, Internet usage reached about 2.2% penetration in the US (2.2 users per 100 residents) in 1993. The figure in 2012 was 81%. The history of penetration is shown in the following graphs.
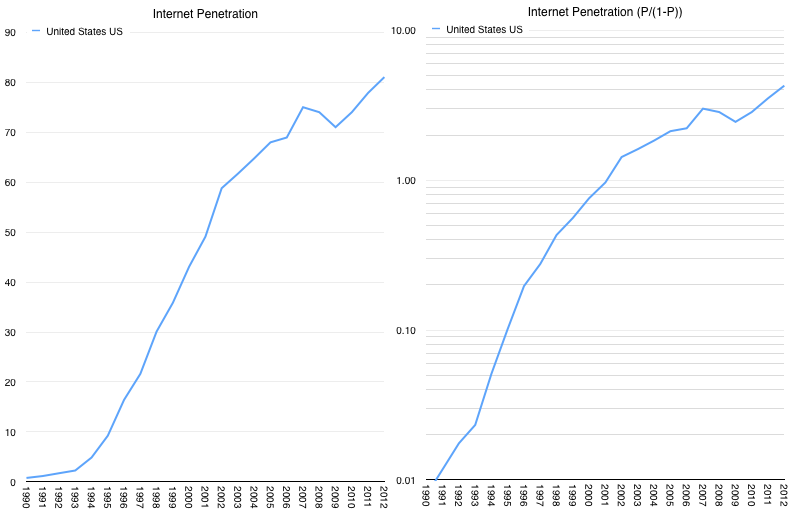
Similar graphs can be drawn for other countries (data is available for 193 countries/territories.) I chose the following set of countries arbitrarily:
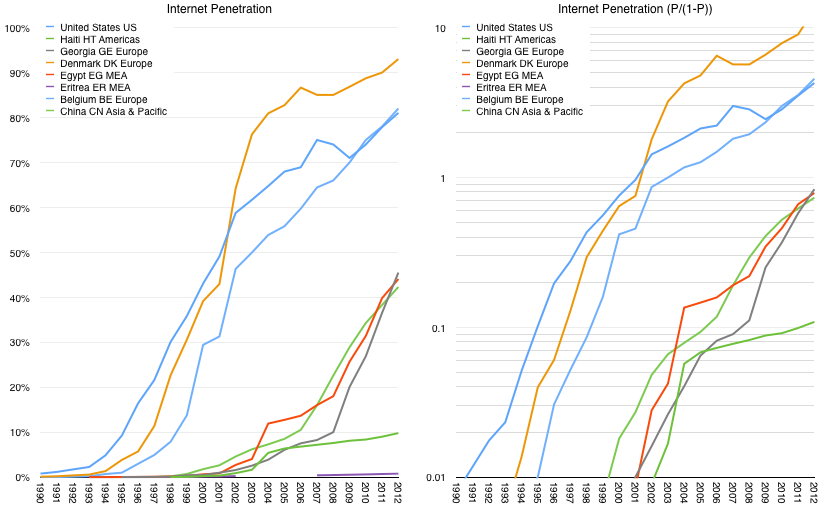
When looking at all countries, the patterns are fairly self-evident. They nearly all behave the same way with respect to the impulse to move online. The pattern is approximately logistic (observed as linearity in the right-side graphs). ((Those that don't are anomalies which should be inspected individually and might provide insights into the constraints for systemic state health.)) The main difference is one of timing.
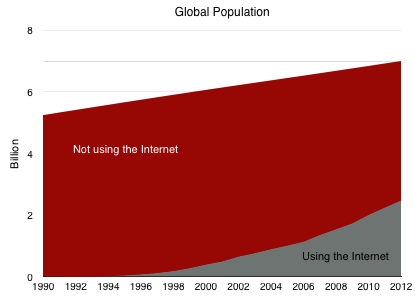
The global picture should therefore not be surprising. In absolute terms, the penetration was 35% at the end of 2012 or 2.5 billion individuals. The graph of global population divided into Internet consumers and Internet non-consumers is shown below followed by penetration.
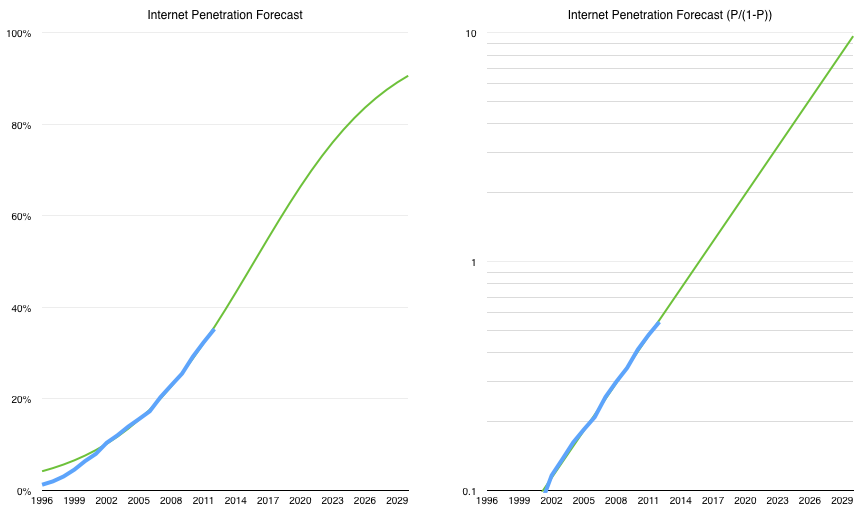
The linearity in the blue line above is consistent after 9% penetration is reached (P/(1-P) ~= 0.1) suggesting logistic growth (far more smoothly than individual country data). Note that I also took the step of projecting the logistic curve that describes the internet's growth forward a few years.
Based on this history, it becomes possible to project that 2013 penetration reached around 39% or 2.78 billion individual users.
It also suggests that "saturation" could come between 2030 and 2035. ((The curve is defined as having a half-period of 19.7 years from 1996))
If we look at growth, ((Derivative of logistic curve)) the inflection point comes in 2016. Thereafter internet user growth will slow.
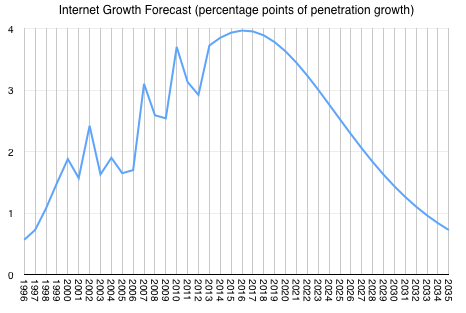
Overall, the growth pulse of the Internet will be approximately 40 years long. ((More likely 35 years as saturation dynamics will be erratic.)) We are therefore nearly half-way through.
It might seem an interesting but benign fact, however I must caution that as we've seen with smartphones, once the point of inflection is reached, investors tend to flee the sector. That in itself may not be a bad thing but investment flight has deep effects on "ecosystem" participants.
Venture investments tend to feed entrants disproportionately and they are remarkably sensitive to the valuations of public companies (and IPOs). These investment might therefore be in danger in two years. Plan accordingly.
Research #Industry · 8 comments
ניהול אחר אפל: צבא התפוחים הסודי.
An article by Dor Zach, correspondent at Calcalist, the largest economic newspaper in Israel.
I offered some thoughts on Apple's current strategy, and the various misconceptions about the company.
(Hebrew only so if anyone wishes to summarize it in comments, it would be helpful to others).
Research #Industry · 38 comments
"BEIJING and CUPERTINO, California—December 22, 2013—Apple® and China Mobile today announced they have entered into a multi-year agreement to bring iPhone® to the world's largest mobile network. As part of the agreement, iPhone 5s and iPhone 5c will be available from China Mobile's expansive network of retail stores as well as Apple retail stores across mainland China beginning on Friday, January 17, 2014.
January 17 seems to be an auspicious date. ((January 17 is a lucky day in Chinese numerology: 1+7=8 is a multiple of number 8, which is the most auspicious number. Joe Zou @zzbar via Twitter))
Precisely a year prior to that date, on January 17, 2013, I wrote The iPhone MOQ.
Within that post I showed the activation rates for US operators as a percent of total users. Figures ranged from 10% to 19% by year or operators. I further assumed the figures would be toward the high end of that in Japan based on statements by the president of NTT DoCoMo.
The last phrase I used was:
"The MOQ figure as percent of subs for China Mobile would also be an interesting point of debate."
My assumption would be that CM would start at a base significantly lower than the US or Japan. I would not be surprised to see an MOQ of 4% of user base for 2014. In the press release above China Mobile states that they serve 760 million customers. That implies a minimum order of about 30 million iPhones.
In the absence of any other data it's best to be conservative.