The Transportationist, David Levinson @trnsprttnst joins us to discuss the technical, human, environmental and economic factors driving change to the auto-ecosystem.David helps us smartly survey the landscape via:
I've been writing about Apple's capital intensive operations for some time. The difficulty has always been in explaining the scale involved. I've compared the spending to that of Samsung, Microsoft, Google, Intel and Amazon. But these numbers still can't be easily grasped. You can't point to any comparable objects when you try to explain the figure. I struggle to create a less abstract notion than that of a "sea of tooling and servers."
Instead, I've used the analogy of US aircraft carriers. Historically, Nimitz class aircraft carriers have cost a less than $5 billion. The USS Ronald Reagan, christened in 2001, cost $4.5 billion. Therefore I was comfortable saying that Apple spends the equivalent of about one Nimitz class aircraft carrier every six months (and that the Navy takes about six years to put it together.)
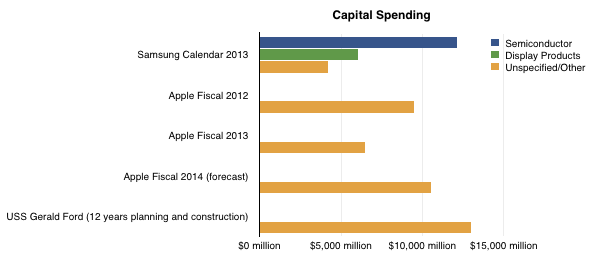
Unfortunately, costs for aircraft carriers have gone up. The USS Gerald Ford will take about $13 billion to complete. That places Apple and Samsung capital spending in the following context:
Note however that planning and construction for the latest aircraft carrier takes 12 years, rather than the 12 months spending schedule for the companies shown. Note also that Apple's spending is unspecified and included several categories while Samsung's categories are partially specified.
Due to this inflation in aircraft carrier costs, my denomination of capex is beginning to be strained. Nevertheless, the question of what Apple spends $10 billion a year remains knowing what that could buy the Navy (or Samsung.)
Apple has sold 700 million iOS devices. Google claims one billion Android device activations. Microsoft has about 1.5 billion Windows users and Facebook about 1.19 billion. LinkedIn has 259 million users and Twitter has 232 million. Amazon has 215 active account holders and PayPal 137 million.
Markets place a value on these users implicitly when company shares are priced. For example, Twitter whose users are worth about $110 or FaceBook's $98 and LinkedIn at $93.
This consistency suggests a universally accepted value per social media user but what is the value of an ecosystem user? Apple, Google, Microsoft and even Amazon aspire to enable ecosystems which should be seen are more valuable than mere communities. Ecosystems enable a higher level of economic activity because they are unbounded by the medium itself. Any number of media can be created. Or so the theory goes.
If we could determine a value for an ecosystem user we could test it against the going value of a social media user. Fortunately we have enough data to do so.
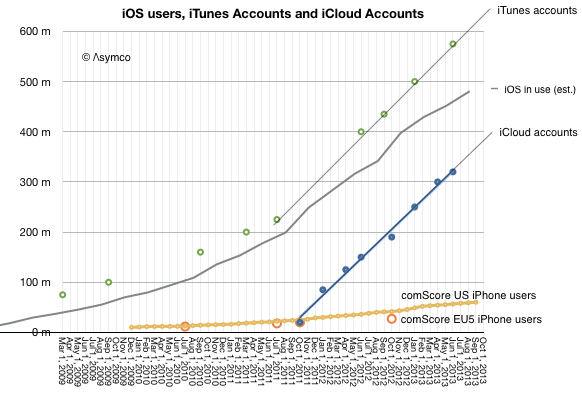
The total number of iOS devices sold per quarter allows us to measure the install base of device users. With some assumptions regarding the retirement and attrition rate we can get the following history:
Since the total number of iTunes accounts is updated with some regularity I've added it to the graph. I've also shown on the same graph the total number of iCloud accounts. For calibration, I included survey data showing the number of iPhone users in two regions (US and EU5).
These combined graphs give us an upper bound of active users (iTunes accounts) and a lower bound (iCloud) calibrating our device-based estimate. The regional iPhone data offers some additional test on growth.
The result is "about 500 million" ((482 million by my count but with quite a bit of margin of error)) with a growth of about 11 million per month.
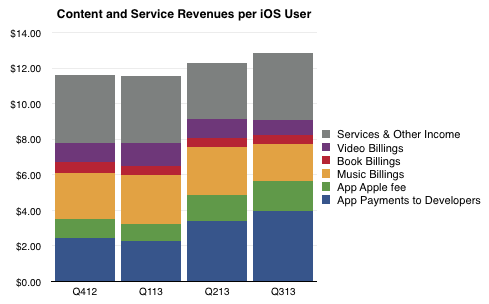
So if we know with some confidence that there are about 500 million active users as part of the iOS ecosystem, how do we know how much value they generate? The answer is in the consolidated iTunes revenues as reported by Apple: $4.26 billion/quarter. With some attention to the reported media retail and purchases, the following picture of the average iOS user's quarterly spending emerges:
The bottom line is that in the last 12 months the average iOS user contributed about $48/yr to the ecosystem via Apple's own properties. They also bought the device and paid for cellular service in most cases. They may also have engaged in quite a bit of browsing and online purchases which fed other ecosystems. But as far as Apple is concerned, it transacted about $48 per user.
As Twitter revenues last year were $317 million, the Twitter user today generates about $1.36 of revenue per year or one thirty-fifth of what an iOS user generates through iTunes and iCloud alone. And note that the number of iOS users is about twice that of Twitter.
Of course one could argue that the iOS user's participation is not profitable for Apple. It does obtain massive cash flow from iTunes which finances its fashionable data centers and bandwidth but it does not presume to value itself primarily through this revenue.
Or at least the market doesn't think so. We don't hear much about how Apple is worth so many dollars per user. ((I suppose the corollary to this is that Apple users are disloyal or fickle or fleeting, and quite contrary to observed behavior.))
The paradox is that while the device which enables this commerce is where Apple guides the consumer's perception of value, markets discount devices and bid up services. In other words, users continue to pay for the devices which delight them enough to participate in services (especially the monthly billable kind) but markets walk right by these shiny baubles and and shower money on services which have negligible sales and even fewer profits. There must be some serious misdirection going on here. The question is who's being fooled.
The closing of one and the onset of another era. In this hundredth episode of The Critical Path we look back to some of the big questions we asked and ask them again with hindsight and foresight. They are:
What happens to entertainment in the era of pervasive connectivity and computing?
What happens to privacy when citizenship requires divulging all your secrets to commercial entities?
What happens to the structure of computing when diffusions of innovations are instantly global?
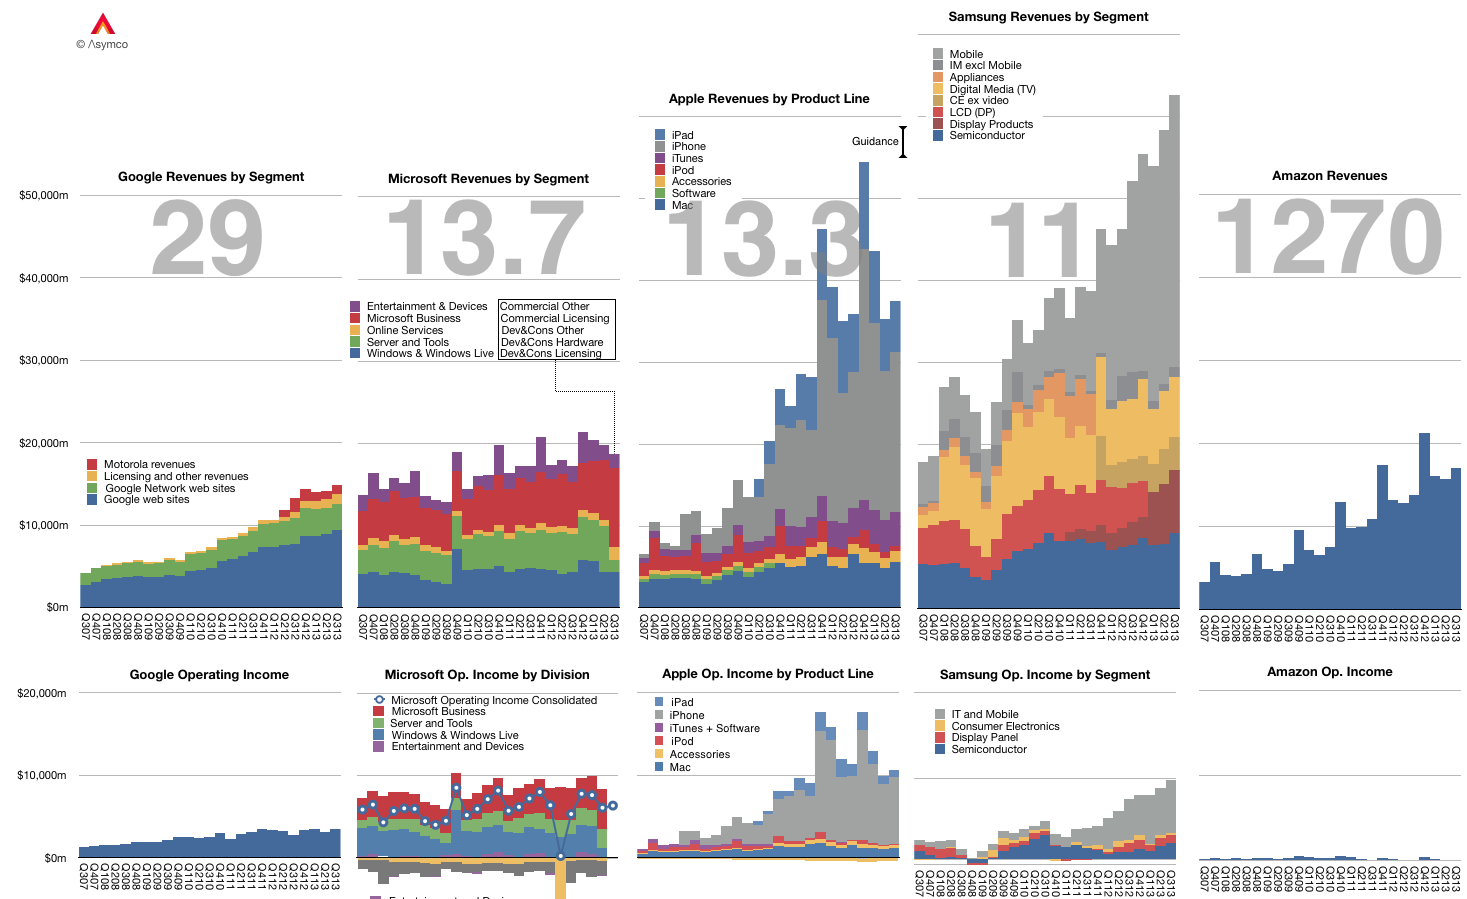
The graph below shows the Revenue and Operating Income for a select group of companies. The large numbers represent the share price to earnings (trailing twelve months) ratio (P/E or PE ratio).
Of course the P/E ratio hides a lot of subtlety. It mostly fails to account for the fact that earnings are largely a matter of opinion. A company can defer income (as Apple and Microsoft do), it can invest earnings (as Amazon does) and can otherwise avoid declaring it since it's taxable.
A better measure is the Enterprise Value to Free Cash Flow ratio (EV/FCF). It reflects a "harder" measure of performance in the form of free cash flow. It is not a matter of opinion but a fact. Enterprise Value also excludes cash which is a measure of past performance.
Nominally both P/E and EV/FCF measure the valuation of a company. They give what amounts to the number of years that current performance can be expected to last. For example a P/E or EV/FCF of 10 can be read as "If I purchase a share today, I should expect the company to pay me back in earnings in 10 years." Any earnings after 10 years are essentially "profit" for the investor.
Inverted these ratios are a measure of Yield or how much of the total investment is paid back in a given year. In the example above, the Yield would be 10% or "If I purchase a share today, the company will pay me back 10% a year in earnings."
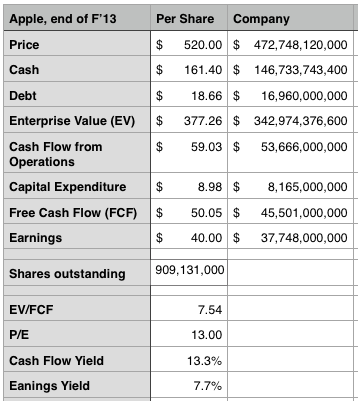
Relying on P/E is troublesome since, as mentioned above, it's deceptive. We get into difficulty when P/E and EV/FCF differ greatly. If a company has minimal cash and declares all free cash flow as earnings then the ratios are the same. However, consider how different these two ratios are for Apple:
The P/E ratio is 13 while the EV/FCF is 7.5. ((It would be very interesting to have both ratios available for all the companies in the graph above.))
This means the investment horizon is nearly half of what P/E suggests. (The cash flow yield should give pause). Put another way, the market suggests that Apple has 7 more years of current profitability and not 13. Note that the P/E ratio for the S&P 500 is above 19.
As Apple's deferrals are increasing investors should look again at what the company's worth. We had similar confusion when the company was deferring most of its iPhone revenue.
All theoretical and empirical diffusion studies agree that an innovation diffuses along a S-shaped trajectory. Indeed, the S-shaped pattern of diffusion appears to be a basic anthropologic phenomenon.
This observation dates as far back as 1895 when the French sociologist Gabriel Tarde first described the process of social change by an imitative "group-think" mechanism and a S-shaped pattern. ((Tarde was probably influenced by mathematician Pierre François Verhulst who first published the logistic function in 1845)) In 1983 Everett Rogers, developed a more complete four stage model of the innovation decision process consisting of: (1) knowledge, (2) persuasion, (3) decision and implementation, and (4) confirmation.
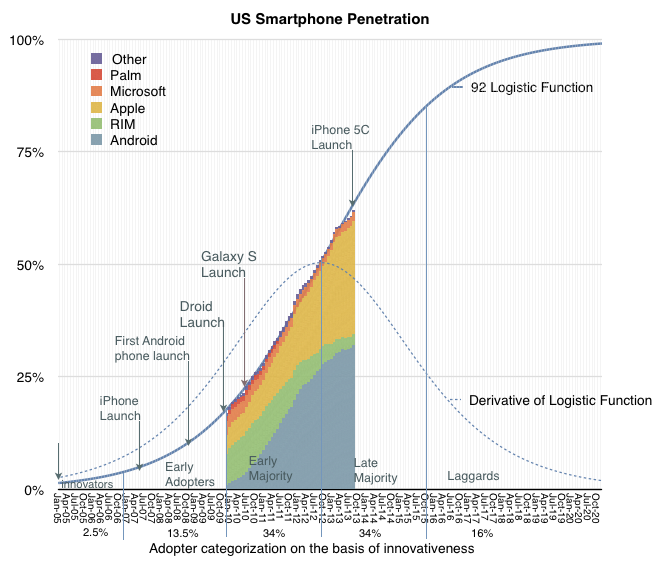
Consequently, Rogers divided the population of potential adopters according to their adoption date and categorized them in terms of their standard deviation from the mean adoption date. He presented extensive empirical evidence to suggest a symmetric bell shaped curve for the distribution of adopters over time. This curve matches in shape the first derivative of the logistic growth and substitution curve as shown below.
In the graph above I applied the Rogers adopter characterization to the data we have on the adoption of smartphones in the US. The latest data covering September is included.
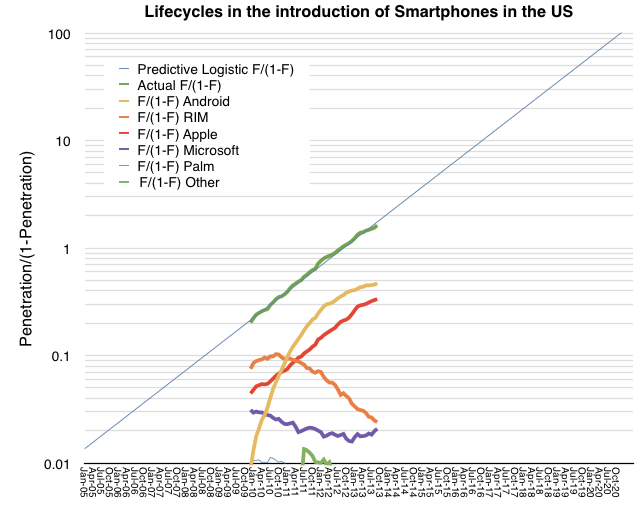
The fact that smartphones in the US follow the theory is exciting, but what can we conclude about the adoption of specific platforms? There has been quite a bit of turnover in the leadership of the market in the first half of the time frame given. You can see this more clearly in the following fractional market share transformation.
Note that, with the exception of the iPhone, if each platform is studied individually, it would not follow a logistic (i.e. linear) pattern even though, as a whole, the technology does.
This then is the big puzzle: while we might be able to predict how smartphones will diffuse into society, we can't seem to predict how any single firm will fare. This means that an investor cannot make a credible "bet" on the technology ((Indeed investors often get burned when new technologies emerge. While the technology booms, individual firms supplying it often fail. See the history of transportation, communication, computing and energy.)). If they choose a single company as proxy, chances are they will lose. If they bet on a basket of companies then, again, chances are they will lose. There is usually one unforeseeably clear winner.
Before we get further into the question of picking winners or predicting the future division of share among rivals, we should understand the underlying causes for this pattern of adoption.
Rogers concluded that the learning behavior of individuals is the underlying cause of the symmetry of the diffusion process.
At the beginning, when an individual is confronted with a new (learning) situation they make many mistakes. These mistakes are gradually reduced (by learning) over time because more and more information is received and acts as a stimulus. The gain in learning per trial is proportional to the product of the amount already learned and the amount remaining to be learned before the limit of learning is reached.
Arnulf Grübler ((The Rise and Fall of Infrastructures, Physica-Verlag 1990)) explains:
This is exactly equivalent to the F(1-F) transformation of the logistic curve. It should be emphasized that these properties of the learning process were found in real learning situations and are confirmed by a large number of laboratory and field experiments. Thus each adoption of an innovation in a social system is equivalent to a learning trial by an individual. Thus, the symmetric diffusion pattern results from the way messages about an innovation are emitted and processed by social learning.
So these observers of the process assign learning behavior as the cause for adoption of a technology. Can the learning behavior be applied to individual platforms? It's tempting.
The hypothesis would go as follows: adopters are not only processing messages about the new technology but they are also trying different platforms as they enter and as they upgrade their phones. If we see platform choice as a learning process then if one platform has a natural advantage, it settles into a dominant position as users "learn" of its advantage. Conversely, if no platform has an advantage then platform "churn" repeats as rivals gain/lose positions of leverage in the market.
The pattern shown so far seems to point to Apple's iPhone having a logistic pattern indicating that it might be benefiting from a learning pattern. The alternative platforms may simply be jockeying for temporary advantage.
It's an interesting hypothesis. To be developed further we need to answer what any learnable advantage might be. I suspect it has to do with the ability to solve unmet and unarticulated needs. In other words, that the winning product solves a set of "jobs to be done" which are difficult to pin down and are perceived rather than defined.
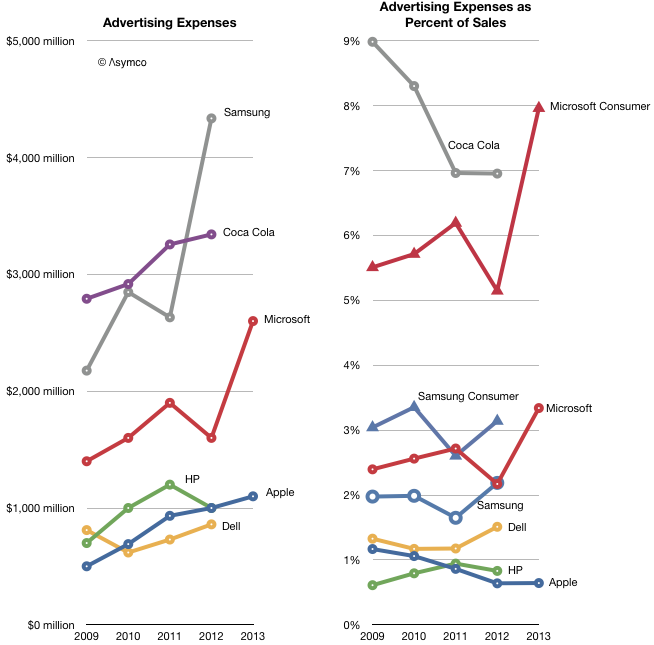
Microsoft spent $2.6 billion for Advertising in the fiscal year ended June. Apple spent $1.1 billion in its fiscal year ended October.
Other companies will report their full year ad spending later but their previous years' spending is shown below.
I added a second graph showing the percent of sales that each ad budget represents. Note that Coca Cola retains the crown as the most prolific advertiser when it comes to budgeting. ((Think of it as 7 percent of every Coke purchase going to pay for the ad that presumably got you to buy it.))
However, Microsoft is climbing into a region of 3 to 5% of sales. What's even more striking is that we can isolate the revenues which are actually being targeted by the ads: consumers. Microsoft's Business and Server and Tools divisions may have some ad budget but it's likely to be much smaller than the Windows, Entertainment and Online divisions.
When the ad budget is measured as a percent of consumer sales, Microsoft suddenly looks like the biggest spender overtaking even Coca-Cola. ((Note that Samsung can also be similarly split into consumer vs. total.)) I don't know what to make of this. It seems extraordinary that Microsoft needs the same level of effort to sell software (and some hardware) as Coca Cola does to sell soft drinks. Coca Cola spends heavily to preserve brand value for what is essentially a commodity product. Is this the way to read Microsoft's marketing?
It's also interesting that Apple spends the least (nearly) in absolute terms and fractionally less (one twelfth) in relative terms. This is in contrast to the alternatives above. The stronger, more differentiated the product, the less it needs to be propped up by the ad.
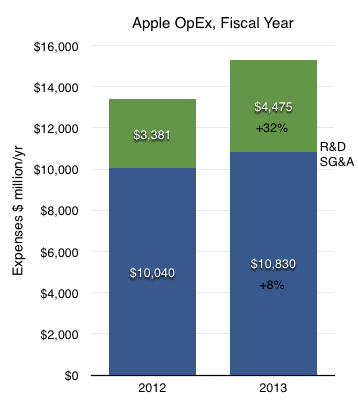
For the year ending October Apple's R&D costs were $4.475 billion. These costs have been rising. Though, as the company explains, not faster than net sales:
The growth in R&D expense was driven by an increase in headcount and related expenses to support expanded R&D activities. Although total R&D expense increased 32% and 39% in 2013 and 2012, respectively, it remained fairly consistent as a percentage of net sales.
[My emphasis]
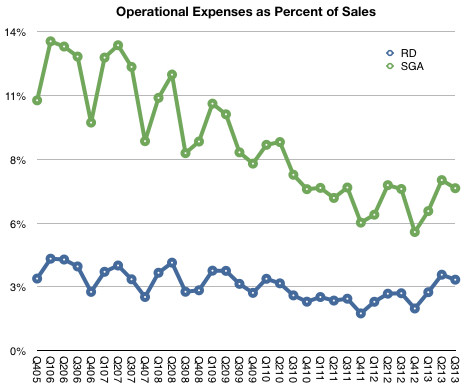
We can see this in the following graph:
R&D has remained very nearly 3% of sales since at least 2005.
SG&A Expenses barely grew however:
The growth in SG&A during 2013 was primarily due to the Company’s continued expansion of its Retail segment and increased headcount and related expenses, partially offset by decreased spending on professional services.
The change in R&D and SG&A on a full-year basis is shown below.
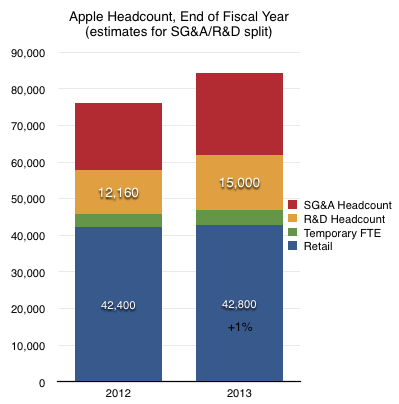
I emphasized the mention of increases in headcount. We cannot know with any precision what portion of last year's $15 billion in operating expenses went toward wage expenses since there are other costs such as advertising ((Apple's advertising expenditures for fiscal 2013 were $1.1 billion or 10% of SG&A or 0.64% of sales.)) commissions and public relations in the case of SG&A and outside services, equipment leases, in the case of R&D. However, it's more likely that wage expenses are a far larger proportion of total R&D than they are of SG&A.
My estimate, based on wage rates, is that there are approximately 15,000 R&D staff at Apple.
If we divide sales by this number we get $11.4 million in sales per engineer.
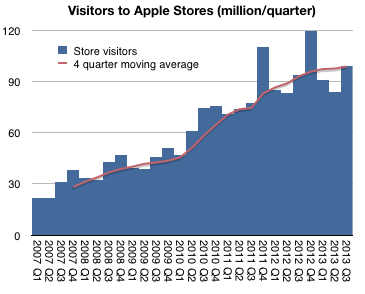
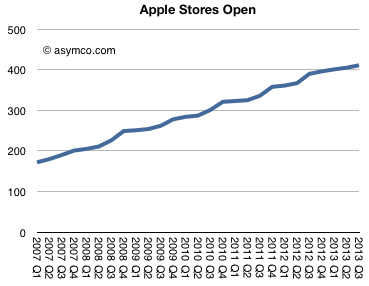
In fiscal 2013 there were 395 million visits to Apple retail stores. In 2012 there were 372 million.
The difference is approximately the population of Australia. This was in addition to the population of the US and Canada already passing through. Although this is a fun way to think about total traffic, it does not reflect performance of the stores themselves since new stores are always being opened. 21 new stores in 2013, to be precise.
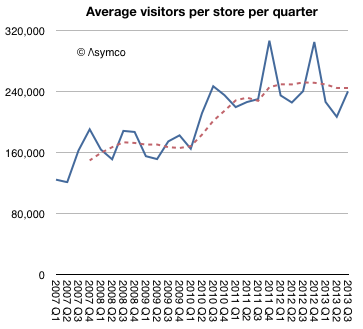
The better benchmark should be the number of visitors per store.
This shows that, except for seasonal peaks, the visitors per store per quarter has been a fairly steady 240k since mid-2010. What's more, this rate was also remarkably steady at around 160k/store/quarter from 2007 to 2010.
So what caused this quantum jump (("Quantum leap" is often used to mean "giant leap" but in the original usage it meant a specific, discrete jump)) in traffic? Was it due to a re-design of the stores? Was it a change in product mix? Or was it due to a change in staffing rules?
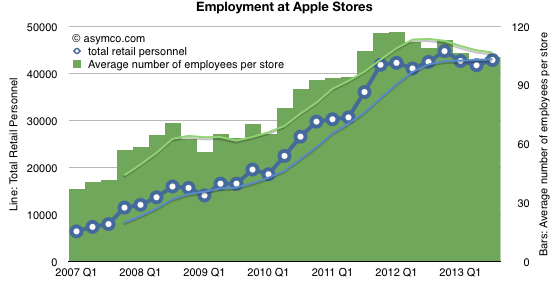
I think we can rule out staffing changes. The data shows that staffing ramps with visitors and there was no specific "quantum" increase in employment (on a per-store basis or otherwise).
Re-design as a cause has some more merit. On one hand, we have seen bigger stores opening and many more flagship stores. We have also seen specific renovations of existing stores. We have also seen re-designs where the layout was changed to allow for more traffic. The only problem with this as a cause for the quantum leap is that these changes are constantly under-way and have been for some time. It's hard to point to a specific "big bang" redesign across the board in early 2010 as possibly a cause.
That leaves product. Here we have a clear suspect. The iPad launched exactly at the point in time when the visitor count leaped. In my opinion this is the best explanation.
Let's remember also the comment from Ron Johnson at the time of the iPad launch. He said that it was as if the stores were designed for a product like the iPad. In other words, the iPad is something that needs to be discovered with a retail experience. You can sense this when you visit the stores and the placement of the iPads within.
It all points to a something more profound: that the stores are brand ambassadors. Apple products create a purchase decision by speaking directly to the users. For the type of product Apple makes, that conversation can only happen face-to-face. The place where this meeting happens is the store.
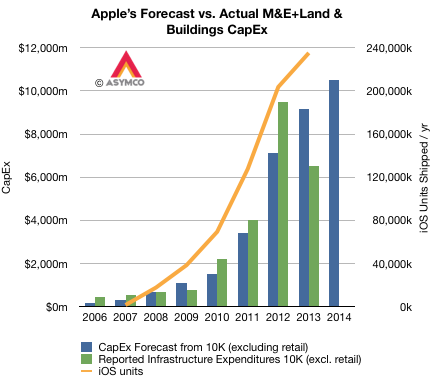
Apple's capital expenditures for product tooling, manufacturing process equipment, corporate facilities and infrastructure has followed very closely their production of iOS devices. The pattern is shown in the graph below.
Note that although reported expenditures did not match forecasts for 2012 and 2013, the differences nearly cancel each other. ((I suspect that the difference might be caused by a payment being brought forward in 2012.)) The company's forecast for fiscal 2014 is shown as well.
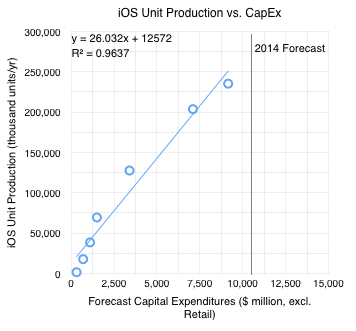
The orange line shows iOS unit production ((Technically, shipments)) with the scale on the right-side axis. Note the correlation with forecasts on CapEx. The relationship can be seen more clearly in the following scatter plot.
I added the 2014 Forecast ($10.5 billion from the latest 10-K filing). If the relationship holds into next year then the iOS unit shipments should be between 250 million and 285 million. ((The equation for the trend line shown suggests 285,908,000 units)).
Horace Dediu joins us for a discussion about the history of the space industry and its more recent commercial direction. We touch on the history of governmental and private investments in space as well as possible asymmetric strategies for the future including a railgun and the ever elusive space elevator. Does the commercial exploitation of space fit within a timescale business is able to accept?