Apple Success All About Customer Loyalty: Dediu: Video - Bloomberg
My brief appearance on Bloomberg Surveillance last week:
Apple Success All About Customer Loyalty: Dediu: Video - Bloomberg.
My brief appearance on Bloomberg Surveillance last week:
Apple Success All About Customer Loyalty: Dediu: Video - Bloomberg.
Research #Technology · 18 comments
My appearance on Bloomberg West using an iPad to illustrate what it takes to make an iPad.
The Numbers Behind the Apple vs. Samsung Rivalry: Video - Bloomberg.
A history of retail as a series of innovations in transportation. How to think about Amazon in a continuum of changing consumer behavior. The source of Amazon's market power and its hypothetical disruption. What would Amazon do and not do to improve its business.
via 5by5 | The Critical Path #103: The Amazon Electric Car.
(Note: This recording took place a few days before Amazon announced the drone-based Prime Air prototype service.)
A history of Cinema as seen through disruptive lenses. How did the medium evolve from novelty to experimentation to establishment of a predominant business model to concentration of power, regulation and ultimate stagnation. How to measure "performance" of a medium via the median age of the audience and how that affects the advertiser's calculus.
via 5by5 | The Critical Path #102: The Advertiser's Dilemma.
Research #Market · 129 comments
IBM Digital Analytics Benchmark (report is here) has published, for the fourth year in a row, US online shopping traffic data with a split between mobile and fixed online traffic. It reveals a pattern of consumer behavior which is quite startling: people seem to prefer to shop using mobile devices.
The data is shown below:
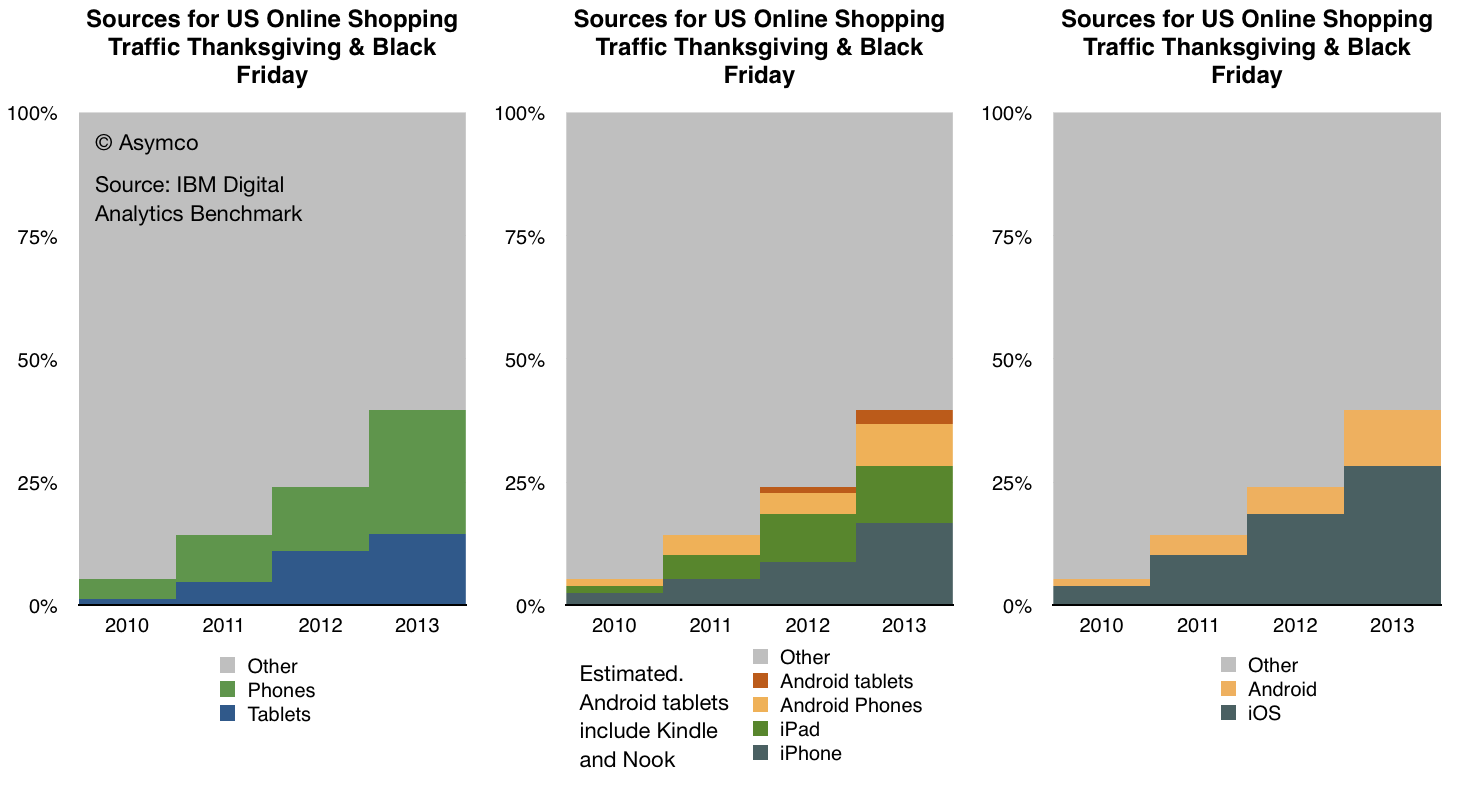
In terms of sources of traffic, mobile devices (including tablets) have increased from about 5% of all online traffic to 40% in four years. Last year the volume was 24% implying that 16 points of share were gained in one year. If that is extrapolated to next year then more than half of holiday shopping traffic in 2014 will be on mobile devices.
Put another way, next year less than half of users will hire a PC for the job of online shopping.
If this conversion from PC-based shopping to device-based shopping follows a logistic substitution curve then the conversion to devices will probably be 90% complete in another 5 years or by 2018 or 2019. I see no reason why this particular job to be done (shopping) should not be considered a proxy for other jobs as well. Therefore it's not a stretch to imagine that the transition to post-PC consumption will also be practically completed by 2020.
Within the data there is also a significant amount of detail beyond the mobile/non-mobile split in behavior. There is a distinction drawn between tablet and phone traffic and a further distinction between Android and iOS devices. ((The split between Android and iOS for tablets and phones was not published for 2013 but I extrapolated from previous years and assumed that 80% of tablet traffic was sourced from iPads vs 88% in 2012 and 99% in 2011. Note also that non-iPad traffic is assumed to be Android but that includes the Kindle and Nook products which are using partial and unsanctioned versions of Google's Android.))
This more detailed view of the traffic is shown in the following diagram:
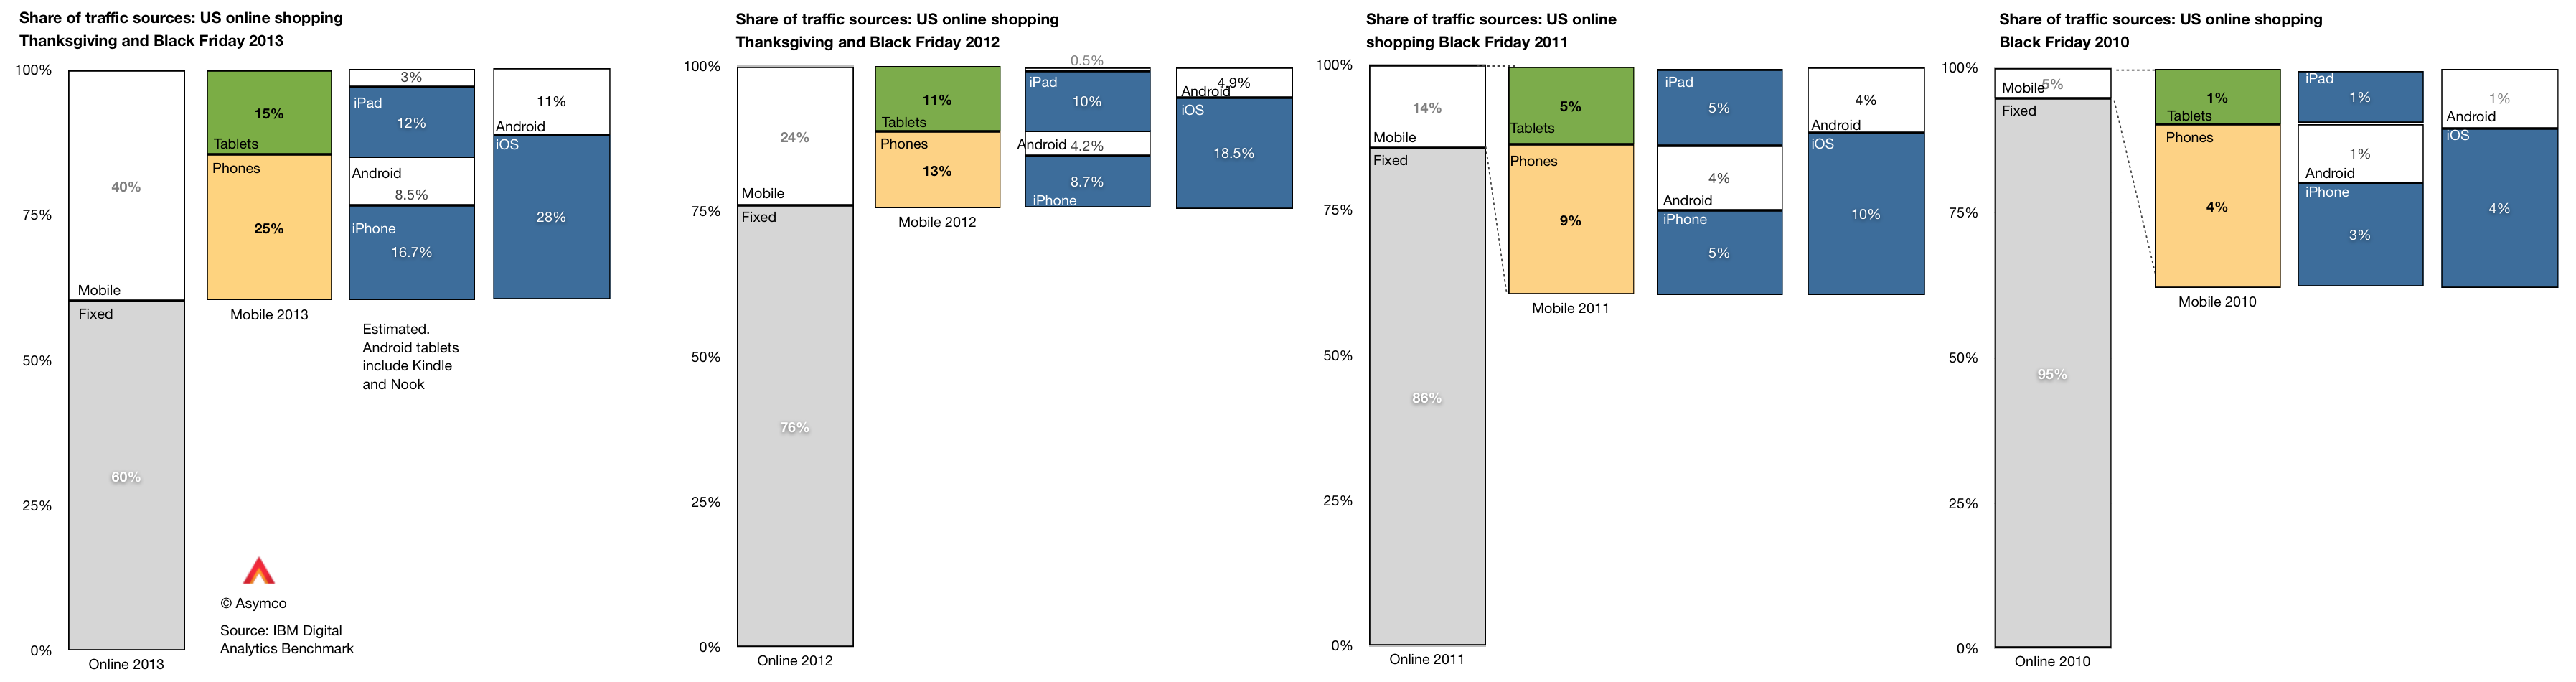
A few observations:
As we also know the approximate number of phone users for each platform (via comScore) then we can also determine the per user contribution of traffic of each platform. ((Note that this is phones only.))
The measure is "basis points of traffic per million users" and it is the result of taking the traffic data (in percent of total online traffic) and dividing by the population of users of a particular platform. The result is shown below:
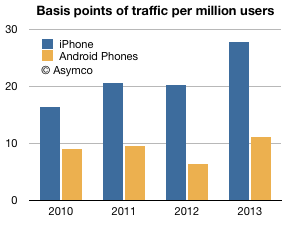
The way to read it would be that each million iPhone users generated about 28 basis points of traffic while each million Android users generated about 11 basis points of traffic.
A way to compare these audiences would be to define the ratio between traffic usage by platform user. That ratio was
So, as far as phones are concerned, US iPhone users are about 2.5 times more likely to shop online than US Android phone users. The data is reliable: with the US population now over 65% penetrated with smartphones, these populations of users (totaling over 130 million) are vast and representative. As the technology is reaching deep into the late adopter segments the difference in behavior between iOS and Android usage is becoming easier to explain. We have to eliminate quirks of demographics or income or other possible causes.
The platforms themselves are becoming the last remaining suspects as causes for differences in the behavior of their users.
It may seem preposterous to suggest that a platform can affect shopping behavior but let's remember that the PC, the subject of this article, is a platform in itself. The migration of usage away from the PC to alternatives can only be explained by the alternatives being superior at the particular job that needs doing. The argument is naturally extendable to each alternative individually.
Research #Industry #Theory · 94 comments
iOS unit sales crossed over 700 million units last month. That is a significant milestone but the total number of units in use is likely to be lower. My estimate based on device replacement assumptions is that about 500 million are still in use.
The estimated break-down of units sold and in use by device type is shown below:
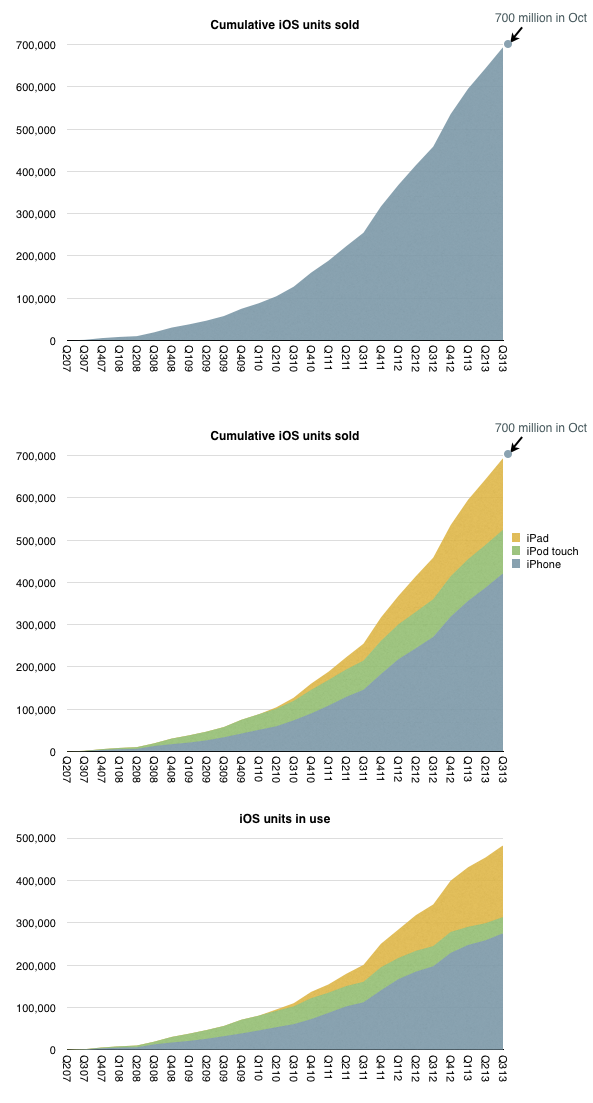
When I looked at the penetration of iPhones in the US (as a part of smartphones in total) the surprising pattern was that it followed a logistic curve (while other platforms didn't.) If this is indicative of a particular learning process to be observed in the market, then can we extend the logistic growth pattern to iOS overall?
I tried it with the assumption that at 500 million, iOS is at the half-way point in its growth. This assumption comes from growth being near an inflection point. It could be that iOS might accelerate further in which case peak penetration could be higher than 1 billion, but might take longer to reach.
The 500 million as 50% penetration point assumption fits the model as shown below.
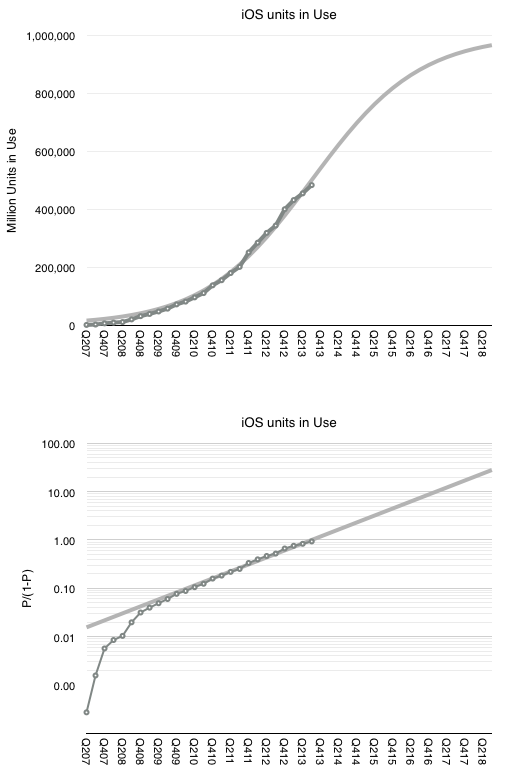
The fit is pretty good for the period after the iPhone 3G launched. This assumption would therefore imply (nearly) one billion iOS devices in use by the end of 2018.
Note that this does not mean one billion iOS users. The attach rate for iOS devices per user could well reach 2 by then placing total user base at 500 million. Note that this size of audience is very nearly the existing total Apple audience already (counting iTunes/iCloud accounts).
This means that we already have "existence proof" that Apple can reach half-a-billion users. Apple does not need to discover a large new set of non-consumers. The idea of 1 billion iOS devices is simply the projection that each current user could some day use two devices.
I joined Benedict Evans and Ben Bajarin on their Cubed podcast to discuss innovation and cultures that breed innovation. We also discuss some updates on our thinking of the curious case of the android tablet ghosts toward the end.
Show Notes
The Meaning of Really Cheap Android
Android as the Platform For Commodity Electronics
Harvard Business Review – How Pixar Fosters Collective Creativity (subscription required)
via Cubed Episode 010: The Process of Innovation | Cubed Podcast.
Research #Nostalgia #Theory · 84 comments
Benedict Evans explains well the problem with measuring Android tablets. There are no reliable data collected because many of the devices are invisible through the regular, measurable channels:
The only measured statistic happens to be component shipments. Items such as screens, CPUs or perhaps memory might be visible to market analysts. It's therefore tempting to add up tires manufactured to determine what's getting sold in auto dealerships.
But it's also hugely problematic.
Before we go into that rat's hole, I want to re-visit my original criticism for market analysis based on device attributes. When the iPad was new it was famously labeled a "media tablet" by Gartner and excluded from being counted (and hence compared) with PCs. This created an implicit signal to the analyst's clients to ignore the entrant as irrelevant.
That actually accelerated their demise (and the revenue prospects for the analyst).
In contrast to that exclusion--of a clear and present danger based on an arbitrary definition of form factor--the analyst who defines categories of products purely on the definition of their components is guilty of the same sin.
Snowing the audience with irrelevant comparisons is just as bad as withholding relevant comparisons. This is explicitly asked of witnesses: to tell the truth, the whole truth and nothing but the truth. The "nothing but the truth" means the exclusion of irrelevance.
The correct approach is to identify which devices are comparable (and thus in the same category) based on the jobs they're hired to do. If a tablet overlaps considerably in the work it does with a PC (e.g. browsing, email, media play, and other applications) then they should be considered comparable. If a tablet does nothing that a PC does or nothing that an iPad does (e.g. no browsing, email, apps or ecosystem activity other than piracy) then they should not be considered comparable.
Which brings me back to the question of what these dark matter "Android tablets" actually do.
To answer I want to recall another "dark matter" technology that seems to have gone largely unnoticed but was exceptionally popular. This was the VCD or Video CD. It was an alternative to the DVD without the licensing and DRM overhead it entailed. It was extremely popular in Asia as a way of not only buying but also sharing video content. The cost of content was a fraction of sanctioned versions, essentially taking the role that mass-copied VHS had in previous years.
The "job to be done" was to enjoy video content cheaply and conveniently for the equivalent of pennies a day. A job very similar to what we think of as cable TV today.
These devices and discs were largely invisible mainly because they did not exist in economies which adopted protected DVDs and because the content consumed did not hit against any databases that tracked consumption. Nevertheless there might have been hundreds of millions of these devices sold and billions of discs viewed.
Now we are in a situation where devices whose primary purpose is to watch video content (cheaply and conveniently) are being counted. By their counting, their implicit competitiveness is asserted. But it means nothing if they are not hired for the same jobs. In fact it misdirects attention.
Sometimes these "low end" devices do grow up to swamp the higher-powered alternatives with good enough functionality. That is the innovator's dilemma for low end disruption. But in some cases they don't because other factors are at work. Because ecosystems have complex multi-sided markets and because regulations and channels and consumer behavior conflict with the technical specification.
For this reason the VCD did not "disrupt" DVD or grow up into a Blu-Ray equivalent that caused Hollywood to crumble. It faded away as an anomaly.
Whether the dark matter Video-only Android device will come to swamp the iPad will depend not on just volume shipments in select geographies. It will depend largely on the ecosystems built around it. The ecosystems of VCD were largely unsustainable because there was no value placed on the content itself. The value chain did not strive to sustain the technology. When something better came along, it got dropped.
In contrast, content-based value chains sustain technologies which keep the revenues coming. And we can measure this revenue.
You don't need to look too hard for that in tablets. Apple states it quite frequently: total payments to developers.
Research #Theory · 20 comments
In the post Seeing What's Next, I showed how the rate of change of adoption of technology varies with time and asked what might be experienced by present and future generations.
It turns out that knowing how what innovations become universal and the speed at which these technologies are replaced can give us an idea of what individuals might experience in their lifetimes.
Here's how to think about it:
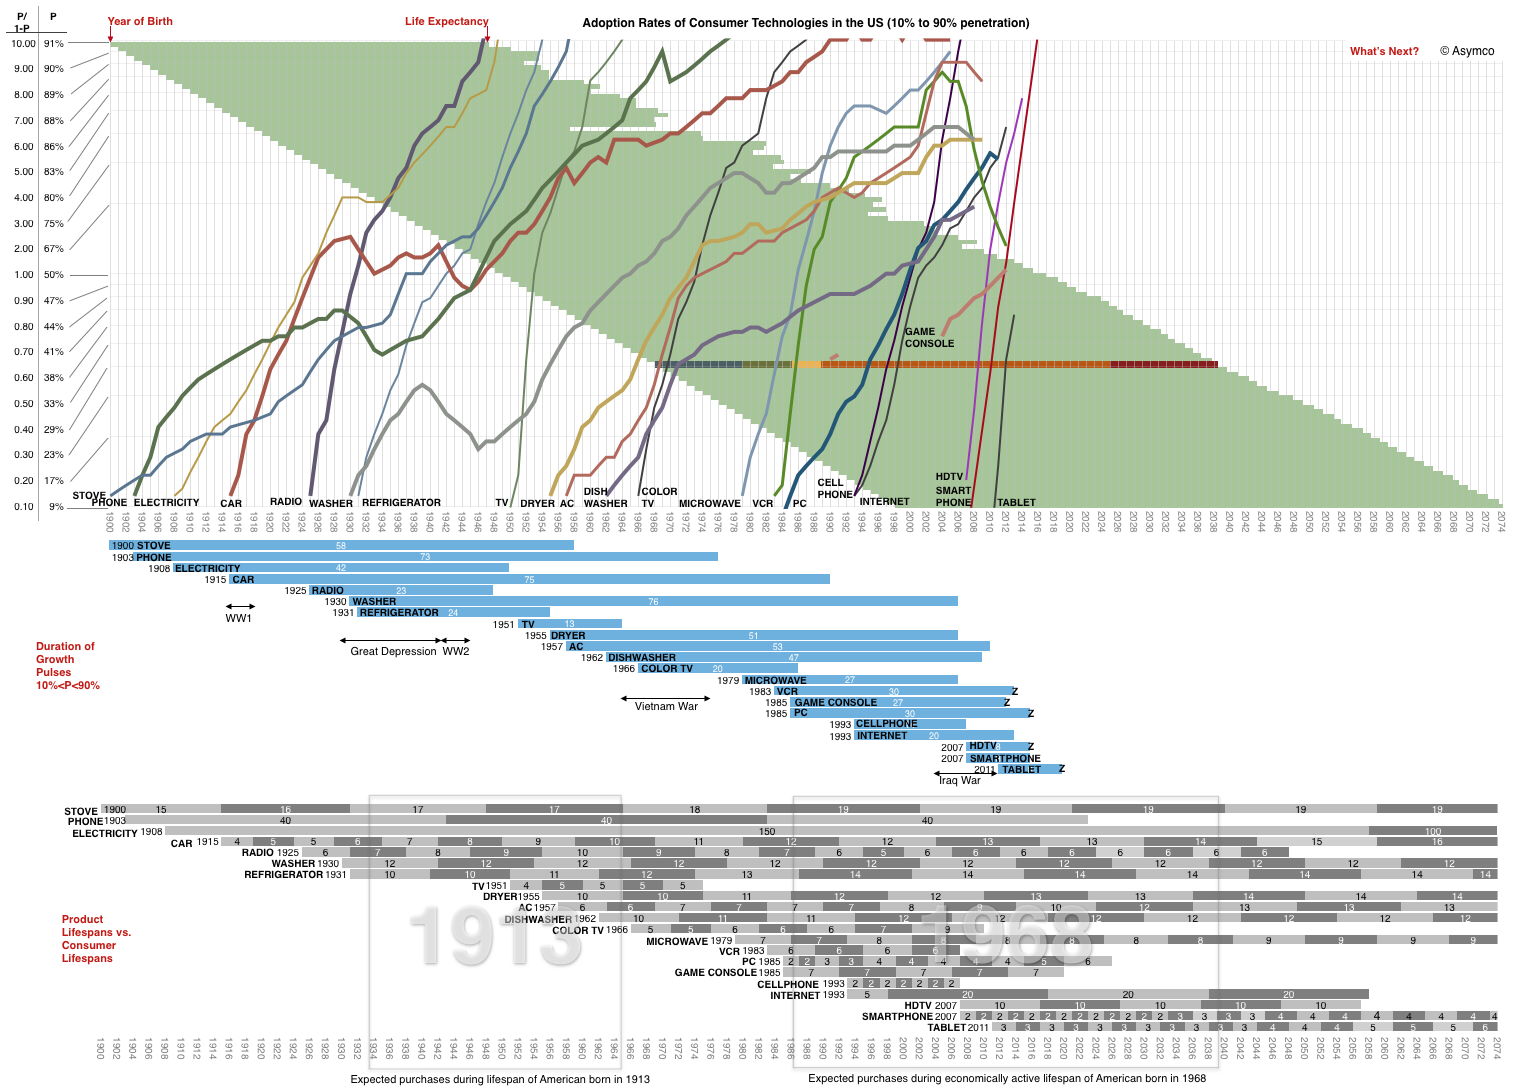
You can use the model above to visualize a lifespan, given a year of birth. Follow the line for your year of birth and measure an expected life (the life expectancy in green is a guide). You can skip over childhood years and decide when you might have reached an age when you start buying and using certain products as well as when you think you might stop.
Trace a rectangle over the grey areas in the bottom graph spanning the years you will start to consume and when you might expect to stop.
The area within the rectangle will include known products and their expected lifespans (marked in alternating shades of grey with a figure for the longevity of service life.) The total number of segments represents your expected consumption.
I marked the areas for a person born in 1913 and one born in 1968 ((Corresponding to my grandmother and myself though we were not born in the US.)) What the analysis shows is that I would be expected to own:
A couple of caveats:
I did the same tally for my grandmother and it matches prettily closely her consumption with the caveats that she did not reside in the US and that she lived almost twice the expected lifespan.
The obvious next step is to multiply the model by population forecasts.
Research #Industry #Theory · 62 comments
The adoption of smartphones in the US is on track for reaching 90% of the available audience by August 2016. This is a mere eight years after smartphones reached 10% penetration. As far as technologies go, that's pretty fast. To get an idea of how rapid, I plotted a few other technologies and the time they took to grow within the US market.
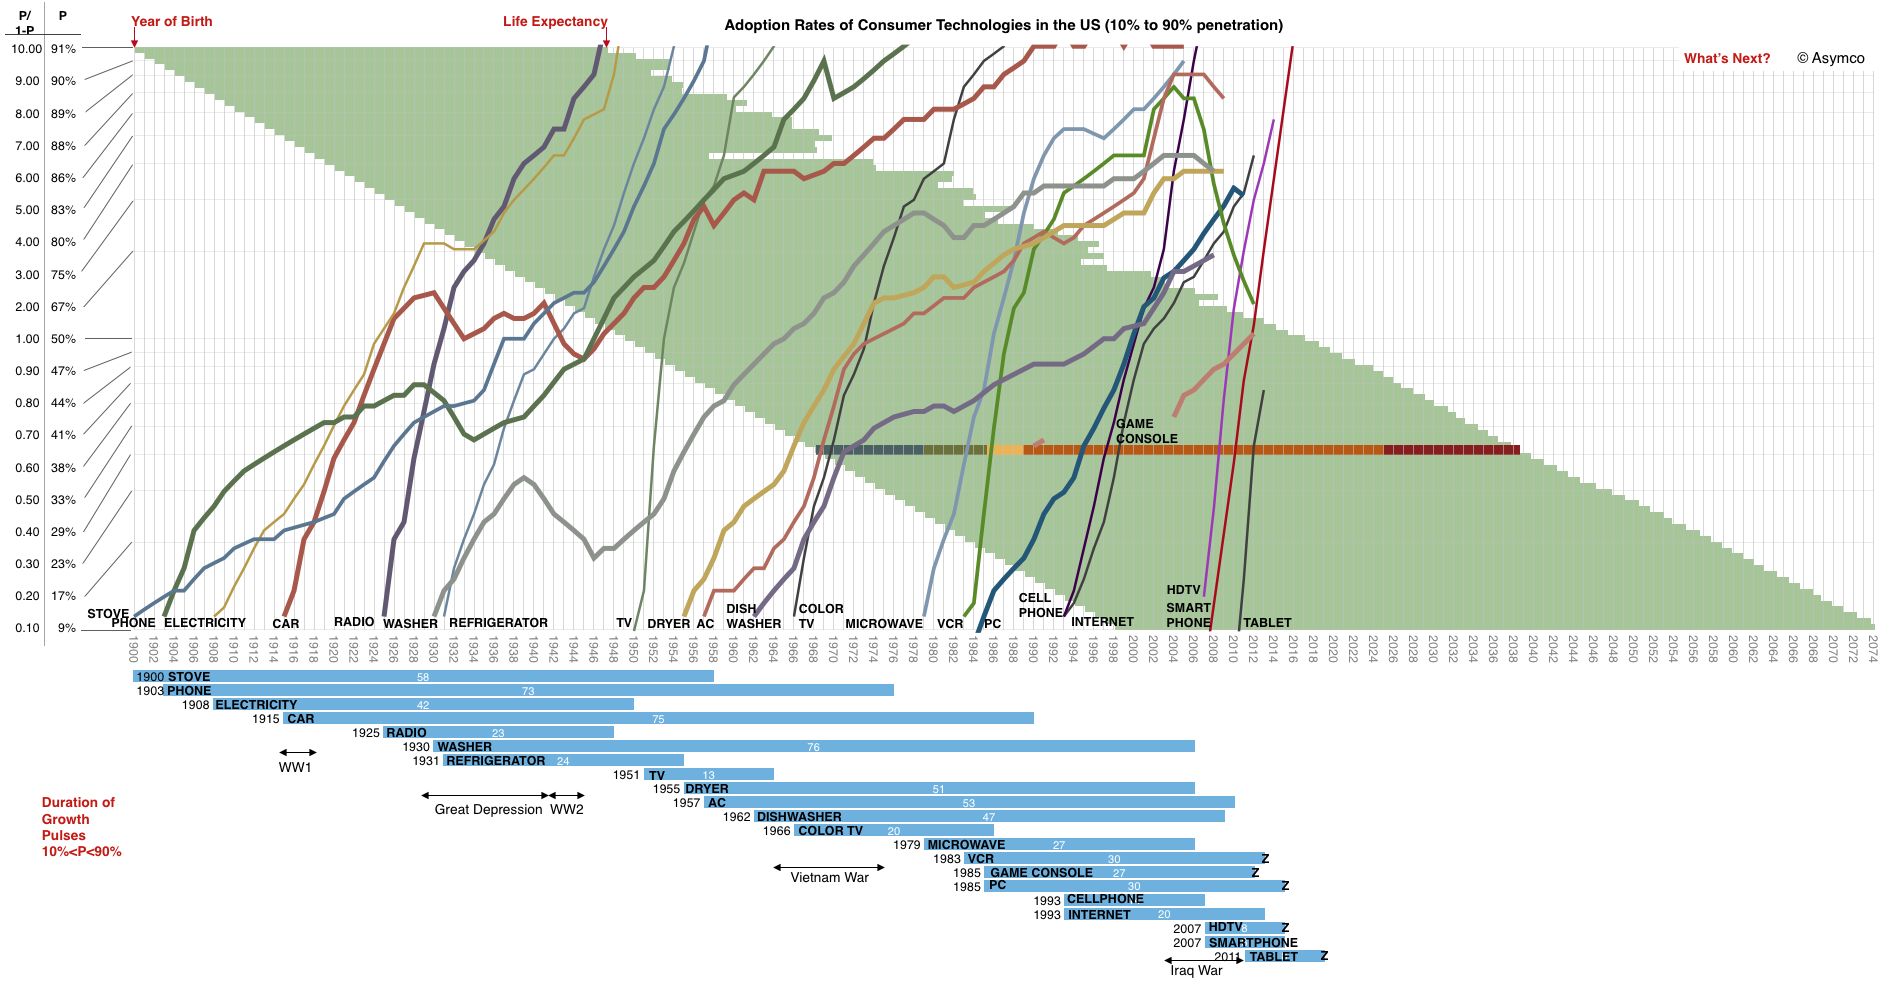
A few things to note:
You'll also note that the time frame does not end today but that the technology curves do. The time frame includes the expected lifespan of someone born in 1998.
What will they see?
There is a lack of visibility or certainty among observers that anything worthy of inclusion on this graph will ever emerge.
And yet, when glancing at this graph, it would seem that the addressable market, the rate of introduction of new technologies and the speed of adoption have all increased. The area to the right of 2013 looks inviting to a plot of many lines.
Indeed, for the canvas to remain blank would be the riskiest of bets.
What would you put upon it?
The fascination with highly visible but largely unknown business models continues. How do infomercials work? What is the value of fashion? How can you make money when no creative idea can be protected? Why is Apple building a sapphire manufacturing facility? It's all part of a pattern.