The Critical Path #99: Grand Unified Theory
In the wake of Apple's final announcement event of the year, Horace and Moisés discuss the cost of free software, the unification of file formats, and the cost/benefit of interoperability.
In the wake of Apple's final announcement event of the year, Horace and Moisés discuss the cost of free software, the unification of file formats, and the cost/benefit of interoperability.
Research #Nostalgia · 25 comments
During the first quarter of fiscal year 2014, we changed our organizational structure as part of our transformation to a devices and services company. As a result of these changes, information that our chief operating decision maker regularly reviews for purposes of allocating resources and assessing performance changed. Therefore, beginning in fiscal year 2014, we are reporting our financial performance based on our new segments; Devices and Consumer (“D&C”) Licensing, D&C Hardware, D&C Other, Commercial Licensing, and Commercial Other.
The previous reporting segments were:
The new are:
From Microsoft's FY14 Q1 10Q via Microsoft Investor Relations - Press Releases
The mapping between the old and new is not straight forward. There is overlap between D&C Licensing and the old Windows and perhaps between Entertainment and Devices and D&C Hardware but there are many gaps. There is also some overlap between the old "Business"/"Server" segments and the new "Commercial" but, again, they cannot be matched.
I show the difference between the two structures in the way revenues are allocated below, using color to try to show similarities.
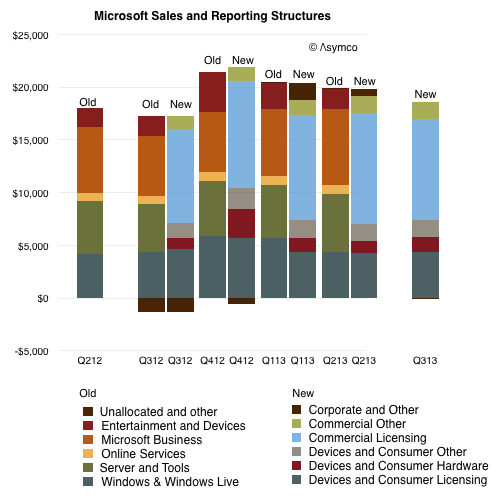
Given the re-stated quarters it's possible to compare one year's historic performance at a segment level. For example, the company states that "Devices and Consumer revenue grew 4% to $7.46 billion" while "Commercial revenue grew 10% to $11.20 billion".
Since we don't have data older than one year, our ability to assess the company over longer time periods will be drastically reduced and a new picture will take a long time to emerge.
There is however one aspect of the new structure that needs to be appreciated right away: the allocation of costs has changed fundamentally. The company explains:
Cost of revenue is directly charged to the D&C Hardware segment. For the remaining segments, cost of revenue is directly charged in most cases and allocated in certain cases, generally using a relative revenue methodology.
We do not allocate operating expenses to our segments. Rather, we allocate them to our two segment groups, Devices and Consumer and Commercial. Due to the integrated structure of our business, allocations of expenses are made in certain cases to incent[sic] cross-collaboration among our segment groups so that a segment group is not solely burdened by the cost of a mutually beneficial activity as we seek to deliver seamless experiences across devices, whether on premise or in the cloud.
[my emphasis]
In that brief paragraph Microsoft has formally and in a financially binding way declared itself to being a functional organization. ((Welcome to the club.))
The mechanism seems banal: operating costs are no longer assigned to product divisions but to two large buckets. In practice this means that profitability (P/L) cannot be assessed or assigned to individual managers. The lack of P/L responsibility means that incentives from top to bottom have to be re-engineered. If this goes wrong, the Assets ((read: people)) of the company could evaporate.
If the assets go, then processes and priorities are for naught.
In other words, what the company is undertaking is a priority shift (to a functional structure to create integrated experiences) which requires a process change (whereby employees work according to new incentives) while preserving the fragile assets the company depends on (a motivated and skilled base of employees.)
This makeover is as ambitious as a re-org gets and the context, scope and target are as difficult as they can be. This is, after all, the largest software company operating the the most dynamic industry whose multi-sided markets are notoriously volatile due to disruptive forces.
The challenge also suggests why Ballmer left and who should replace him. A priority transplant operation requires a different set of skills than those held by the manager who created the processes for the previous set of priorities. That's the manager's dilemma: even if you foresee the changes needed and push for them to be enacted, your reward might be to be replaced by someone who can make the changes happen.
Those who envision and persuade for change are rarely allowed to enact it.
Research #Industry · 128 comments
Apple's latest product launch (new OSX, iPads, Macs and iWork/iLife) came with a change in pricing for software. OS X and iWork and iLife and updates are now made available free on new Macs and, in the case of the suites, on iOS devices as well.
Recall also that iOS updates are now free as well and that OS X had been reduced in price from about $129 to $29 with Snow Leopard in August 2009 and to $19 with Mountain Lion in July 2012. The iSuites have also dropped in price over time so the pattern of evaporating software prices is long-running.
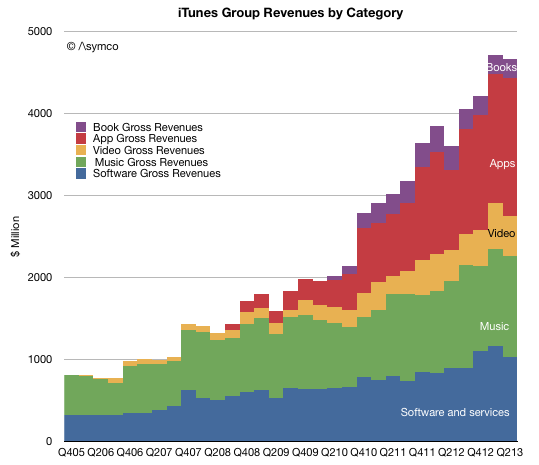
But how fast and what is the impact? The historic performance Apple's Software business is not easily determined since it was always blended with additional businesses. Until September of last year, Software was reported as part of "Software and Services" and since then as part of "iTunes, Software and Services." Some assumptions allow the following picture to be drawn:
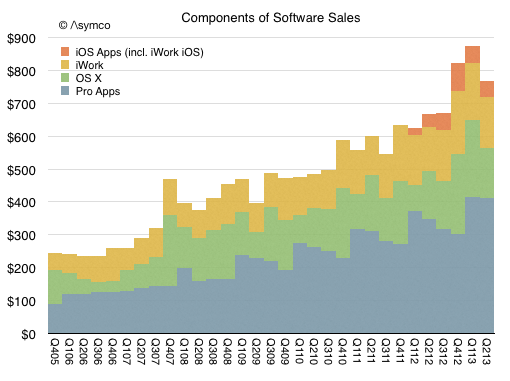
One additional wrinkle to the Apple software story is that OS X and iWork/iLife are not all the software titles available. Apple's software includes Pro apps as well as the non-free OS X server. The non-free software US prices are:
Given that and additional assumptions can lead to the following picture of the components of Apple's Software sales (in $ million/quarter).
Given this picture of the software business and the change in pricing, here is my forecast for the third and fourth quarters (in $ million/quarter):
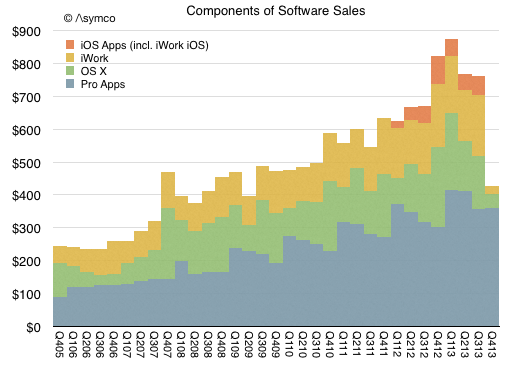
The foregone revenues could be as much as $450 million from what would have been received with existing pricing model.
So the question that naturally arises is whether this is "worth it". Whether by offering free software hardware or service revenues rise.
Perhaps. Certainly service revenue in the form of iCloud might rise with more usage of iWork and iLife. But I don't think that this is the calculus underlying the decision. Remember that Apple does not have a Profit/Loss accountability. It's not necessary (and perhaps not even preferred) that a division balances costs and revenues. ((The graphs in this post (and the preceding 1900 on this blog) were created using Numbers.))
Fundamentally Apple remains a systems company where software is a key element in its definition of value. That is not changing. What is changing instead is the bundling of application software with the systems software and the system itself. The presence of iWork and hassle-free updating of that suite (and the same for the OS) means that utilization rates will increase.
I believe the logic for Apple is that usage of the products determines their value and therefore placing powerful software in the hands of more users means they will value the entire system more. This leads to the notion of greater "stickiness" or "lock-in" but also to higher satisfaction and loyalty, rate of upgrades and even more third party purchases and yet more usage.
This is the virtuous cycle platform custodians seek to engender. This is what Apple is trying to build and the transition of apps into the system bundle is part of this re-enforcement.
One wonders how long before Apple's approach becomes the norm for other platforms.
Research #Industry #Theory · 83 comments
Using logistic curves to measure diffusion of innovations is a powerful method of analysis. However there are limits to what can be learned. The methodology helps in understanding how quickly a pervasive technology is adopted. It assumes that the technology "fills all available space" within a market. It therefore also assumes that whatever problems the technology solves are universal problems.
Put another way, if a technology is not universally useful, it tends to peak before a market saturates. This "universality" condition is in evidence when observing that pervasive technologies are adopted not only by all members of one national market but also all nations and through all means of government and regulation. In other words that the jobs that the technologies are hired to do are so important that they bulldoze any and all obstacles placed in the path of adoption.
The only difference is one of timing. Some regions are quicker than others. Institutionalized obstacles essentially defer rather than deter adoption. They impede rather than block.
And I am pretty sure that smartphones solve universal needs and their adoption will be nearly 100%. They also have fairly low impedance given the speed of adoption (50% penetration in most large markets seems to come in less than 5 years.)
That's the story for the technology, but how value is captured is another story.
Who captures and how it's captured are questions of commerce not economics. They are informed by competitive advantage and business models. The puzzle seems to be that individual companies don't capture value in the patterns of Logistic curves. Or at least I don't think they do.
Consider the graph below.
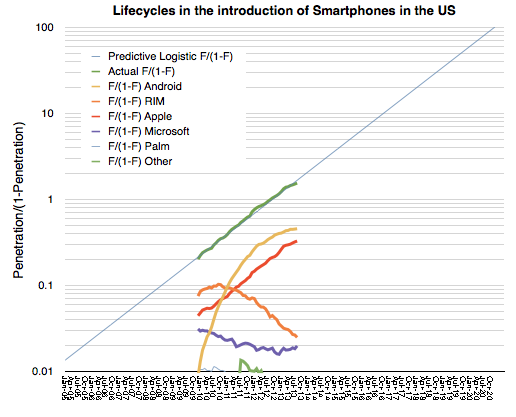
It shows the transformation of a logistic curve into a linear representation. It's a log-scale graph of fractional shares of smartphones in general (Blue/green Lines) and individual platforms in the US.
The individual platforms are shown as (Platform x share of all phones/share of all others). This is a "logistic substitution trajectory". ((Fisher and Pry, 1971, proposed a similar model to study the replacement of old by new technologies. The basic assumptions of the Fisher-Pry model are: (1) The substitution process is competitive. (2) Once substitution by the new technology has progressed as far as a few percent (i.e., "lock-in"), it will proceed until a complete takeover occurs. (3) the rate of fractional substitution F1 is proportional to the remaining substitution 1- F1 possible. Source: Grübler, The Rise and Fall of Infrastructures Physica-Verlag 1990.))
The problem is that whereas the overall category (smartphones) reaches saturation, it's not at all clear that any individual platform does. At least from the data we have so far, there is far too much volatility in platforms to see a clear pattern of monopoly emerging.
I'm not sure if this is "proof" enough to convince anyone that this market supports any number of platforms, but it certainly disproves that there will be only one. ((The odd pattern here seems to be Apple's consistent (i.e. parallel) adoption. One hypothesis could be that Apple is different in solving the prevailing job to be done while rivals jockey for positional advantage.)) We're too far along for churn to convert existing users before saturation sets in.
Asymcar 6: Peak Horse | Asymcar.
Steve Crandall brings a new perspective as a guest. Steve’s analysis of complex systems has given him a huge pool of wisdom into which we dip our dainty spoons.
We survey the interlopers seeking to replace many jobs that cars have traditionally done, from horses to bicycles, planes, trains and buses.
We dive deeper into a few earlier Asymcar topics including energy, regulation, infrastructure, power train evolution, societal changes, distribution networks, urbanization and consider the promise of electric bicycles.
Several innovation timing lessons temper our expectations for immediate improvements.
Finally, we revisit the emerging transportation information layers and how such services may change public behavior and the auto-ecosystem.
Asymcar 6: Peak Horse | Asymcar.
(Honorable mention to anyone who can identify the vehicle shown above.)
Research #Theory · 12 comments
Cinematic is to film as Literary is to prose. It's not a measure of quality or of beauty. It's mainly the application of technique to impart an additional layer of meaning to the writing, performance and direction of the medium. Cinematic technique lifts the viewer to another, more profound point beyond the literal.
Whether it's film, literature, verse, stagecraft or other visual arts, techniques vary but they have the same purpose. They make the audience feel more than what is said.
The quality of a good work of art is that it tells a truth without saying it.
And this, I believe, is what the analyst should also strive for. It is at least what I try to do and, having practiced for a while, I think I can convey some of the techniques I learned.
We don't have a better word for describing these techniques than "cinematic". They allow the presenter of complex and rich data to convey meaning with an economy of rhetoric. They draw the audience into completing the picture thus making it their own. They persuade without pleading. They teach without lecturing. They create, in a way, a poetic language for data that combines techniques from several arts, especially cinema.
The means for teaching this is a workshop called Airshow.
Together with IBM, we are proud to bring Airshow to Boston, New York and Helsinki this year.
Register here.
Research #Industry · 33 comments
The analyses of adoption of smartphones in the US and EU5 are remarkably consistent with each other. They also turn out to be consistent with the valuation of Apple.
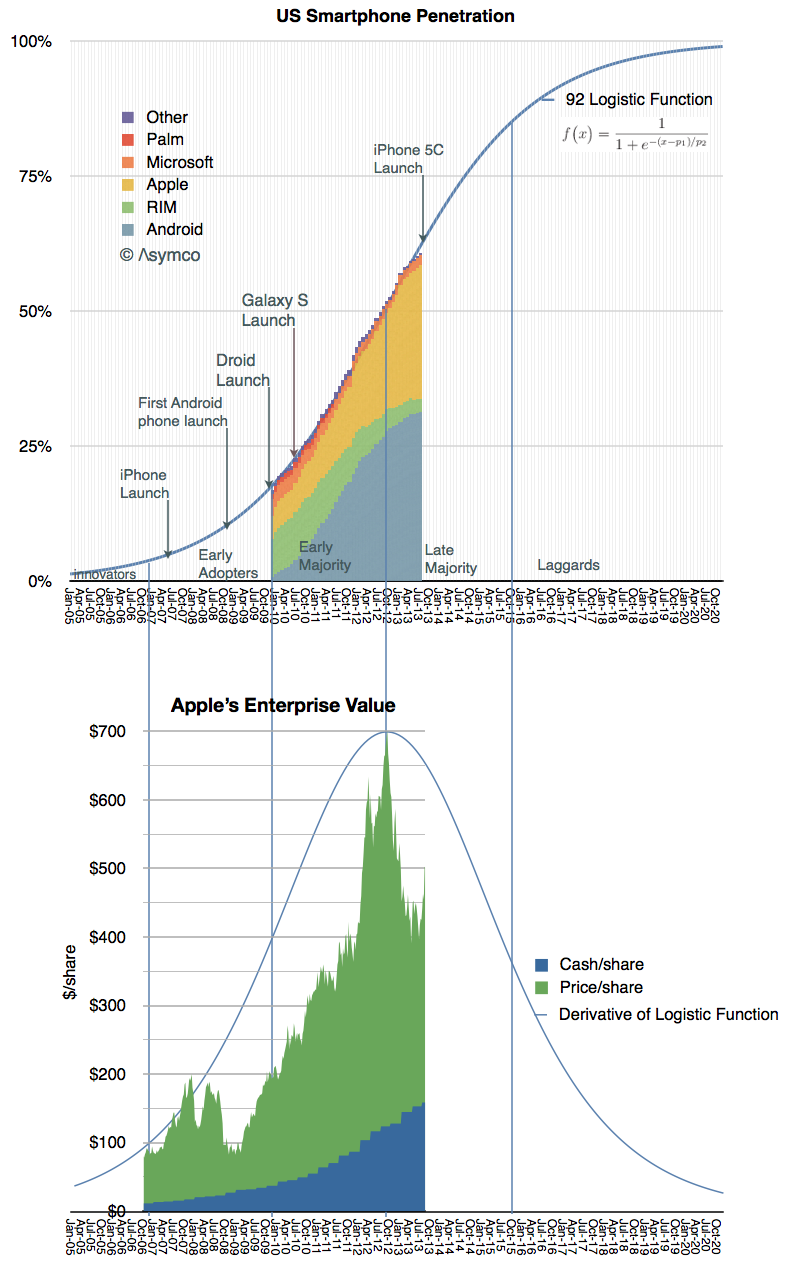
I show the stages of adoption overlaid with the derivative of the Logistic Function and Apple's enterprise value. The derivative of the Logistic Function shows the speed of adoption, peaking at the inflection point when adoption ceases to accelerate and begins to decelerate.
The peak in Apple's enterprise value happens to fall at the exact point of inflection in the adoption curve and hence maximum growth.
It could suggest that the market perceives the value of Apple to be entirely reflective of the US market.
But I can't imagine anyone would be so foolish as to believe it.
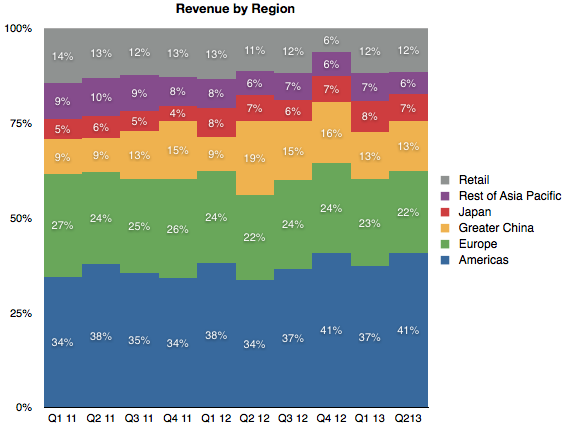
One can only conclude that it must be just a coincidence. (( Apple's revenues by region:
))
Horace and Moisés look beyond Apple's rumored "watch" project to contemplate the real reasoning behind recent executive acquisitions from the world of high fashion (and what it signals). Is Apple now driving "lifestyle" more forcefully than ever? We examine redefinition, from public face to product, and Mac Pro to (possibly) iPod nano.
Research #Industry · 46 comments
Thanks to Symbian, the EU5 countries (France, Germany, Italy, Spain and the UK) had an earlier start in the conversion of phone usage from non-smart to smart devices. According to published comScore data, in July 2010 the EU5 were at 26.6% penetration of smartphones and the US was at 22.8% ((The population is defined as adults using phones for themselves. Meaning it excludes children and phones purchased by companies.)).
However, with the aid of mobile operator subsidies, by the beginning of this year, the US caught up. According to comScore EU5 reached 57% penetration in March 2013 while the equivalent figure for the US was 58%.
Using the logistic curve model introduced last week, it's possible to get an approximate categorization of the adopters of the technology:
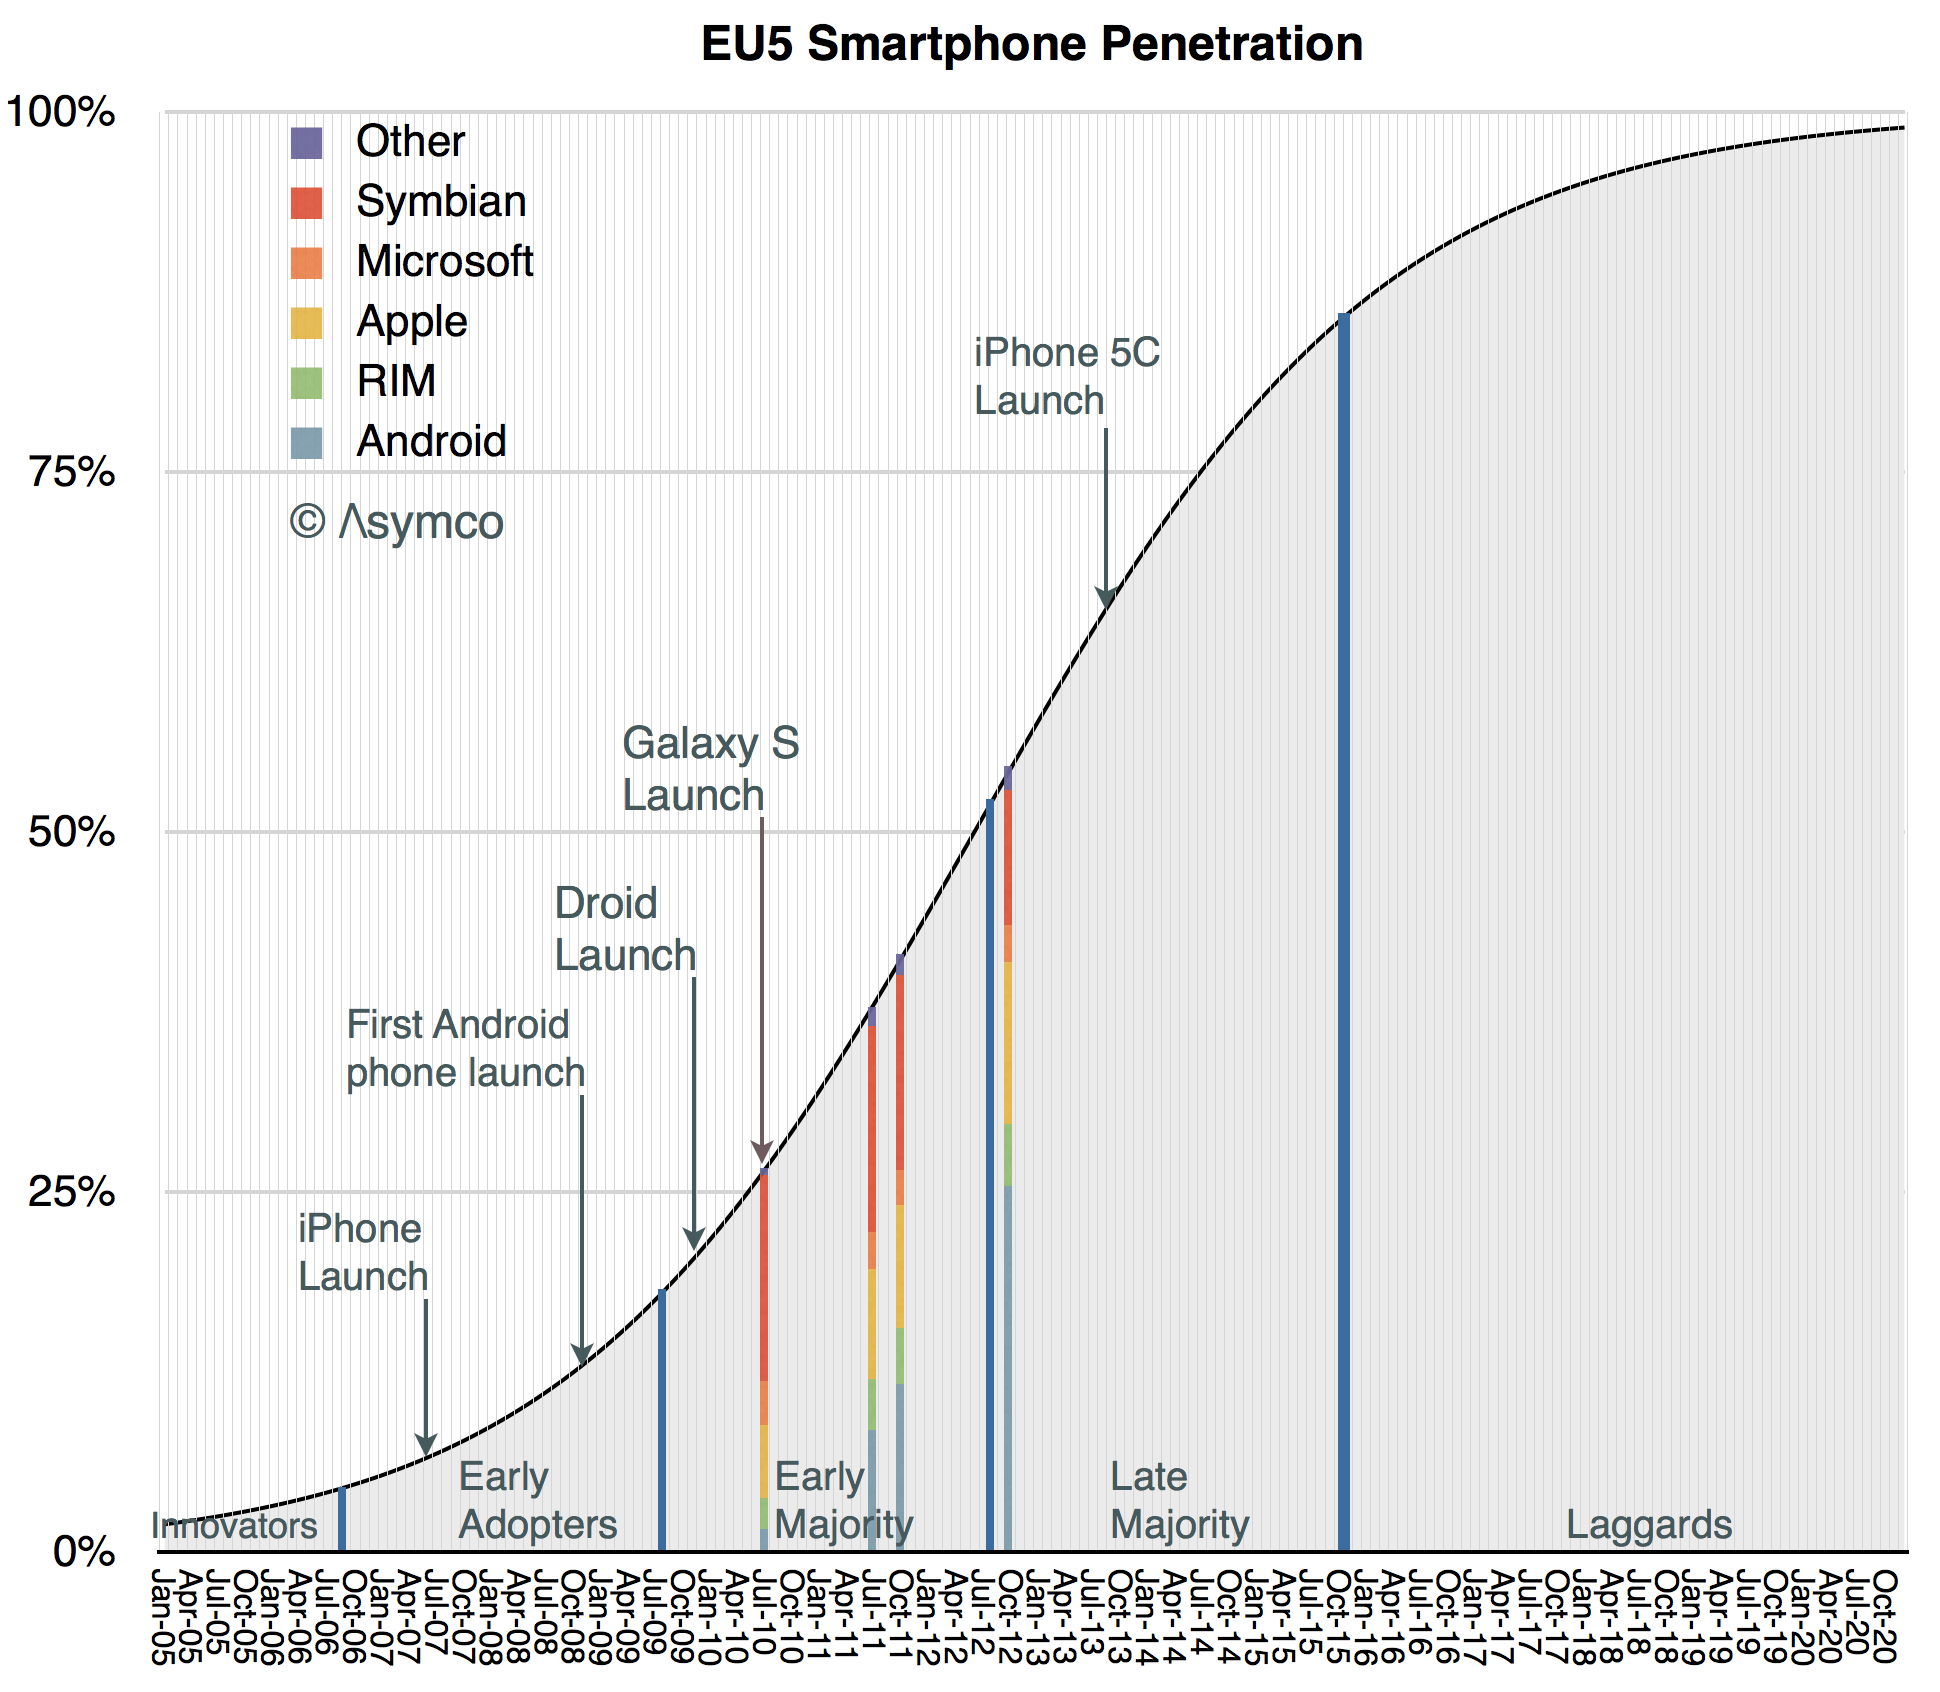
As with the previous analysis, the graph identifies the following dates:
Therefore if we want to suggest that saturation happens near 100% then the answer to the question in the headline is "the end of 2020." If we want to suggest that saturation is the end of the Late Majority then the answer is "two years from now."
One final observation: the two markets appear to be converging thus placing the analyst in the comfortable position of forecasting the adoption of smartphones for a total population of 425 million people ((see previous note)).
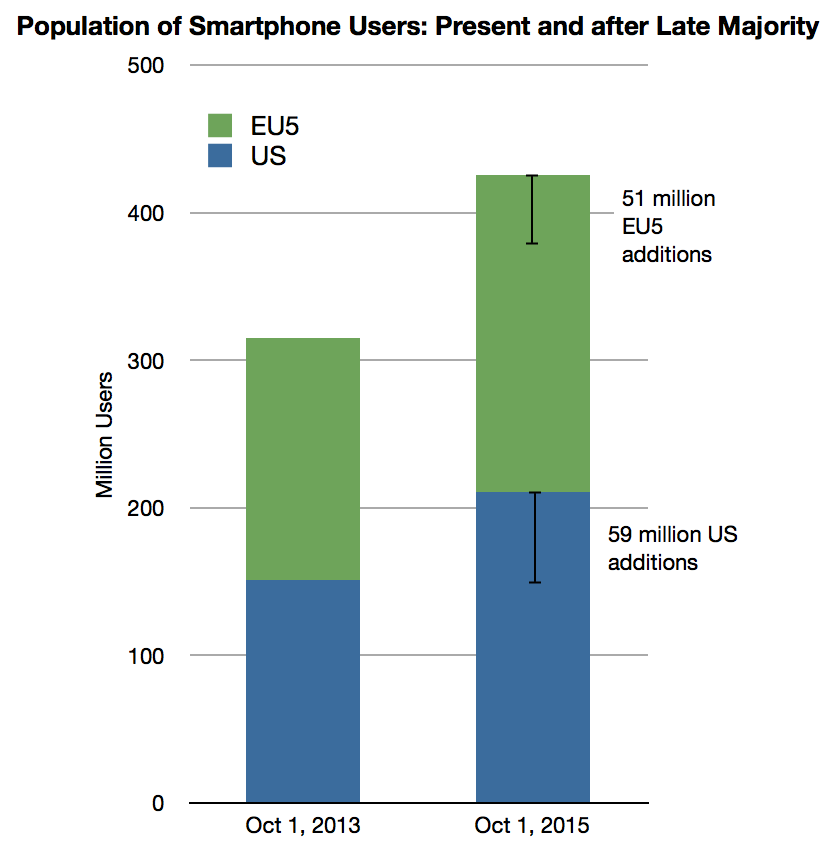
If we define saturation as the end of the "Late Majority" period then the number of new-to-smartphone users remaining for the combined EU5 + USA markets is 110 million of which 59 million will adopt in the US and 51 million in Europe. They will all join ecosystems in the next two years.
Plan accordingly.
Airshow New York was our best Airshow ever. We sold out to an audience who engaged and challenged us to our best performance. We are learning more each time and after three shows we have honed the show to a fine performance.
Due to the demand met in New York we decided to return there in December 5th but to also present in my home town of Boston on December 3rd. We are also presenting in my second home town of Helsinki in November.
You can sign up for any of these events at Airshow.asymco.com.
The purpose of Airshow is:
The method we devised borrows heavily from the techniques of Cinematography and screenwriting to impart meaning to the audience beyond the literal words spoken or images shown on screen.
This includes:
These techniques are demonstrated with "feature presentations" and then deconstructed in interactive lectures. Throughout we also weave Aristotelian rhetorical tips and present from the Asymco repertoire of stories.
The day ends with a hands-on exercise. iPads are required.
At the end of the seminar you should be able to:
We are looking forward to seeing you at the next Airshow.
Of Phaetons, Coupés, Shooting Brakes, Broughams, Hackneys, Cabriolets, Landaus and Limousines. Horace and Jim step back in time to revisit the raison d’être for carriages and the emerging “horseless” carriage. We explore how evolution rather than revolution of networks influenced the technologies of transportation.
The question of foothold markets comes up and we explore which jobs-to-be-done affected early car design. The leap from these early jobs to the modern segmentation of the market is observed through the contrast between Henry Ford’s approach to the then agrarian market compared with Alfred Sloan’s portfolio strategy at General Motors.
The discussion morphs into a brief infrastructure review where the development of roads is compared to today’s telco operator business and regulatory models.
Finally, Horace and Jim drift into insurance and discuss the risk pooling implications of driverless cars.