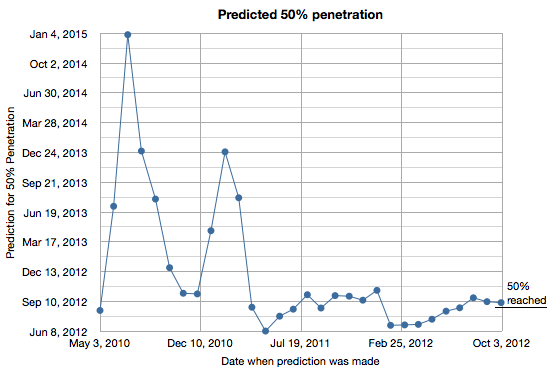
50% penetration for smartphones in the US turned out to be fairly predictable. I tracked my predictions based on comScore data and the results are shown in the following graph.
I began making predictions in May 2010 and updated the estimate every month since. As the chart shows, the prediction converged to early September 2012 by early 2011. The actual date was sometime in late August 2012.
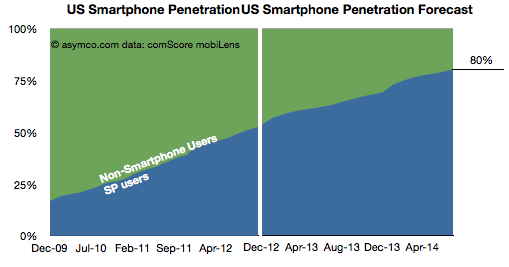
The reason this prediction was relatively easy was because the rate of penetration growth was mostly linear throughout the period of 2009 to 2012 or from 17% to 50%.
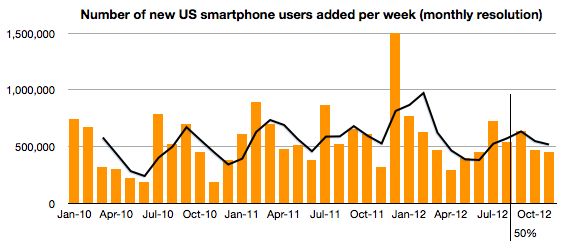
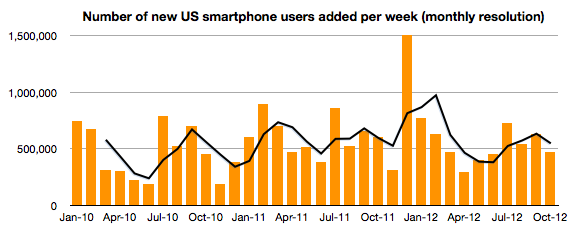
In fact, the consistency continues even above 50%. The following chart shows the weekly new smartphone users add rate. No slowing seems to be evident for the few months since 50% penetration was achieved.
So if we assume that this rate will be preserved or increase slightly, how soon can we expect smartphones will reach 80% penetration in the US?
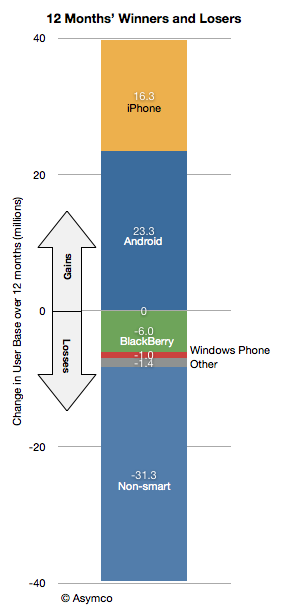
During the last 12 months 31 million American phone users abandoned the use of feature phones. During the last 24 months over 60 million switched. Over 550k users are switching every week and this rate of switching has not changed much since late 2009.
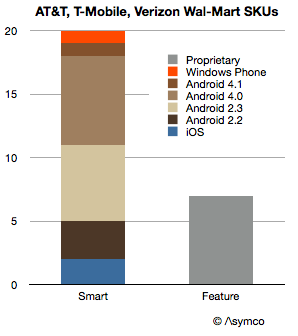
Some of this switching has to do with demand for smartphone services but some of it is also due to a decreasing supply of non-smart phones. The shelf space being allocated to smartphones is nearing 100%. My single sampling of a Wal-Mart store shows the following data:
Looking at individual carriers, AT&T ranged one feature phone and 7 smart SKUs. Verizon's ratio was 2:8 and T-Mobile's was 4:5.
T-Mobile has been lagging in smartphone adoption and as they transition in 2013 it's possible that the AT&T ratio of 12% shelf space dedicated to feature phones will become the norm for the US. And as the US goes, the world will follow.
With shrinking shelf space comes an accelerated decline in the product category. It may not come in 2013, and perhaps not by 2014 but it's quite possible that by 2015 the last feature phone will make its appearance in the US.
A discussion on a forthcoming blog post titled "The Last Feature Phone". Also why stock markets are intractable: the problem with understanding the motivation of buyers and sellers of equities, especially those who act on behalf of others as fund managers. Finally, a review of what's on Horace's to-do list for 2013 and a hint at the new 5by5 show High Density, the first episode which is linked in the show notes.
In the first episode I interview Glenn Fleishman and talk about what it takes to be on Jeopardy (and how to win.) We also go on a journey into the lore and charm of The Economist and the curious state of modern journalism.
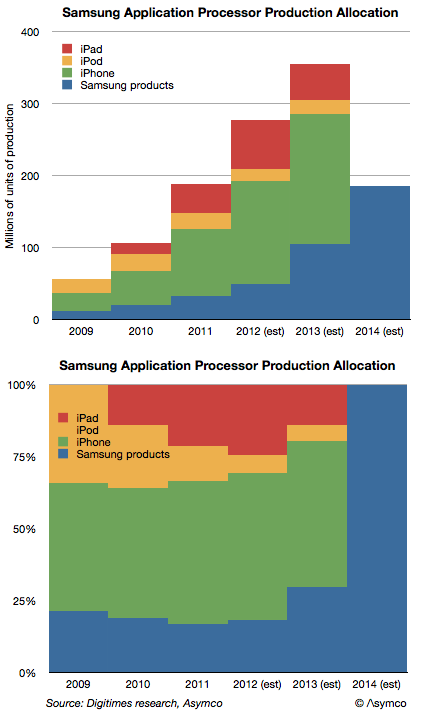
Digitimes Research published an estimate of the allocation of production of application processors by Samsung. It suggests that Apple will transition away from Samsung as a processor supplier during 2013 and stop sourcing altogether by 2014.
Most current capacity (nearly 70%) is said to be allocated to Apple's products. The iPhone, iPad and iPod touch consumed an estimated 226 million processors in 2012. That demand is expected to increase but it will increasingly to be met by other suppliers in 2013. However, Samsung's own products will take up some of the slack.
The following graph shows the estimated production schedule by customer.
There are several questions that this data raises:
Who will produce Apple's processors after 2013. Will it be one or more suppliers is also an open question.
Is Apple's CapEx (est. $10 billion/yr.) being spent on some of this future capacity? A modern fab costs about that much.
As the iOS processors are Apple's own designs, will Apple be integrating production and design?
Prior to his departure Intel's Paul Otellini had begun speaking about manufacturing. He argued that the "fabless" model was no longer competitive and that design and manufacturing should be re-integrated.
I think we're about to find out to what degree that will happen.
Update 2: Use this link to reserve a special event rate of $149/night. You can also reserve by calling the number above and asking for the Asymco rate.
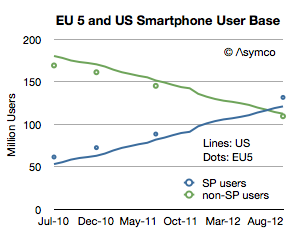
comScore released one of its rare updates to the EU5 (Spain, UK, France, Italy and Germany) smartphone market. Note that the data is claiming to show installed base and not sales in any particular period. What interests me is a comparison or contrast between the European market and the US market.
First, total users.
The EU has about 500 million inhabitants while Europe overall has 731 million. The EU 5 total about 314 million which is very nearly the same as the US (311.6 million). Therefore the EU5 is a good comparable to the US in terms of population. As the graph above shows it's also remarkably similar in its adoption of smartphones. Note that the scale reflects users and since the populations are very similar then the penetration should also be similar.
On Samsung's use of Capital, Value Chain Evolution and Below the Surface. Why would you read the balance sheet of a tech company, the difference between R&D and capital spending, how to prevent suppliers becoming competitors and what are the economics of systems and application software in a device-centric model. Finally, why you shouldn't confuse obscurity with secrecy.
How much does it cost to have the world's best maps?
The answer may seem simple: $8.1 billion.
That was the cost to Nokia in cash for buying Navteq in October 2007. It would seem that buying that asset (or another one like it) is a cut-and-dried solution to anyone needing a mapping "solution". But it's not an answer that is either complete or explanatory of how mapping solutions are valued.
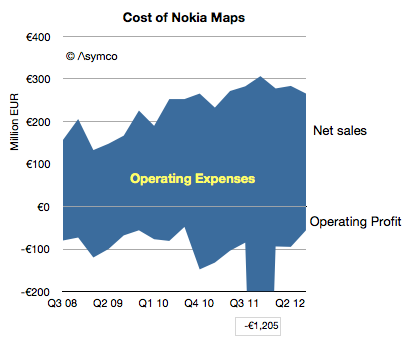
Navteq was not priced as a database for an app. It was a business which was expected to create licensing revenues and profits[1]. The actual price for this business net of cash was $7.7 billion but the following graph shows the net sales and operating profits since Nokia began reporting its performance:
The blue area represents the difference between sales and costs and hence the operating expenses--the payments needed to "keep the lights on".
These total expenses over the 4.25 year time frame totals €6.5 billion. The total operating losses equal €2.6 billion. Therefore, as far as Nokia's shareholders are concerned, they paid $11 billion for Nokia maps, to date.
What do they have to show for it?
Nothing. The entire company is now worth only about $15 billion. It's hard to imagine maps being worth 73% of Nokia. What Nokia hoped to get for the product was some value in its devices. As other issues intruded, that value has not been realized. Nor has any external licensing revenue been realized. Net external licensing revenues are actually decreasing.
The situation looks even even uglier when the maps asset can be seen as costing €1.5 billion every year. Why would anyone want to be in this business?
I bring this up because, apparently, everyone wants to be in this business.
Via Twitter I received a suggestion (rumor?) that Google spends about $1 billion every year for maintaining their maps. (Using a conversion from Euros to Dollars yields a Nokia maps burn rate of nearly $2 billion/yr.) Furthermore, there seems to be a burning desire for Apple to also burn this money.
If so, then Apple might have to start spending $1 to $2 billion/yr to merely maintain a data set. That would be a minimum of an additional 7% in operating expenses.
Why would they do that?
If Apple cannot buy or license quality data, there may be no choice. Maps have become a hygiene factor for a platform. Not having them makes a platform repulsive but having them offers no attraction.
Another way of looking at the maps asset is like a component in a phone. A vendor needs a certain class of processor, memory or screen or battery. Not having a minimum level of functionality makes the product uncompetitive but having it does not guarantee success.
What's worse, the market may have been cornered—there may be no suppliers. Unlike hardware components, the maps component is not a commodity with a market of suppliers. The work needed to maintain the maps is a commodity but the aggregation and consolidation of the data is valuable and those who have gained control over the data and they are not likely to license it to any competitors for strategic (i.e. political) reasons.
So we have a perverse situation of a very costly, unprofitable asset requiring duplication of maintenance effort by politically motivated actors imprisoned by their own strategic interests.
If so then it fits perfectly with the mobile telecom industry. Like mobile networks, maps are very expensive and worth very little.
---
Notes:
The revenues that Navteq was obtaining during the 2008/2009 time frame included that from customers such as Verizon, Garmin, Advertising, Traffic services, Microsoft Windows Live services. For the six months ended on December 31, 2008, Europe accounted for 44% of NAVTEQ’s net sales, North America 43%, Middle East & Africa 8 %, Asia-Pacific 2 %, Latin America 2% and Greater China 1%.
—
If you want to learn more about how to analyze technology industries and the evolution of value chains, consider participating in Asymconf.