An update on Asymconf California, a discussion of engagement and why Android does not get enough of it, why Amazon likes giving away Fires and the causal hypothesis of Samsung's success in smartphones. That plus announcing a new 5by5 show: High Density.
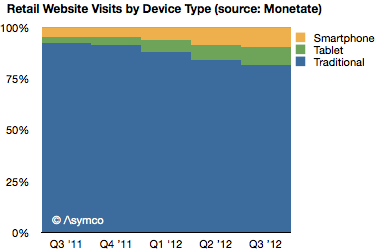
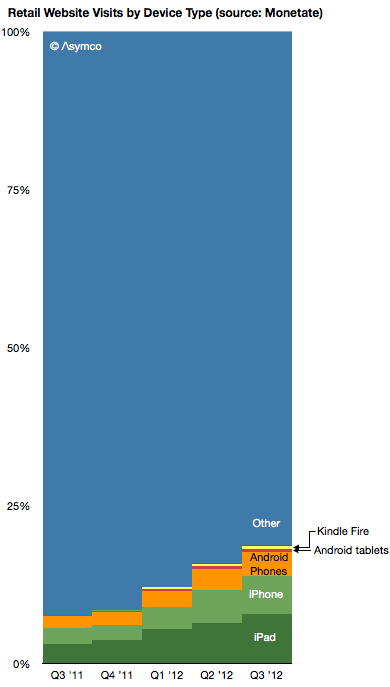
Following yesterday's IBM data, Monetate released a new study showing similar data related to retail browsing but covering a period of dates from Q3 2011 to Q3 2012.
This data also shows an acceleration of mobile shopping, from 7.7% of online in Q3 2011 to 18.8% in Q3 2012.
It also shows tablets growing to take about half of mobile traffic in a very short time frame.
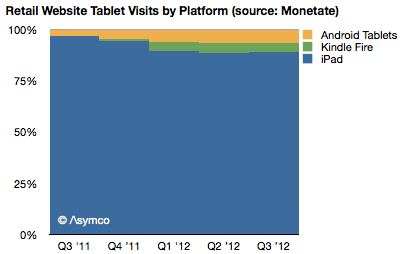
The data also shows the iPad taking the vast bulk of traffic among tablets (88.9% vs. 88.3% from IBM).
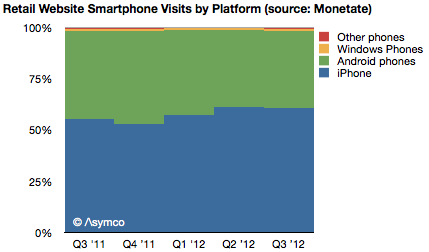
The data also shows the iPhone taking 61% of phone traffic (67% from IBM) with the rest being Android.
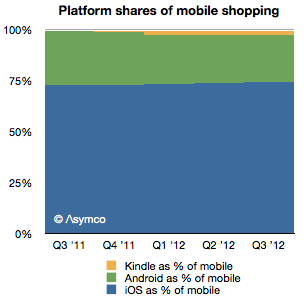
The data shows the share of iOS being 74% in Q3 while IBM reports 77% for Black Friday.
The data also shows a very small participation from Kindle and Android tablets.
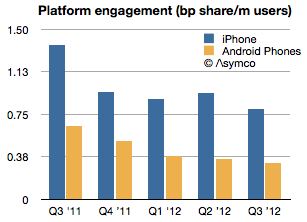
Finally, by using the install base data from ComScore, the data shows an absolute and relative decline in Android engagement. Android phones went from 0.47 of iPhone engagement to 0.4 in one year.
---
If you'd like to learn more about the Asymco method, come to Asymconf. The next Asymconf will be at the end of January near San Jose. Not only will you learn about how mobile is disrupting computing, you will also get to hobnob with the likes of Om Malik, Jean-Louis Gassée and Michael Lopp.
IBM's Digital Analytics Benchmark reported US Black Friday sales and the news is reasonably good. Overall online sales grew by 17.4% while mobile grew to make up 24% of traffic.
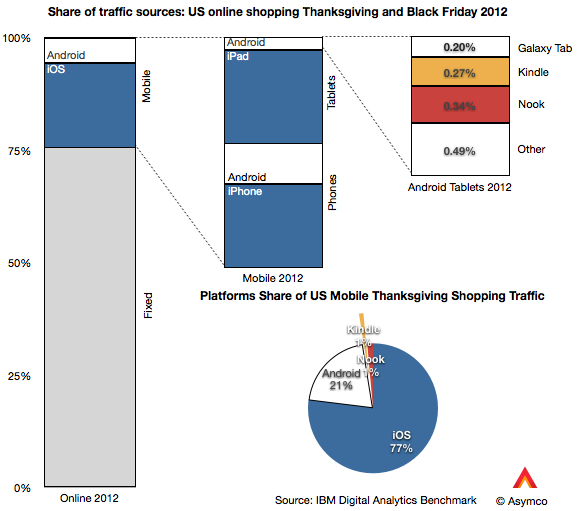
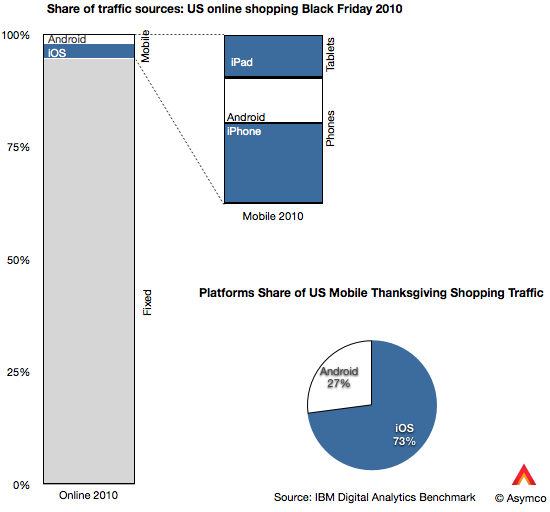
The data goes further to show the split between device types. I illustrate this split with the following graphs:
Of the 24% of traffic made up by mobile devices, phones contributed 13% and tablets 11% (or 54% and 46% of mobile respectively). Of the phone traffic, iOS devices were about two thirds of traffic and Android one third. Of tablet traffic, iPad was 88%, Kindle and Nook were 5.5% Galaxy Tab was 1.8% and other tablets were 4.4%.
Overall, iOS was 77% generated mobile traffic and Android (excl. Kindle, Nook) was 23%.
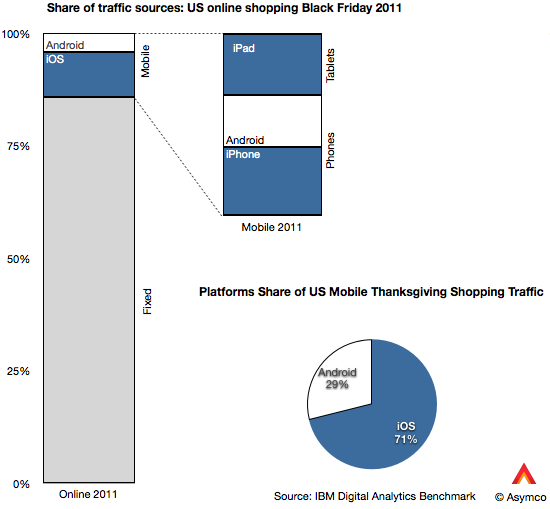
That's an interesting snapshot of the consumption of mobile devices, but is there a pattern here? I also took a look at the same data from 2011 and 2010.
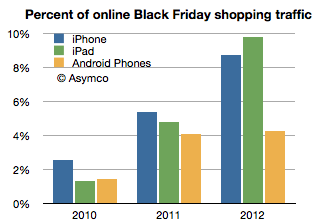
Besides the pattern of significant mobile growth (from 5.2% to 24% of online in two years) there is the curious effect of iOS growth outpacing Android growth. Android went from 1.43% of Black Friday shopping traffic in 2010 to 4.92% in 2012. In same time iOS went from 3.85% to 18.46%. In other words, while Android is up by a factor of 3.4, iOS is up by a factor of 4.8.
The reason is evident in the graphs above: the iPad is now the predominant mobile shopping device. You can observe the pattern in the following graph:
Two years ago the iPad was trailing Android usage but this year it was more than twice Android usage. Curiously, the iPhone seems to also be pulling ahead of Android.
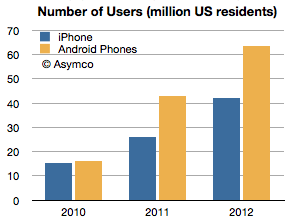
Curiously because the number of Android users in the US has gone the other way. That data is available from ComScore, though only for phones. (ComScore data for periods ending November each year, Nov 2012 is my estimate):
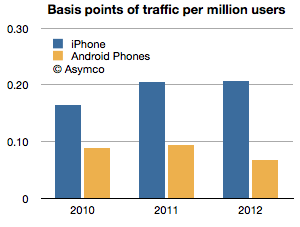
Having the number of users and the traffic allows us to measure consumption per capita, so to speak. That is, the percent of traffic per device user:
The ratio shown is basis points of usage (1/100 of 1% of shopping traffic) per million users of smartphones. iPhone users are about three times more engaged in shopping with their devices than Android users. Two years ago the ratio was two to one.
Overall iPad is changing shopping habits, but it has a near monopoly in its form factor at this point. The bigger question is what is causing phone users to behave differently based on the devices they own. The phone market is more mature and has had several years of competition to be able to discern differences in platforms. The pattern is pretty clear with respect to Android: engagement is down as ownership is up. This pattern has not exhibited itself with iPhone, even though it has had a longer time in market.
Of course, one would expect that later adopters would engage less, but I find it surprising that US Android users would behave so differently only two years after the platform began to be widely adopted. That pattern is not happening with iOS even after five years and certainly not with the iPad which is about as old as most Android brands.
This I consider to be a paradox: Why is Android attracting late adopters (or at least late adopter behavior) when the market is still emergent? We've become accustomed to thinking that platforms that look similar are used in a similar fashion. But this is clearly not the case. The shopping data is only one proxy but there are others: developers and publishers have been reporting distinct differences in consumption on iOS vs. Android and, although anecdotal, the examples continue to pile up.
And engagement is not a frivolous platform attribute. It is highly causal to success because it correlates with all cash flows associated with ecosystem value creation. Especially when a platform like Android depends more on engagement than "monetizing hardware."
I'm not satisfied with the explanation that Android users are demographically different because the Android user pool is now so vast and because the most popular devices are not exactly cheap. There is something else at play. It might be explained by design considerations or by user experience flaws or integration but something is different.
---
If you'd like to learn more about the Asymco method, come to Asymconf. The next Asymconf will be at the end of January near San Jose. Not only will you learn about how mobile is disrupting computing, you will also get to hobnob with the likes of Om Malik, Jean-Louis Gassée and Michael Lopp.
A dialogue with Benedict Evans, mobile analyst. Benedict has observed not only the technology and telecommunications industries as an equities analyst but also worked for an operator and a major media company. We take a look at mobile strategy and what the media industry will evolve into.
The iPhone is a severely constrained product. We're used to thinking that it's production constrained—and it is, but it's also distribution constrained. It has a business model that is almost completely dependent on operator subsidy. Few end users pay the $650 average price that Apple obtains and that price point has held for a remarkably long time. This price point is largely invisible to the user.
In this regard it's very different from all the other products Apple sells. Historically, the company has preferred having its customers to also be its users and maintained a direct relationship with them, strengthening that relationship through its own retail channel for the last decade. Pricing is used by Apple as a signal to clearly illustrate value to the user and pricing is part of the communication about the product that Apple makes very explicit. This has been true for the iPod and Mac and is still true of the iPad. But this is not so for the iPhone. The entire marketing strategy for the iPhone (and hence the entire product concept itself) is "off message".
Why is this?
Before we get into causes, let's try to measure the distribution channel for the iPhone. Apple occasionally reports the total number of carriers it has relationships with. The last update was in the summer when Peter Oppenheimer, Apple CFO discussed the quarter ending June:
We added several small regional carriers during the quarter and now have iPhone distribution through over 250 carriers in over 100 countries.…
We added China Telecom as the second [Chinese] carrier in March…
We also don’t expect to add any significant new country or carrier additions in the September quarter…
In addition, Apple publishes the list of operators it sells through on its web site. The last time I counted I got 227 listed operators.
If we contrast this with the total number of global operators (excluding MVNOs) there might be a way to measure distribution penetration. I compiled a list of all such operators based on information available in Wikipedia. You can browse the list here (Google Docs [1]).
This global list includes 802 operators. The list is not current, being mostly based on 2009 data but it's pretty close. I've read that a more recent (non-public) estimate is 816.
By this measure we can say that Apple has distribution through about 30% of the total operators. Consider also that RIM reports that it sells BlackBerry through 565 wireless carriers in over 175 countries. By this metric alone BlackBerry has twice the addressable market of the iPhone.
But we can do better than counting operators. We should account for the fact that some operators have more subscribers than others.
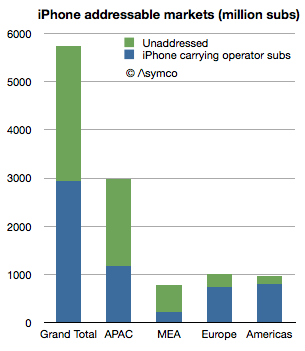
Using the same database, I measured the subscriber count of iPhone distributing carriers vs. overall subscriber count. The ratio was about 50%.
iPhone "addresses" about 2.8 billion connections whereas there are about 5.7 billion available connections. Note that this is not users but subscriptions—essentially SIM cards.
The ratios vary by region:
Middle-east/Africa has 29%
Asia/Pacific is at 39%
Europe 73%
The Americas 83%
We can take it a step further and identify which countries hold the highest opportunity for iPhone distribution. The top 5 are:
India: 658 million
China: 622 million
Pakistan: 116 million
Russia: 102 million
Nigeria: 89 million
But the opportunity is not only in emerging markets. Japan is a 69 million subs opportunity and even the US has 80 million subs without direct (i.e. subsidized) access to the iPhone.
So we can now return to the question of why the iPhone is sold the way it is.
First I should point out that the addressable market of Samsung or Android in general is larger than that of the iPhone. Samsung has relationships with far more operators, at least on the scale of RIM or Nokia, perhaps even more. It might be safe to assume that Android is completely unconstrained in distribution and therefore its addressable market is the entire subscriber space (meaning that Android has twice the addressable market of the iPhone.) For Apple to compete on the basis of volume or market share it would make sense to broaden this network. So what's holding it back?
I think the answer is the other constraint mentioned: production. The company is still iterating the product on a yearly basis and needs to ramp production to reach all its carrier partners in a timely fashion. The carriers use the iPhone as differentiation and a way to uplift their core business. Therefore they want the latest version as quickly as possible. To satisfy this, Apple needs to manufacture the latest variant very quickly. But that's not easy. Peak production is one thing but getting there quickly is another. This is the problem which Apple's vast capital expenditures is trying to solve.
So far the production capacity has been increasing at nearly 100% per annum. This is an astonishing achievement but it's still not enough. The product is supply constrained during much of the launch quarter. Therefore, to summarize, the entire business model for the iPhone revolves around this question:
Can enough units be shipped in a sufficiently short time frame to allow a limited (but large) subset of operators to create competitive advantage which sustains a generous up-front subsidy.
At this time the answer seems to be that the model can work for about 30% of operators serving 50% of subscribers. The crucial question for the business is how much higher can these numbers get?
Note that this is not a debate about market share or consumer preference but about delivering a particular value proposition to network operators, (which sustains a premium price point.) The iPhone is built around this business model and to alter it would alter the very essence of what the product is. The addressable market is one piece of the product but it interconnects with the price, margin, design, production and breadth of offering. You cannot change one without changing the others. It's a product whose distribution model is part and parcel of its design.
I believe that the particular way this product translates into a business is very rigid, which is why it has not changed much during the life of the product. This is in contrast to Apple's other products which exhibit more market flexibility. Inter-dependency is not a new concept for Apple products (e.g. iPod/iTunes, Mac/MacOS) but the iPhone shows a level of inter-dependency with distribution and production the likes of which has never been seen.
This topic will be further discussed at Asymconf in January as the fourth quarter data will then be available and there will be an opportunity to debate it live with an august audience.
---
Notes:
The database is neither current nor complete. If you would like to help maintain the data based on local (public) information, please get in touch and I can grant access to edit it.
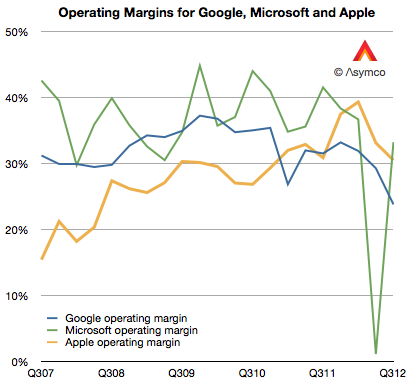
Google's operating margins fell to 23.7% last quarter. This level is the lowest I'm aware of. From 2007 to late 2009 margin went from about 31% to about 37%. Then from early 2010 until present they fell. The history is shown the the following graph.
[I included Microsoft and Apple operating margins for comparison.]
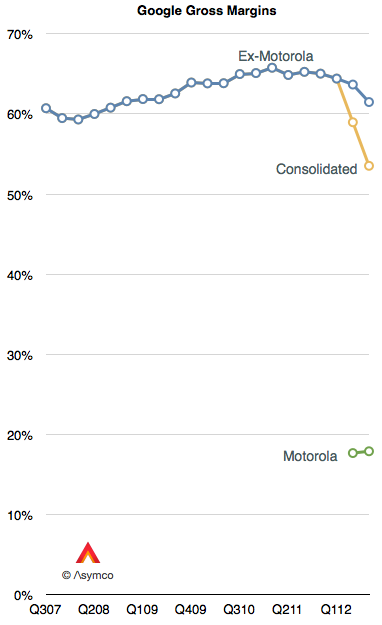
Some of the recent decline is due to the inclusion of Motorola into consolidated earnings. Motorola gross margins were therefore 18%. Excluding Motorola, Google gross margins (Revenues-Cost of Revenues) were 61.5% of revenues. However, even excluding Motorola, Google's core margins dropped.
One reason for the decline in core margins is the reduction in cost per click (-16% for search and -18% for network sites.) This is what Google pays to partners for access to traffic. The trend is not new. It was first discussed in January.
The bottom line is that an individual click is not as valuable as it used to be. Would a larger volume of mobile usage be a reason? Google won't say.
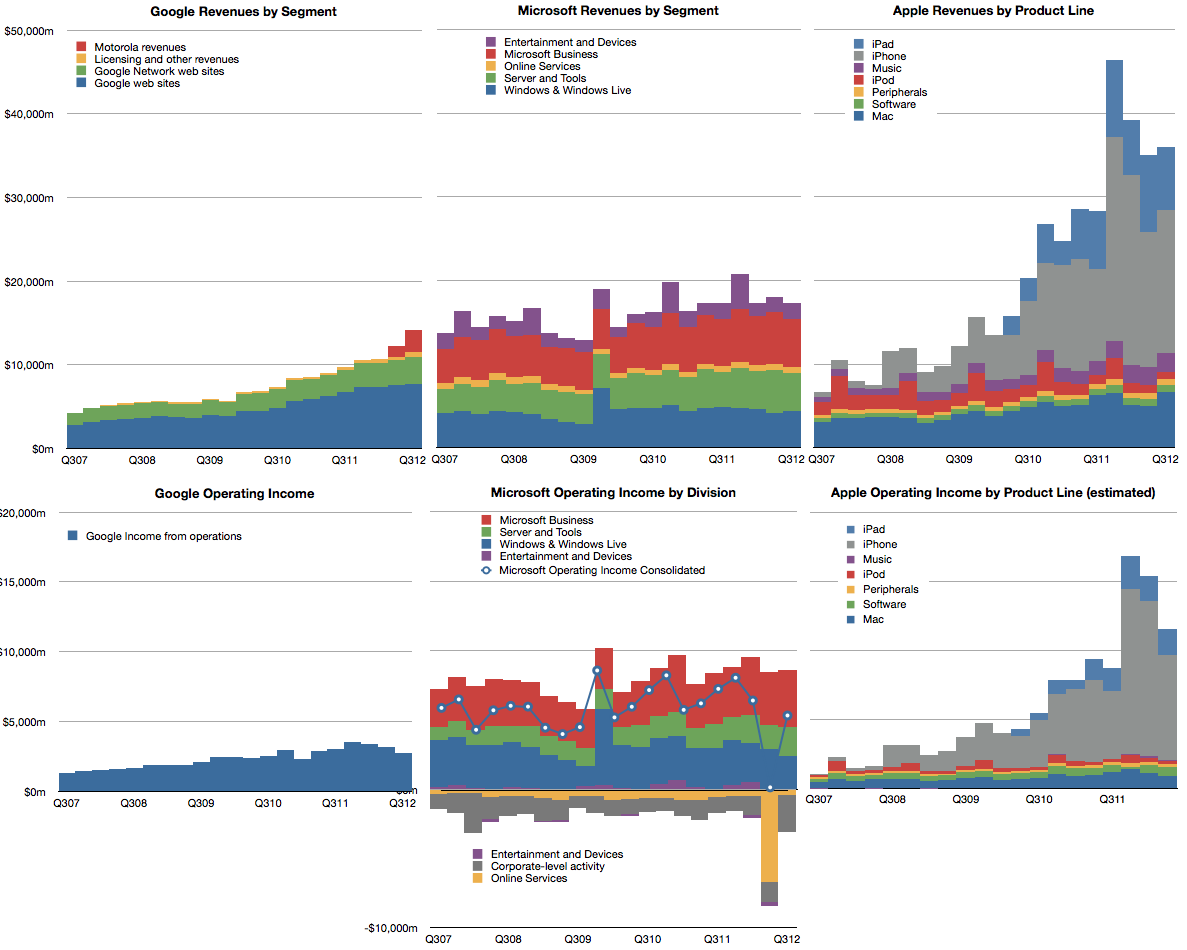
The overall result in the bottom line is shown below. Microsoft and Apple are again put forward for comparison.
Horace and Moisés talk about the consequences of Samsung's absorption of all Android profits, the limits of iPhone's addressable market, Apple bear markets and, like an object in orbit, how Apple seems to always be falling but never hits Earth. Finally, Horace introduces Asymconf California.
Asymconf California is the second[1] in the series and will expand in scope and intensity relative to the first event in Amsterdam. Attendees will be treated to an engaging, participatory experience. Using the case method to teach (and learn), we will look at the state, history and future of innovation as seen from a Californian perspective.
There will be four themes:
Being Back. How California came to disrupt and be disrupted.
It's always sunny. Californians invented the concept of lifestyle. Did they also invent the concept of business style?
Going West. The role of frontiers (geographic, conceptual and societal) in the creation of wealth. Escaping the zero-sum trap.
North vs. South (California.) A modern civil war.
Distinguished guests will be invited to act as presenters and panel members.
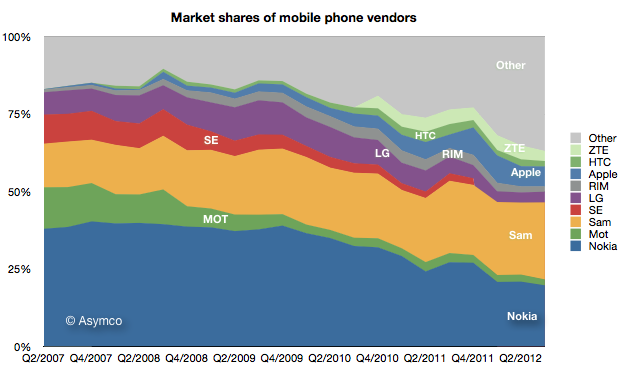
Samsung's recent success in mobile phones has been spectacular. It overtook Nokia for the top spot in overall unit sales.
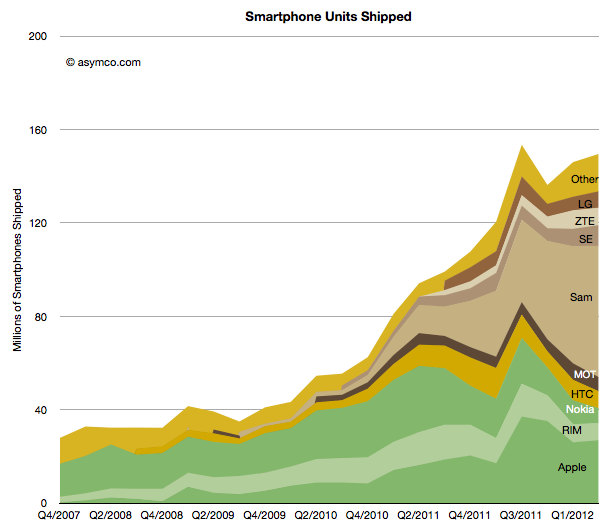
It went from having almost no smartphone sales to selling over 50 million units per quarter in a matter of two years.
It now accounts for nearly 40% of all industry profits.
A key decision which made this success possible was to shift its portfolio to smartphones and to offer a large variety of such phones.
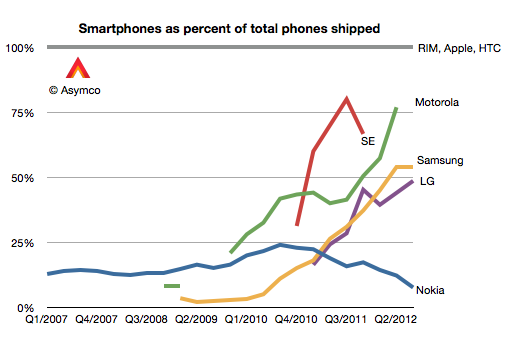
In Q1 2010 only 3% of the phones Samsung sold were smartphones. In the latest quarter the ratio was 54%.
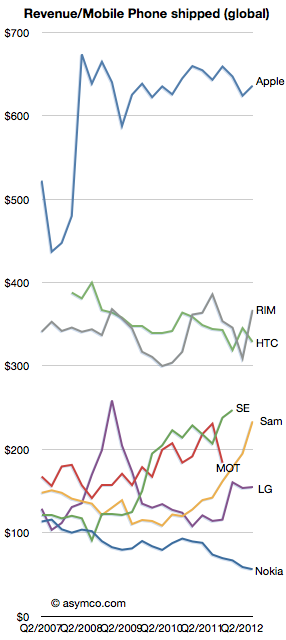
As a result the average selling price more than doubled, from $115 to $234.
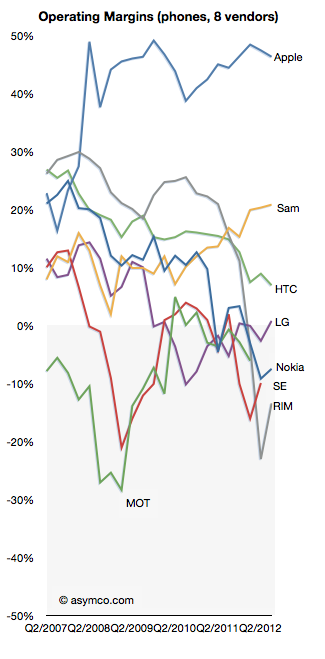
Profit margins also soared in proportion: from 12% to 21%.
All this plus an overall growth in volumes from 64 million to over 100 million per quarter has meant that the company is raking in enormous profits. Not only did it overtake Nokia, the market share leader for 14 years, but is making more profits than Nokia ever did.
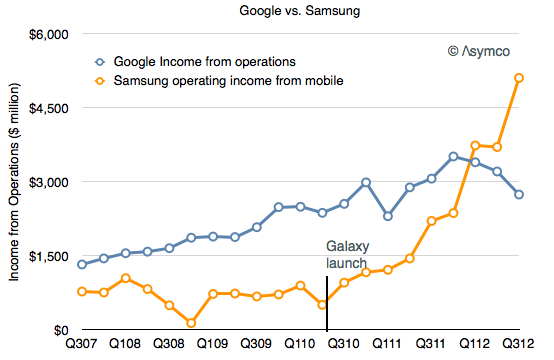
So much profit in fact that it has overtaken Google's decisively.
The reason I point this out is that Samsung's success is dependent on having ridden on the back of Android. Samsung's ascent can be precisely timed to their adoption of Android. The groundbreaking Samsung Galaxy launch was the Galaxy S which shipped in June 2010.
Meanwhile, indications are that "mobile" is causing a contraction in Google's margins.
If nothing else, Android has created a very interesting industry. There are many questions of course: Is Samsung's trajectory sustainable? Why aren't there other vendors successful with Android? Why isn't Google successful with Android? Why isn't Google's Motorola successful with Android? What would happen if Samsung soaks up so much profit from mobile that it's in a position to acquire Google and control the trajectory of their enabling platform?
Apple's renaissance began with the iPod. This was not evident right away however. The product was unveiled on October 23, 2001 at a time when Apple's share price had just fallen 70% from year-earlier levels. It was perhaps a good point from which one could expect a recovery to begin.
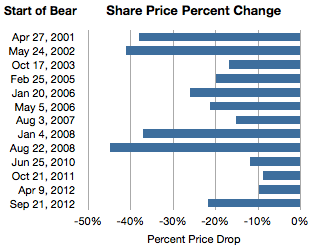
It was not to be. One year after the iPod's launch the stock price had fallen another 20%. Indeed during 2001 the company was in the throes of a "bear market" in its shares. If we measure a time of persistent share price reduction as a bear market, then the one in 2001 was significant. For 154 days, between April 27 and September 28, 2001 the shares fell 38%. This represents the first bar in the following graph showing all the Apple bear markets since then.
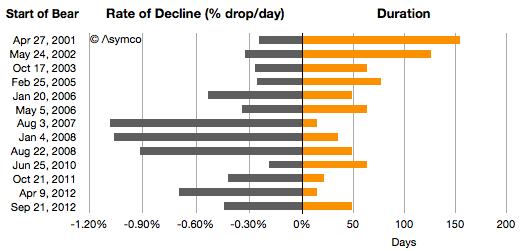
I also illustrated these bear markets in terms of their duration and the average %drop/day.
Chronicling these periods:
From May 24th 2002 and September 27th, 2002 the stock fell 41%.
2003 was less harsh but on the second anniversary of the iPod, for two months between October 17th 2003 and December 19, 2003 the stock fell another 17%.
By 2004 the iPod looked like a hit. The stock rose consistently during the year. Then, in early in 2005, from February 25th to May 13, the stock fell 20%.
In early 2006, January 20th to March 10th, the stock dropped 26%. The iPod was reaching incredible levels of popularity and the Mac was looking to be returning to prominence with the switch to Intel.
2007 was the year the iPhone launched. Right after the launch for two weeks between August 3rd and August 17th, the stock fell 15%. That's the equivalent of 1% per day for two weeks.
As the iPhone was shown to be a hit (and before the credit crunch), for four weeks during January 2008 the stock fell 37%. Again, equivalent to 1% a day for 35 days.
Then after the iPhone 3G was launched and growth reached triple digits, Apple's shares fell for 50 days. From August 22 to October 10th they fell a total of 45%. Again, the equivalent rate was 1% every day for a month and a half.
In 2009 the stock recovered steadily but in 2010, again around iPhone launch season the stock fell 12% over a two month period.
Then in 2011 October, 9% was wiped out.
Then for two weeks in April 2012 10% disappeared.
Which brings us to September 21 to November 9th, 2012. This latest "bear market" has run up a loss of 21.7%, running for 49 days.
Sounds dramatic. The even more dramatic twist is that in this same time frame the share price increased by 576 points or the equivalent of 6,294%. Nevertheless, there were 13 episodes when the shares dropped violently and sometimes persistently for long periods.
Why does this happen?
It's important to recall that at no point during Apple's ascent was there "consensus" that Apple was being successful and certainly not sustainably so. Analysts gave it at best a growth prospect of 20%, and the risks were always obvious and prominent. The company was always on the edge and everybody from the layperson to the experts could see that everything was wrong with Apple. Apple went from being irrelevant to being too big without passing through being boring.
So there is a simple explanation for occasional panic: Apple is not predictable.
But it also seems too consistent. Is the pattern of share price collapse actually rooted in some fundamentals, transient or otherwise? There is a clear failure in understanding the long term but were these downdrafts justified as the market "foresaw" or "discounted" the near future? Were these more than just crises of confidence? Was there wisdom in the drops because they were followed by earnings drops or slowing growth? In other words, if there was smoke, was there fire? Was the market being efficient?
No.
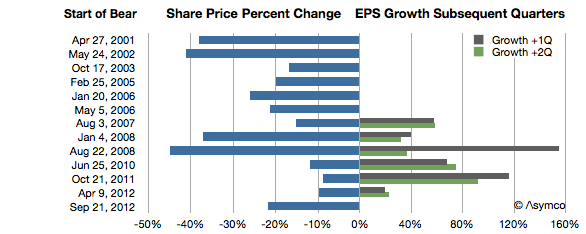
The graph below shows the share price change in the more recent episodes above and the earnings growth during the current and following quarters.
At least since the iPhone launched, every dramatic drop in share price was followed by a surge in earnings growth. One could even say the worse the bear, the better the growth.
Sounds completely counter-intuitive, but there is some perverse logic in this as well. The market reflects crises (as well as over-abundance) of confidence. Unforeseen growth is what creates wealth and the crisis in confidence is a reflection of the improbability of continuing out-performance. When Apple's performance is foreseeable the stock moves slowly upward. When its performance is unforeseeable the stock moves dramatically downward.
A pithy way of putting it is: No news is good news. Good news is bad news.
When a product is understood the stock is mildly desirable. When a new product appears the future is hazy and the stock is undesirable. But that haziness hides potential but up and down. New products is what innovators produce. Bizarre new products is what disruptors produce.
In other words, the paradoxical observation in the chart above of "the more drama in the market, the more success in the marketplace" makes sense when inverted.
For disruptive companies, it should be "the more success in the marketplace, the more drama in the market."
In that sense the current downdraft may be quite auspicious. --- Notes:
Another set of similar observations were made by Eric Jackson in early October in Forbes.