[Kaoru] Kato, president of NTT DoCoMo Inc., said that the firm would want to add the iPhone to its lineup of serviced smartphones if it could form a mutually beneficial contract with Apple, Inc.
Apple requires that carriers servicing its devices sell a fixed amount per year. Katō said that his company could handle such quotas if iPhones accounted for approximately 20%-30% of its overall smartphone sales.
When thinking about an iPhone launch, especially with a new operator, the crucial question is what is the minimum order quantity (MOQ). Some of the iPhone production is sold direct (as in the case of orders coming from Apple's online store) but the majority of units are sold via operator who order in batches.
This issue came to light when Sprint's order was leaked in late 2011. I discussed the order size at the time and put it in context. I concluded that Sprint MOQ was on average 7 million/yr., ramping with 4, 6, 9 and 12 million over a four year period. I concluded that this was not a particularly aggressive gamble.
Data published since then shows that Sprint actually sold 6.3 million during the first year, well ahead of my expected minimum order of 4 million and above even the expectations for the second year of sales. So far then Sprint and Apple gauged minimum demand quite accurately.
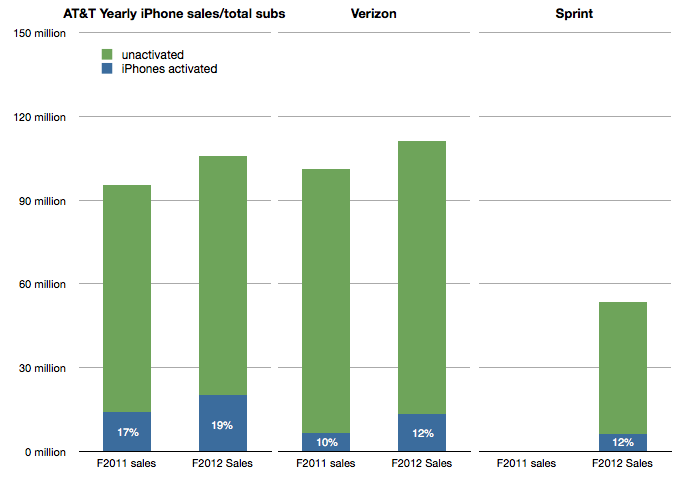
I also showed that the Sprint MOQ was probably indexed off their sub base. I suggested that, based on subs data at the time, Sprint was committing to roughly 13% of its subs buying an iPhone every year. This was indexed off the data showing that 17% of AT&T subs were buying iPhones every year and 10% for Verizon. (I also assumed that this run level would be ramped over time).
The updated totals for the 12 months ended October 2012 are 19% of AT&T subs purchased an iPhone, 12% for Verizon and 12% of Sprint. The performance is shown in the following graph:
Which leads us to think about how the MOQ for the iPhone is calculated. If we assume Sprint and Verizon performance is typical it would imply that an operator like DoCoMo would be required to purchase iPhones at the rate of about 10% to 12% of its sub base each year, modulated to some degree by a ramp.
NTT DoCoMo had 60.7 million subs in September 2012. 10% is about 6 million. Is Mr. Kato's quote above of 20%-30% of smartphone sales consistent with this?
In an earlier interview (in July) Mr. Katō also stated that the target for smartphone sales in the year to March 2013 was 13 million. 30% of that would be 4 million units.
This suggests that the iPhone MOQ for DoCoMo is only about 6% of subs. (4 million) Perhaps this is the basis of negotiation for an iPhone deal. Apple may have held out for 10% subs/yr. with Sprint on the basis of performance of the iPhone in the US but might be willing to settle for 6% subs/yr with DoCoMo, at least for the first year.
The MOQ figure as percent of subs for China Mobile would also be an interesting point of debate.
In 2011 Microsoft's CEO bemoaned that revenue in China was about 5% of what it obtained in the US. Yesterday Apple's CEO suggested that revenue from China will overtake the US in the near future.
The contrast is even more stark when one considers the time and effort each company has made in China. Microsoft has been investing and promoting itself in China for decades while Apple barely had any presence 3 years ago.
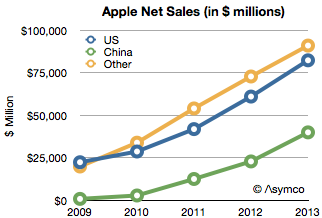
To put a finer point on this I show below Apple's sales by region:
Apple's China net sales in fiscal 2009 were only 769 million. In 2012 they were $22.8 billion. That is a figure greater than US sales three years earlier. Put another way, China sales grew in three years as much as they did in the US in 33.
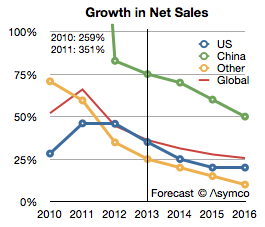
The growth rates were astronomical: over 250% in 2010 and 350% in 2011. In 2012 the growth slowed to 83% but that is still almost twice the US or the global average. The growth rates are shown in the following chart:
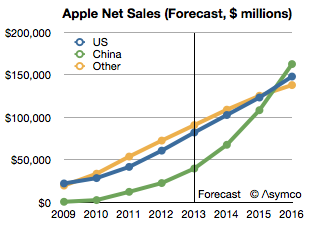
I added an estimate for growth into the future moderating to 50% for China and 20% for the US. If that happens then China will become the largest market for Apple by 2016 as shown below.
The reason for this growth is, of course, the iOS product lines. Growth started when the iPhone was introduced and surged with the iPad and every time updates were released.
The contrast with Microsoft now comes back into focus. China and the US have a roughly equal number of PCs but the mobile users in China exceed the US by a factor of three to one. The pool of users is so great that Apple obtained its growth even with reaching only 30% mobile network distribution coverage.
Without a mobile portfolio Microsoft is severely hampered. Of course, Microsoft is trying and has made several attempts to place its Windows Phone in the hands of Chinese users. It's a tough sale however because Microsoft must work through partners. They need to get vendors to license the OS and the operators to range the devices and retailers to push it. Given the flood of "free" Android variants they are having trouble even starting down that long road.
But more fundamentally, Microsoft's software licensing business model is severely limited in China because what it offers is not what is valued. Both on the PC or on the mobile device, what China values is the tangible. Software can be made valuable only if it can affect the purchase decision of hardware and it can do so only if it's sold as part of an integrated product. With Surface, Microsoft shows that it understands this. What does this imply for a Microsoft phone?
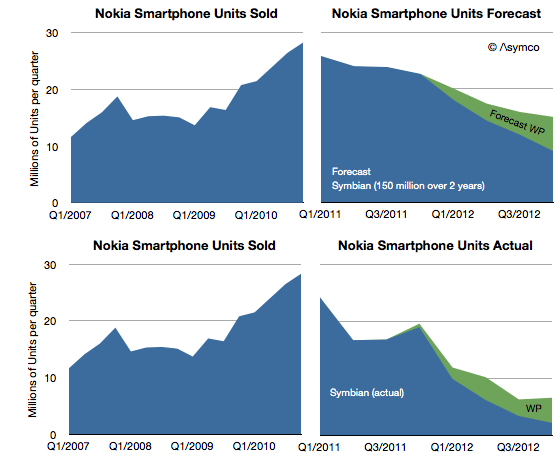
Nokia announced 4.4 million Lumia smartphones were shipped in Q4. That's about 14 million since the Lumia line was launched a year earlier. It isn't however nearly enough to replace the lost sales from Symbian. One year earlier Nokia shipped 19 million Symbian phones in the fourth quarter and the year before 28.3 million. The history of smartphone sales from Nokia is shown below:
I repeated the forecast I drew up in February 2011 when the platform switch was announced. That forecast was based on the company stating that 150 million Symbian phones would still be shipped. Symbian fell far more rapidly than I (and Nokia) expected and to date only 98 million have shipped. The last quarter's 2.2 million seems to be so low that it will be hard to imagine the platform lasting more than a few quarters.
My forecast for Windows Phone was 15 million (through Q4/2012) and the 14 million actually shipped is not far off. However, note that the sequential growth into the fourth quarter was lower than the same period last year. For the holiday quarter Nokia received almost no boost. If there is reason to be optimistic it's that there wasn't a decline in overall smartphones into Q4.
The overall result is that Nokia remains in an operating loss status and it's going to be very hard to recover. No phone vendor has successfully recovered to date. The company managed to book a €50 million one-time payment for IP rights (presumably from RIM) and is sustained by royalties and platform support payments from Microsoft. But even so it's barely breaking even.
The prospects for Windows Phone may be improving however. Operators in the US continue to talk about it. We don't have a split for AT&T's push this past quarter and estimates suggest that 80% of smartphone from AT&T were still iPhones but Verizon will also push the platform and there are suggestions it's doing well in Germany. HTC has also launched some WP flagship phones and may have had a good December as a result.
That translates into steady progress. But the growth of Android and iOS continue as well. Windows Phone needs to continue to persevere in adverse conditions for years to come. The Finns know a thing or two about that.
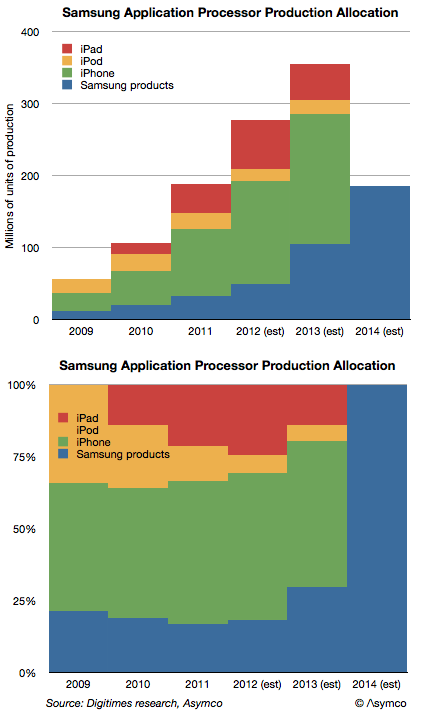
Digitimes Research published an estimate of the allocation of production of application processors by Samsung. It suggests that Apple will transition away from Samsung as a processor supplier during 2013 and stop sourcing altogether by 2014.
Most current capacity (nearly 70%) is said to be allocated to Apple's products. The iPhone, iPad and iPod touch consumed an estimated 226 million processors in 2012. That demand is expected to increase but it will increasingly to be met by other suppliers in 2013. However, Samsung's own products will take up some of the slack.
The following graph shows the estimated production schedule by customer.
There are several questions that this data raises:
Who will produce Apple's processors after 2013. Will it be one or more suppliers is also an open question.
Is Apple's CapEx (est. $10 billion/yr.) being spent on some of this future capacity? A modern fab costs about that much.
As the iOS processors are Apple's own designs, will Apple be integrating production and design?
Prior to his departure Intel's Paul Otellini had begun speaking about manufacturing. He argued that the "fabless" model was no longer competitive and that design and manufacturing should be re-integrated.
I think we're about to find out to what degree that will happen.
How much does it cost to have the world's best maps?
The answer may seem simple: $8.1 billion.
That was the cost to Nokia in cash for buying Navteq in October 2007. It would seem that buying that asset (or another one like it) is a cut-and-dried solution to anyone needing a mapping "solution". But it's not an answer that is either complete or explanatory of how mapping solutions are valued.
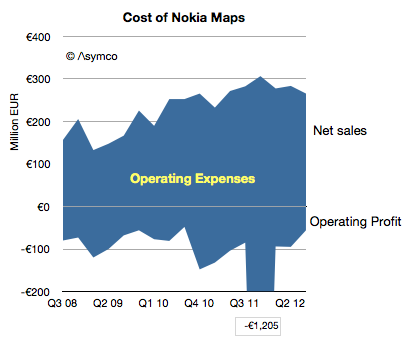
Navteq was not priced as a database for an app. It was a business which was expected to create licensing revenues and profits[1]. The actual price for this business net of cash was $7.7 billion but the following graph shows the net sales and operating profits since Nokia began reporting its performance:
The blue area represents the difference between sales and costs and hence the operating expenses--the payments needed to "keep the lights on".
These total expenses over the 4.25 year time frame totals €6.5 billion. The total operating losses equal €2.6 billion. Therefore, as far as Nokia's shareholders are concerned, they paid $11 billion for Nokia maps, to date.
What do they have to show for it?
Nothing. The entire company is now worth only about $15 billion. It's hard to imagine maps being worth 73% of Nokia. What Nokia hoped to get for the product was some value in its devices. As other issues intruded, that value has not been realized. Nor has any external licensing revenue been realized. Net external licensing revenues are actually decreasing.
The situation looks even even uglier when the maps asset can be seen as costing €1.5 billion every year. Why would anyone want to be in this business?
I bring this up because, apparently, everyone wants to be in this business.
Via Twitter I received a suggestion (rumor?) that Google spends about $1 billion every year for maintaining their maps. (Using a conversion from Euros to Dollars yields a Nokia maps burn rate of nearly $2 billion/yr.) Furthermore, there seems to be a burning desire for Apple to also burn this money.
If so, then Apple might have to start spending $1 to $2 billion/yr to merely maintain a data set. That would be a minimum of an additional 7% in operating expenses.
Why would they do that?
If Apple cannot buy or license quality data, there may be no choice. Maps have become a hygiene factor for a platform. Not having them makes a platform repulsive but having them offers no attraction.
Another way of looking at the maps asset is like a component in a phone. A vendor needs a certain class of processor, memory or screen or battery. Not having a minimum level of functionality makes the product uncompetitive but having it does not guarantee success.
What's worse, the market may have been cornered—there may be no suppliers. Unlike hardware components, the maps component is not a commodity with a market of suppliers. The work needed to maintain the maps is a commodity but the aggregation and consolidation of the data is valuable and those who have gained control over the data and they are not likely to license it to any competitors for strategic (i.e. political) reasons.
So we have a perverse situation of a very costly, unprofitable asset requiring duplication of maintenance effort by politically motivated actors imprisoned by their own strategic interests.
If so then it fits perfectly with the mobile telecom industry. Like mobile networks, maps are very expensive and worth very little.
---
Notes:
The revenues that Navteq was obtaining during the 2008/2009 time frame included that from customers such as Verizon, Garmin, Advertising, Traffic services, Microsoft Windows Live services. For the six months ended on December 31, 2008, Europe accounted for 44% of NAVTEQ’s net sales, North America 43%, Middle East & Africa 8 %, Asia-Pacific 2 %, Latin America 2% and Greater China 1%.
—
If you want to learn more about how to analyze technology industries and the evolution of value chains, consider participating in Asymconf.
In the post reviewing Samsung's Capital Structure I noted that its component divisions have historically taken 90% of capital investments and that the overall capital intensity for Samsung Electronics has increased in proportion to its component revenues.
In another post regarding the capital structures of other technology companies with different business models I noted that Apple has changed its capital structure to a significant degree over the previous three years.
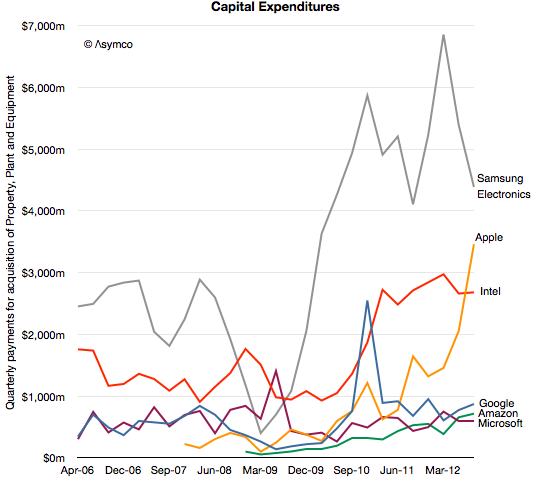
In the following graph I combined these observations to show how capital expenditure patterns may be used to discern the underlying business model.
I would group "cloud" or "platform" based companies like Google, Amazon and Microsoft as a cohort which, although spending significant amounts on capital equipment, do so mainly to support services. Their primary employment of capital is to sustain the infrastructure of data centers necessary to deliver the services underpinning their business models.
I would group Intel and Samsung as "component" based companies which use capital to build production capacity that delivers, hopefully, a control point in the value chains they participate in. Note that I am assuming that Samsung Electronics' CapEx primarily targets semiconductors and displays as it did during the 2006 and 2007 period when data was available.
Therefore, given the patterns over the last six years, it might be possible to classify a company's core business by just looking at its CapEx: The services group showing growth but relatively stable patterns and the components group showing more volatility, macroeconomic sensitivity and an overall higher level of spending, especially as a percent of sales.
The question that pops up then is in what category does Apple fall?
My observations for over a year have been that Apple is increasing its capital spending to such a degree that it is neither fish nor fowl. It operates data centers but presumably does not operate fabrication plants. And yet it spends more than Intel and Google combined.
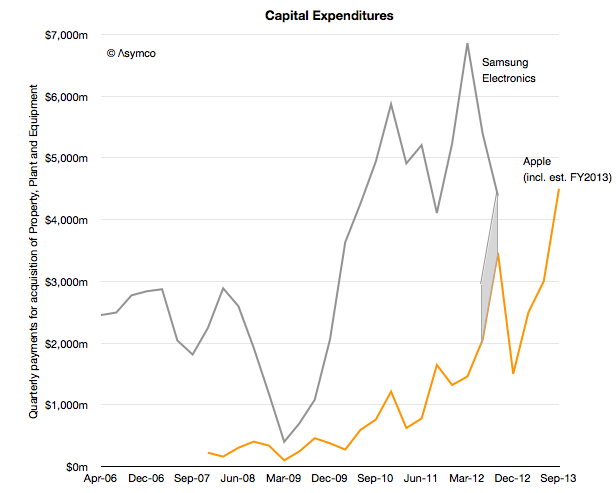
Contrasting Apple and Samsung Electronics tells an even more interesting story. In the following graph I've added two additional items of information: First, although CapEx spending is recorded in the cash flow statement, Apple reported in its yearly (10K) report that it spent an additional $2 billion for equipment which did not pass through cash flow.
If we were to add $1 billion to each of the previous two quarters, the graph would look like this:
The second piece of information is that Apple projected its spending for the following fiscal year. I've added that spending in a pattern matching the last fiscal year.
Apple is still spending less than Samsung. In its fiscal year 2012 Apple spent about $10 billion while during the same time frame Samsung spent nearly $22 billion. However, Apple has begun to bump against Samsung's spending level on a quarterly basis.
I consider this extraordinary evidence of an extraordinary shift in strategy.
For a year we've been debating here to what degree Apple has a "capital intensive" business and what exactly could it be spending capital on. One early hypothesis has been that it's on data centers or on real estate for spaceship campuses. These can be easily dismissed on the knowledge that they can't cost that much (and that the spending happens gradually). Another hypothesis is that the tooling for milled aluminum cases and other mechanical components is expensive and Apple has to buy a lot of it. But, again, the level of expenditure is in the league of Intel and Samsung which make vast quantities of semiconductors in very expensive plants. It's hard to imagine milling machines being cost equivalent to chip foundries.
The comparison with Samsung, whose vast capital commitments are legendary and are its primary strategic asset puts Apple in a new light. Perhaps we can't yet call Apple a semiconductor company or even a fabricator but they are putting their "money where their mouth isn't". We can infer that it's not going where the company currently operates. The capital is being deployed almost silently and, though vast in scale, barely gets a mention from analysts. Not even a single question has been raised at any earnings call about this spending.
So what tale does this capital tell?
One interpretation is to apply the value chain disruption theory and ask whether Apple is acting to counter a potential disruption. In other words, that this is a specific threat response from an incumbent. There is some logic to this because the antagonism between Samsung and Apple is so strong that it might justify a reaction of this kind.
However, I believe that there is a more measured process at work over a long period of time. The one distinguishing advantage and attribute that Apple has is its preference for integration. This preference is not a secret and Tim Cook repeats it often. The integration is evident with their move into retail and component design, in other words in both directions along a value chain. So my hypothesis is that this is part and parcel of an ongoing re-alignment of their role in the value chain.
This second explanation suggests that Apple simply wants to control all the areas which affect the value they produce. First because they feel that there are areas that are not good enough and the product/experience cannot be good enough if its constituent parts are not good enough. Second because without control there are constraints to what it can do strategically.
Whatever the reason, I read the evidence of increasing commitment and engagement in parts of the value chain as part of a continuous evolution of Apple's role. Furthermore, it's something that should be seen as a signal of a new era in how technology companies operate. We see hints of "vertical integration" with Microsoft building hardware, and Google buying Motorola and Amazon selling devices. Apple did all these things and now it casts an eye over the next frontier: components.
---
If you want to learn more about the future of the technology industries and the evolution of value chains, consider participating in Asymconf.
[Samsung's] businesses look remarkably disparate, but they share a need for big capital investments and the capacity to scale manufacture up very quickly, talents the company has exploited methodically in the past.
Samsung's successes come from spotting areas that are small but growing fast. Ideally the area should also be capital-intensive, making it harder for rivals to keep up. Samsung tiptoes into the technology to get familiar with it, then waits for its moment. It was when liquid-crystal displays grew to 40 inches in 2001 that Samsung took the dive and turned them into televisions. In flash memory, Samsung piled in when new technology made it possible to put a whole gigabyte on a chip.
When it pounces, the company floods the sector with cash. Moving into very high volume production as fast as possible not only gives it a price advantage over established firms, but also makes it a key customer for equipment makers. Those relationships help it stay on the leading edge from then on.
The strategy is shrewd. By buying technology rather than building it, Samsung assumes execution risk not innovation risk. It wins as a “fast follower”, slipstreaming in the wake of pioneers at a much larger scale of production. The heavy investment has in the past played to its ability to tap cheap financing from a banking sector that is friendly to big companies, thanks to implicit government guarantees much complained about by rivals elsewhere.
Can we find evidence of this capital intensity?
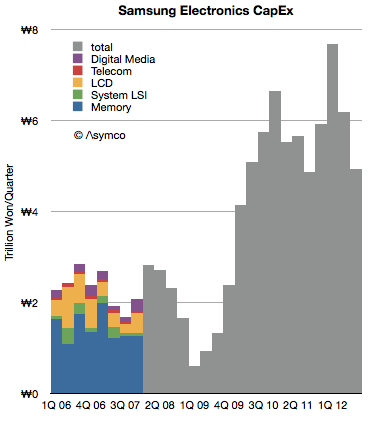
To answer, I reviewed Samsung Electronics CapEx as reported in their quarterly cash flow statements. The following graph illustrates the data:
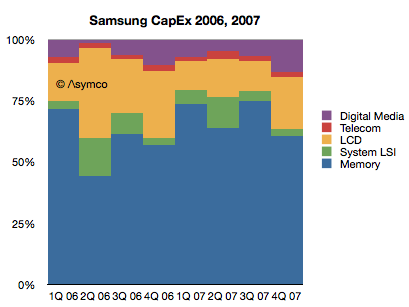
Note that during 2006 and 2007 the company specified expenditures on an operating divisional level. Since 2008 it has reported only a total. For the years where divisional detail is available, the percent split looks as follows.
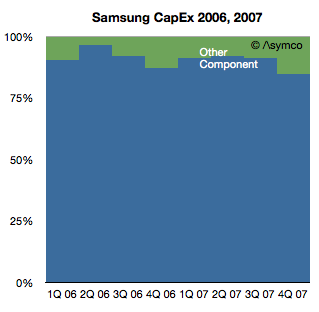
If we combine the Semiconductor division (Memory and System LSI) with the LCD group and classify this as "components" the split looks as follows:
Therefore, for the two years when information was available, the component divisions consumed 91% of expenditures and Consumer Electronics (Digital Media) together with the Telecom (mobile phones, mainly) were a combined 9%. The least capital intensive division was Telecom, the mobile phone group, with only a 2% allocation of capital.
The other observation is that, after a contraction in the recession years of 2008 and 2009, CapEx expanded greatly in 2010 and 2011. [1]
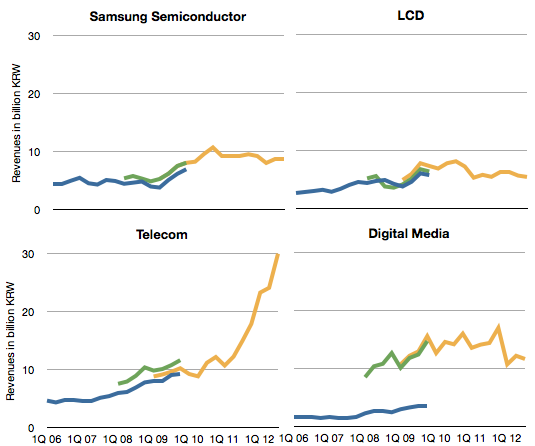
Coincident with the growth in CapEx, the company's revenues grew dramatically as well. However, as the graphs below show, the growth has come predominantly from the Telecom division.[2]
I calculated the correlations between each division's revenues and the growth in CapEx (total) for the time periods 2006 to present and 2008 to present and obtained the same results: The division with closest correlation to CapEx remains the Semiconductor group.
This stands to reason. Capital expenditures are mainly in the service of semiconductor manufacturing. Semiconductors, or components in general, require more capital than assembly of devices or consumer electronics.
However, the revenues and operating income for devices have grown far faster. Samsung's investment in capacity would have been largely profit-free had they not also been assembling the devices which capture the margins.
One might conclude that Samsung would be better off abandoning its capital-intensive components business and focusing on the devices. However, as James Allworth points out if you only do the devices, you may find yourself vulnerable to value chain disruption. Whoever is involved "upstream" in the value chain will inevitably learn the device business from a base of "commodity" manufacturing and pose a threat.
Now the question poses itself: Which of the usual suspects understands this?
Stay tuned for evidence of an incumbent response.
If you want to learn more about the future of the technology industries and the evolution of value chains, consider participating in Asymconf.
---
Notes:
Some of this growth is due to a new (K-IFRS) accounting standard in use after 2010, but the expansion was significant regardless.
The revenues data is was reported using three different accounting methods and each is shown with a different line color: Blue is "Parent basis", Green is "Consolidated basis" and Yellow is "K-IFRS".
What I argued then was that of the problems that Apple had the means to fix, production was what most needed fixing.
Since then we've seen evidence of significant investment in manufacturing tooling, where Apple is effectively purchasing the means of production rather than just renting or contracting it out. This capital equipment investment is the equivalent of owning one of the three asset classes that make up a manufacturing operation:
Tooling or capital equipment. The "Capital" at the root of the concept of "Capitalism".
Skills, talent and knowledge. This is the softer kind of asset that turns out to be harder to replace or buy.
Labor pool. Although considered a commodity even unskilled labor is difficult to obtain if flexible employment is needed in a regulated environment.
It did not stop there. It has also used capital to ensure capacity through pre-orders thereby allowing the skills and labor to be more predictably applied by its suppliers (and preventing competitors from having sufficient supplies). Apple has also taken control of chip design for the vast majority of its CPUs thus building a more bespoke supplier chain.
However these are not enough steps to make production "good enough" to meet the demands of a billion customers buying a new product every other year.
An insidious problem emerges when outsourcing: suppliers tend to become competitors. It happened in the PC industry with Acer vs. Dell. But it's also happening to Apple. Consider how Samsung's foreknowledge of Apple's orders allowed them to anticipate the demand for large screen smartphones. Receiving orders years in advance for memory, screens and CPUs in the hundreds of millions would be a clear indication of demand. Receiving funds with which to build capacity is an enormous help when turning on production for your own versions of the product.
With that knowledge and the capacity built to serve Apple, Samsung was able to go from near zero market share in smartphones to being the largest vendor in two years a feat that Apple itself could not accomplish.
The supplier-turned-competitor is one of the risks of outsourcing production and is at the root of disruption from value chain evolution.
And next year we are going to bring some production to the U.S. on the Mac. We’ve been working on this for a long time, and we were getting closer to it. It will happen in 2013. We’re really proud of it. We could have quickly maybe done just assembly, but it’s broader because we wanted to do something more substantial. So we’ll literally invest over $100 million. This doesn’t mean that Apple will do it ourselves, but we’ll be working with people, and we’ll be investing our money.
For the first time since the 90s, Apple is taking steps to control the last pieces of the value chain it participates in.
It's a baby step and perhaps it's going to remain symbolic, but one can imagine a trajectory for this effort which will pay off as well as retail has paid off ten years after the first Apple store opened.
–
Looking for more information on the renaissance of production and its effect on the technology industries? Then come to Asymconf and take part in the debate.
Samsung's recent success in mobile phones has been spectacular. It overtook Nokia for the top spot in overall unit sales.
It went from having almost no smartphone sales to selling over 50 million units per quarter in a matter of two years.
It now accounts for nearly 40% of all industry profits.
A key decision which made this success possible was to shift its portfolio to smartphones and to offer a large variety of such phones.
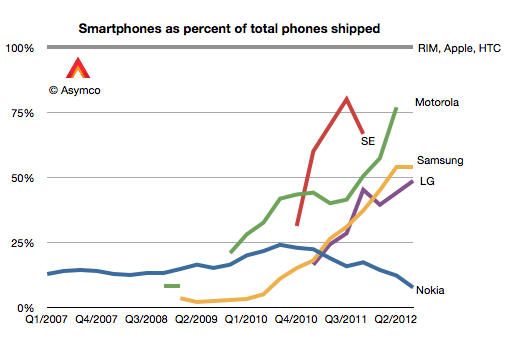
In Q1 2010 only 3% of the phones Samsung sold were smartphones. In the latest quarter the ratio was 54%.
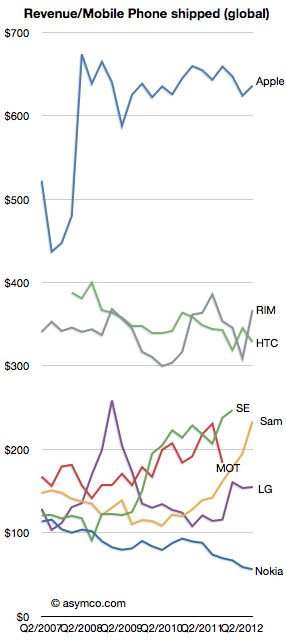
As a result the average selling price more than doubled, from $115 to $234.
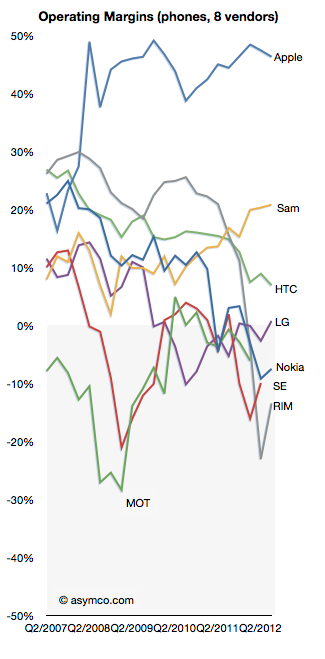
Profit margins also soared in proportion: from 12% to 21%.
All this plus an overall growth in volumes from 64 million to over 100 million per quarter has meant that the company is raking in enormous profits. Not only did it overtake Nokia, the market share leader for 14 years, but is making more profits than Nokia ever did.
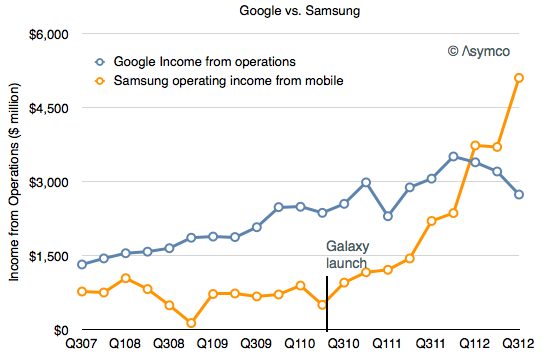
So much profit in fact that it has overtaken Google's decisively.
The reason I point this out is that Samsung's success is dependent on having ridden on the back of Android. Samsung's ascent can be precisely timed to their adoption of Android. The groundbreaking Samsung Galaxy launch was the Galaxy S which shipped in June 2010.
Meanwhile, indications are that "mobile" is causing a contraction in Google's margins.
If nothing else, Android has created a very interesting industry. There are many questions of course: Is Samsung's trajectory sustainable? Why aren't there other vendors successful with Android? Why isn't Google successful with Android? Why isn't Google's Motorola successful with Android? What would happen if Samsung soaks up so much profit from mobile that it's in a position to acquire Google and control the trajectory of their enabling platform?
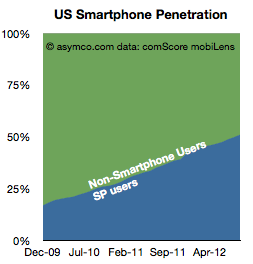
comScore reports that US smartphone penetration has decisively crossed over 50% in August. This should not come as a surprise as the penetration rate has been very linear.
Now that we've crossed this milestone, the thing to watch is the conversion rate from smartphone non-consumption to smartphone consumption.
The reason is that we don't know what "saturation" means in smartphones. We can assume it's at least 80% as about 80% of new phones being purchased are smartphones. What we don't know is how much above 80% it can be. It could be 100% if feature phones simply stop being made but we can't be sure if there will be latent demand and how long this will last (similar to the market for black-and-white TVs after Color became commonplace).
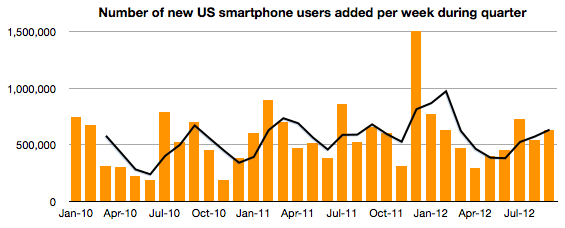
To help keep an eye on this measure, the following graph shows the rate at which non-smart to smart conversion is happening.
It measures the addition of new (to smart) subs each week in a particular measurement period (three months ending the month shown on the x-axis). There is also a 3 period moving average shown as a line. Keep in mind that this shows net new users and therefore excludes smartphone switchers. It's a good measure of how rapidly non-consumers are being converted to consumers.
The data shows that there are as many first time smartphone adoptions in late 2012 as there were in late 2010. Or, the new-to-smart users are joining ecosystems just as quickly when penetration is 50% as when it was 20%. An encouraging situation when considering the opportunity space above 50%. The "S-curve" has not reached an inflection point.
If you're thinking about growth, so far so good. There is however one surprise in the data.
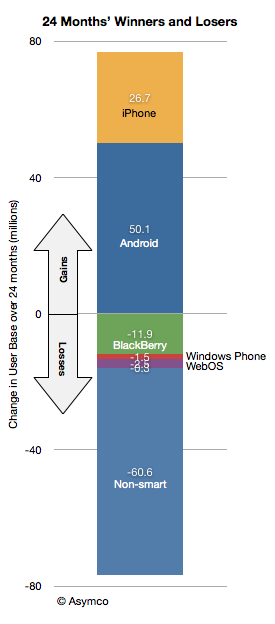
All the growth in the last 24 months (between 2010 and present) was due to Android and iOS. Android added 50 million and iOS added 26 million in the last 24 months. The net smartphone user additions were about 60 million (RIM lost about 12 million, Windows lost 1.5 million and others lost 2.6 million). Android therefore has gained twice as many users as iOS has in this two-year period. Put another way, Android captured 70% of the growth and iOS captured 30% of the growth.
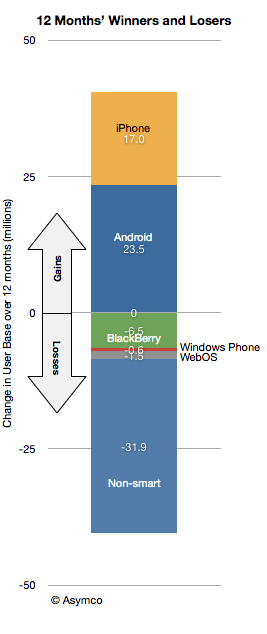
However, if we look at the last 12 months, the split is 23.5 million for Android and 17.0 million for iOS. Android gained 58% of the growth and Apple captured 42%--a change in "spread" from 40 points to 16 in favor of Android.
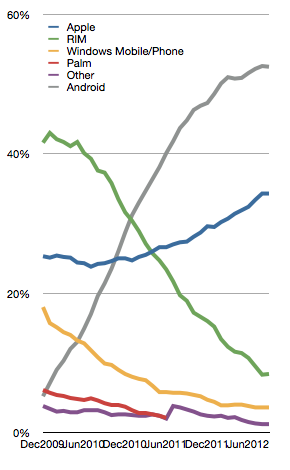
The evidence also shows itself in the trajectory of platform market shares of installed base.
In the last six months, Android share growth is slowing while iOS is still gaining.
If this trend continues then the next 50% may not behave as one might expect (namely that late adopters would take the low-cost commodity offering accelerating Android adoption.) Late adopters may, in fact, be choosier than early adopters. And it's not at the cost of overall growth. Late adopters are still converting at the same rate of the early adopters.
Therefore, paradoxically, the late market shows that the prospect for iOS growth seems strong. Furthermore, as we do reach saturation, perhaps in another three years, the secular growth may end in the US but the loyalty of iOS usage may give iOS another advantage in a market where growth is determined by "platform churn"
The US is the crucible of the phone market in many ways so what happens in the US may be a harbinger for what happens world-wide.