Asymco

Asymmetric Intelligence

Industry

  1. Hey Big Spender

    Research · 64 comments

    In previous posts I described the patterns of asset value growth for Property Plant and Equipment at Apple and how that change has been thus far correlated to the production of iOS devices.

    The analysis was based on looking at the declared value of the PP&E assets on Apple's balance sheet. These values include depreciation so they reflect not only the "spending" on new assets but also the value lost due to wear and tear. As such it's not a perfect measure of investment.

    The better approach is to use declarations on the cash flow statement. Apple reports a specific cash flow related to PP&E: Under Investing Activities, Payments for acquisition of property, plan and equipment.

    In the latest 8-K the amount for the 12 months ended September 29 the value was $8.295 billion.

    Compare this with the statement in the Annual Report from one year ago:

    The Company anticipates utilizing approximately $8.0 billion for capital expenditures during 2012, including approximately $900 million for retail store facilities and approximately $7.1 billion for product tooling and manufacturing process equipment, and corporate facilities and infrastructure, including information systems hardware, software and enhancements.

    Compare also with the PP&E net asset value on the Balance Sheet currently at $15.452 billion but valued at $7.777 billion a year ago (an increase of $7.7 billion).

    This means that Apple intended to spend $8 billion, actually spent $8.3 billion and realized a net asset gain (after depreciation) of $7.7 billion.

    So there are no major surprises. The spending was only about 4% above expectations a year earlier.

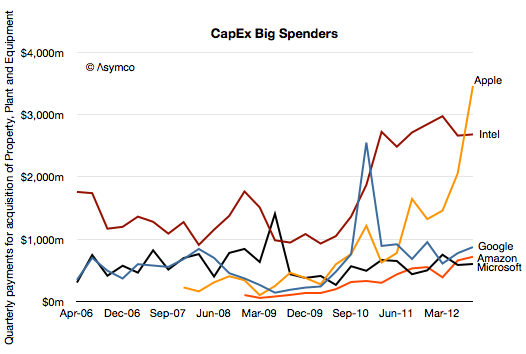
    The other pattern to observe is that the spending rose dramatically into the fourth quarter. The fiscal quarterly spending was:

    1. $1.32 billion
    2. $1.46 billion
    3. $2.06 billion
    4. $3.46 billion

    I illustrate this pattern (and previous quarterly spending) in the following chart.
    The question remains what is this $8.3 billion being spent on?

    To help answer I also added the comparable spending (from cash flow statements) of a few other technology companies. Google, Amazon and Microsoft have been spending in the same range of $500 million per quarter. Over the past eight quarters the average spending of these companies has been:

    • Amazon $487 million
    • Microsoft $583 million
    • Google $800 million

    Intel is different. Its average spend level has been $2.6 billion/quarter.

    But Apple has just spent about 30% more than Intel. And it spent three times in Q3 than Google, 4.8x Microsoft and 3.8x Amazon.

    The level of spending and growth from a far lower level implies to me that Apple is spending primarily on process equipment (aka tooling) rather than servers. Data centers are expensive at $1 billion for a large one, but they are not being built fast enough to account for $3.5 billion in one quarter.

    Note that Apple's CapEx is above that of Intel whose fab-based semiconductor production method is known as particularly capital intensive. And Intel's Capital Expenditures have been increasing to all-time highs.

    If Apple spent at Google levels on server infrastructure it would only be spending a quarter of what it's actually spending. If Apple spent on production at Intel levels it would only be spending three quarters of what it's spending.

    In other words, Apple is spending at the equivalent of one Intel of fabrication and one Google of server infrastructure.

    In a few days we will learn what the plan for expenditure for fiscal 2013 is. Historically, the company has roughly doubled spending for each year of the iOS platform. If that continues then Apple will be spending the equivalent of several Intels and several Googles.
  2. Nokia's price for exclusivity

    Research · 47 comments

    Days after Nokia announced the end of life for the Symbian platform I wrote a post titled Who will buy the next 150 million Symbian smartphones? The reference was to claim by management that before there would be a complete transition to Windows Phone, 150 million legacy Symbian phones would be sold, keeping the company financially stable before the new ecosystem took root.

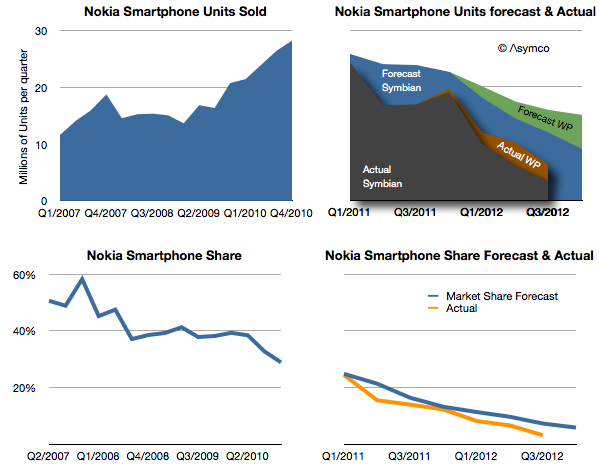
    I reproduce the original forecast I made below with the addition of what actually happened.

    [Note that the Actual stack area chart is independent of the forecast area chart as indicated by shading.]

    My forecast in early 2011 was based on the 150 million Symbian phones being sold over a two year transition period. The implication with the forecast for Windows Phone was that this would still lead to a difficult contraction of volumes.

    As it turns out, only 96 million Symbian devices have been sold in the 7 quarters since the platform was deprecated. It's unlikely that there will be ever by 150 million units sold as last quarter only 3.4 million shipped. In any case, management has already retracted that claim.

    What about the Windows Phone forecast? It turns out that by this point in time (Q3 2012) I had expected Lumia shipments to total 9 million. Actual shipments reached about 9.5 million, so not bad. However, the market grew faster than I had expected and overall Nokia smartphone market share turned out to be slightly lower (6.3% in Q2 vs. 10% estimated.)

    The just ended quarter shares are not yet available but it's quite possible that overall Nokia smartphones could be well below 5%, and may slip to 3% during the transition period.

    My warning in February 2012 was that 150 million Symbian units would not ship since I expected there would be a stigma associated with the products among distributors, even if consumers were fine with them (which they weren't).

    The public execution of Symbian (and any other alternative being developed inside Nokia) will probably be a classic case study in disruption management. To wit: even if a platform needs to be led out to pasture, there are ways of managing decline other than suicide. Nokia's failure is not so much having chosen the wrong alternative to Symbian, but having chosen exclusively.

    However, there's a twist. The company did not accept exclusivity of one supplier without a concession: In exchange for exclusivity, Nokia negotiated $250 million every quarter in the form of "platform support payments" from Microsoft. Nokia has to date received over $1 billion in such payments. (For the last quarter that amounts to $86 for each Lumia phone shipped.)

    The tragedy comes from this $1 billion/yr not being enough. The foregone revenues from Symbian (assuming they had been able to maintain the decline to the level of 150 million units that they had originally forecast) would be about $9 billion. This means that had Nokia not knifed Symbian and had sold the shortfall units at an average price of $200 they would have received an additional $9 billion in sales. Furthermore, assuming a margin of 33% for those units, Nokia received from Microsoft one third from of what she gave up for exclusivity.

    In other words, the net cost of the Microsoft exclusive relationship is at least $2 billion in operating profit.

    This turns out to be the difference between being profitable and being distressed.

    We will never know if this scenario would have ever happened, but the forecast management made 21 months ago suggests that at least they thought this was what they were going to get out of the bargain.

    This reminds me of another article posted around the same time.

  3. Nokia's Lumia brand strategy for the US

    Research · 29 comments

    Last July I asked the question "How many Lumia phones were shipped in the US?"

    My answer was 630k through the first half of this year.

    I revisit this question following Nokia's latest quarterly report.

    As a quick review, Nokia reported the following performance for its mobile phones operations:


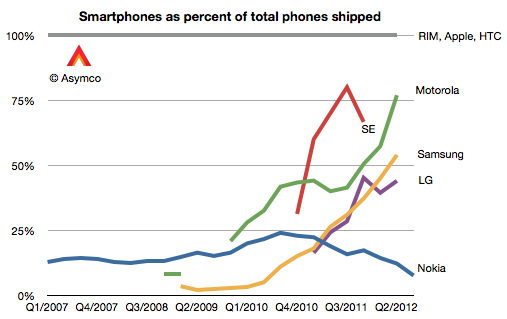
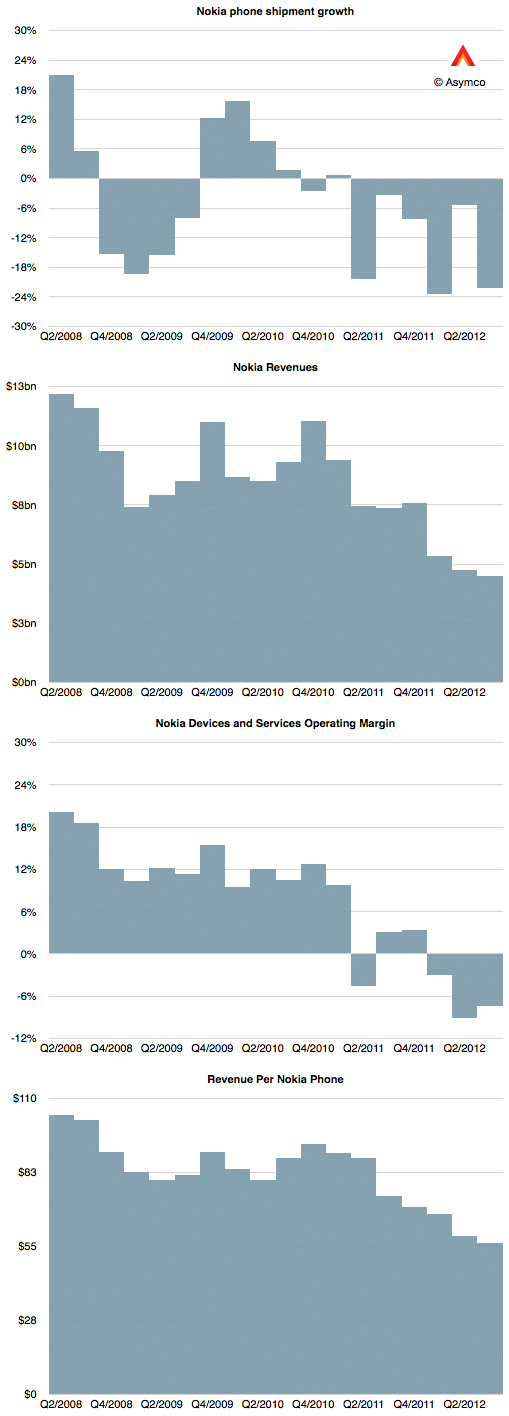
    The most worrying thing of all however is that Nokia's smartphone performance has collapsed. With only 6.3 million units shipped, the company may be the worst performer among eight competitors I track. They were below RIM's shipment total.

    The value of 6.3 represents only 7.6% of their overall phone shipments.

    As the graph above shows, Nokia is going in the wrong direction with respect to moving to a smartphone portfolio.[1]

    Of the total 6.3 million smartphones (aka smart devices, as per Nokia's reporting nomenclature) 2.9 million were Lumia Windows Phone units.

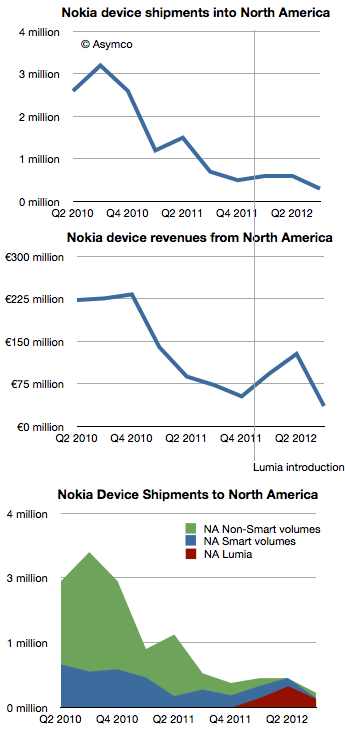
    Using information about average selling prices and total volumes into North America, I was able to estimate that there were about 180,000 units sold into North America during the last quarter.

    Since launch, my estimate is that Lumia has sold 810k units in the North American market.

    This cannot be seen as a good performance. There are mitigating factors such as the lack of upgradeability to Windows Phone 8 which probably deflated demand[2]. However, it's a poignant observation that during the last quarter the US reached 50% smartphone penetration by users. As traction is still absent from both Nokia and Microsoft in the US market, we are back to the question of how to compete.

    As the market in the US transitions from competition against non-consumption to competition among rival platforms, the Lumia brand is being forced into targeting smartphone "switchers" rather than smartphone "adopters". The switching option is expensive, requiring aggressive advertising (see Samsung Electronics' $11 billion ad budget).

    There's only one source of cash for that sort of strategy.

    ---

    Notes:

    1. The caveat is that they market some of the Series 40 phones are "smartphones" on the basis of having "smartphone-equivalent" performance. However, smartphone equivalency is and has been purely subjective. On that basis there were many times in the last decade and a half that we could have counted Java-based or BREW-based or i-Mode-based phones "smartphone-like". Smartphone has been defined on the basis of running an operating system with native APIs for developers.
    2. I imagine that the upgrade path could have been known to Nokia, AT&T and Microsoft nine months ago when the Lumia was unveiled for the US by the three CEOs and therefore expectations could have been modulated accordingly.
  4. iOS portfolio price distribution

    Research · 35 comments

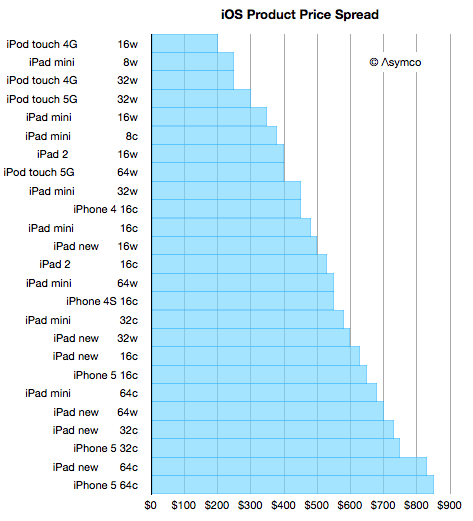
    With the iPad mini launch imminent, it's time to think about the expanding iOS portfolio. We don't know how much the "mini" will cost or what variants will be available but I took some rumors as a basis to form a hypothesis.

    The idea is that there will be 24 variants which have three dimensions:

    • 2 colors
    • 4 capacities
    • 3 radio chipsets

    The starting point would be $250 for an 8 Gb WiFi only model and increases of $100 for each doubling of capacity and $130 for the addition of cellular chipsets.

    The results would slot into an increasingly broad price spectrum. I included all the models of iPod touch, iPhone and iPad that we already have available and built the following graph.


    The number after each product name is capacity in Gb and the letter "w" signifies Wifi only and "c" signifies WiFi and Cellular.

    You can look through the list and see whether products of comparable prices are "competing for a purchase decision" or whether there is some marketing logic to the arrangement. I consider the purchase decision not to be determined by price but by many factors like the job being offered by the product.

    But in many cases buyers have a budget and are looking to fit a product into that price. This is more common when the product is a gift.

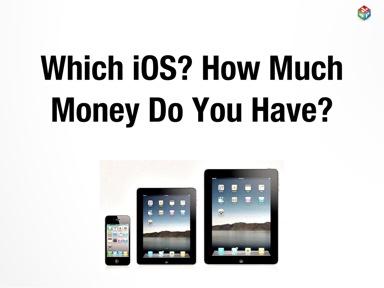
    So with that in mind I created a quick motion chart in Perspective to answer the question: Given a budget, how much iOS device can you buy? You can "dial in" various price points and see what products are available with graphical representation of capacity.

    If you are on an iPad and have Perspective, you can launch the story (with voice-over) through the following link:

    Which iOS? How Much Money Do You Have?.

    If you're not an iPad but have one click on the "Send e-mail" to get a link in your inbox and open it on the iPad.

    If you don't have an iPad but have an iPhone, stay tuned as an iPhone version of the app will be ready soon.

  5. The Crucible of the Phone Market

    Research · 34 comments

    [The following was originally published on LinkedIn.]

    The US is in the forefront of smartphone usage. This has not always been the case. Five years ago only 3 percent of US phone users were using a smartphone, lower than the global average. At the time Palm and BlackBerry were the prominent devices in the US while in Europe Nokia's push with Symbian and Microsoft's licensing of Windows Mobile led to a smartphone adoption rate of about 7%.

    All that changed with the iPhone. After 2007 the US began to rapidly catch up and eventually overtook all other regions in terms of smartphone adoption. The latest data from comScore Mobilens shows that the US is now effectively 50% penetrated. The following chart shows just how quickly this happened.

    Image (media01.linkedin.com)

    In December 2009 only 17% of Americans used a smartphone as their primary phone. As of August the total reached 49.8%. By today the US is effectively a majority smartphone usage country and it looks like there is no slowing. We might very well see the US reach saturation with 80% smartphone usage in another two years.

    Of course, the US is not the first country to reach this threshold. Some northern European countries were there earlier, but North America is the first major region to get there. That means over 115 million smartphone users in one market. As a result, the US has become the crucible of the whole smartphone market. It's where platforms are most concentrated in use and therefore the most sensitive to the effects of that usage. That leads to more innovation, more discovery of new use cases and more ecosystem growth. Quite simply, it's where competition is most heated.

    This prominent position implies that the US could now be seen as a leading indicator of global trends. It might allow a keen observer to predict what will happen from US data. So what does the mobile platform rivalry look like in the US?  We are fortunate because the data is finely grained in the US. We have montly updates from comScore and we get specific platform penetration data. The following graph shows the shares of the major platforms since late 2009.

    Image (media01.linkedin.com)

    It becomes immediately evident that BlackBerry has lost a huge part of its user base to Android and iOS. In 2.5 years share when from about 42% to 8%. In raw numbers that's 11 million users that switched to another smartphone.

    Looking closer you can also see a consistent growth in share for the iPhone since mid 2010 with a slightly higher rate of increase of share than Android in the last few months. The problem is that this pattern of rapid decline in RIM and moderating growth in Android is not necessarily mirrored globally.

    RIM just reported an increase in total users during the last quarter (from 78 to 80 million subscribers.) Google also recently reported 500 million Android activations globally with no apparently letup in growth.

    So there seems to once again be a disparity between the US and global platforms. Do we take the US market to be anomalous or is it a pre-cursor to global trends?

    Certainly the US market is in many ways unique with a very low rate of pre-paid usage and a relatively high ARPU and average device pricing due to subsidies. However, the global trend has been to increasingly mirror the US not vice-versa. The iPhone has radiated out of the US in terms of usage and so has Android. Attempts by other platforms to make inroads in the US have been unsuccessful. Symbian failed to gain a foothold and it seems Windows Phone is stumbling as well. Both of these platforms have had more success outside the US. The US operator subsidy model has also been "exported" more than pre-paid has been "imported". By 2007 Europe was moving away from subsidies as prices of feature phones were coming down and 3G was still in its infancy. That was reversed as the large screen smartphones became the device of choice. In addition to device and operator trends, most apps originate in the US and the major social media platforms are all American-based. In other words, the modes of usage are being conceived in the US.

    On the other hand, the US is still a tiny percent of total consumption. It represents only about 6% of all phone users. Chances are that prices for devices in the US (especially the iPhone) can't be sustained for 5 billion consumers. Then there are "cultural" considerations where regions cling to their own usage habits and perceptions of value.

    So it's still an open question of whether the US is the leading indicator for how platforms might change globally but I would watch this data very carefully. When it comes to mobile platforms, it might be that if it plays in the US it will play globally.

  6. Reverting to the mean

    Research · 40 comments

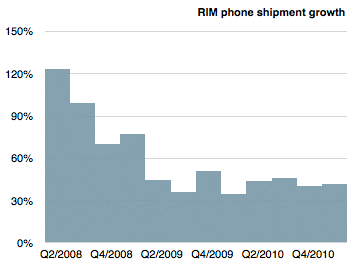
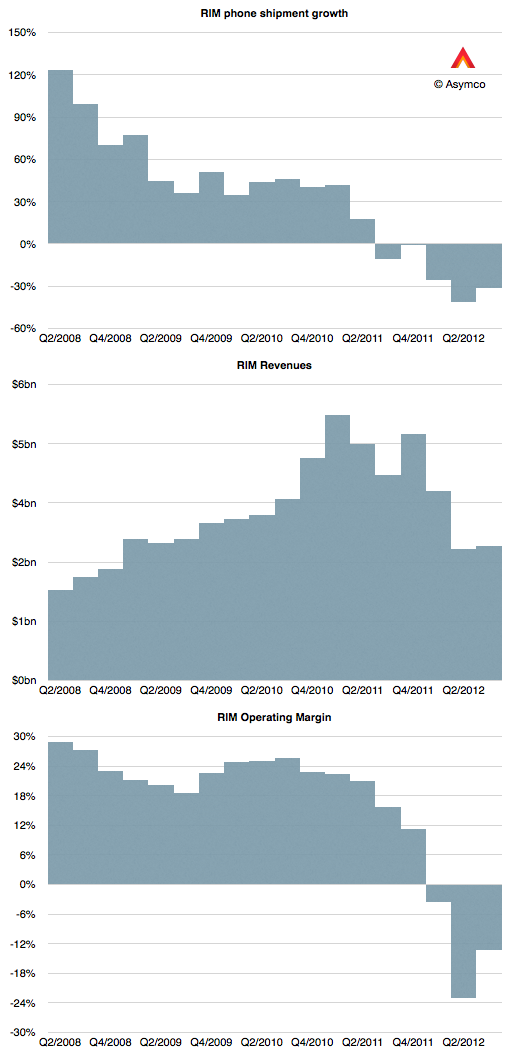
    Quarterly financial data is often a lagging indicator of strategic success. RIM's vital signs were exceptionally strong up until early 2011. Consider the following graph showing RIM's device growth.

    Using language commonly heard among analysts, one would say that the company was "reverting to the mean" and growing nearly in-line with the market. In other words, exceptional growth was over but continuing growth was likely. The company was returning to something "normal."

    However, keen observers of the market would have been hard pressed to find any reason for justifying that performance. Seen through a disruptive lens, it was evident as early as 2008 that RIM's strategy was not sustainable. The company had a very weak smartphone product relative to emergent iOS and Android ecosystems. And yet, the company continued to prosper for nearly three years, through 2008, 2009 and 2010. Those shorting the stock during this period would have been unrewarded.

    But then in early 2011 it fell off a cliff.

    There was no reversion to the mean but an acceleration toward oblivion. The share price dropped to book value or below liquidation.

    This pattern was very similar for Nokia. It too looked fairly strong on paper until early 2011 when it found it necessary to fling itself off a platform.

    This pattern of disproportionate decline is a mirror image of the disproportionate ascent of Apple.

    It might sound like a spectacular story; an anomaly, a once-in-a-lifetime reversal of fortunes. However, the moral of this story is that this is not an exceptional phenomenon. Disruption happens. It happens quickly and perhaps most quickly in this industry, and looking at trailing indicators like revenues and profits is of no help. I've only witnessed sharp expansions and sharp declines. I've never witnessed steady state, quiescent markets in technology. The history of platforms is always virtuous cycles followed by vicious declines. Whatever amplifies success seems to also amplify failure.

    Rather than assuming that businesses are in a state of average growth or in some anomalous state above or below that average (from which they'll recover) we need to think of them being either growing or failing. Going straight up or straight down.

    If this is the case, how can anyone expect to manage this? Orthodox management theory assumes continuity but the world seems discontinuous.

    In a discontinuous framework it's important to look for unfair, unsustainable advantages that can be capitalized. Once exploited the advantage often disappears. The victim assumes it becomes sustainable. The survivor looks for another advantage. Resting is not an option and the mean is only an illusion.

  7. The Interlopers

    Research · 47 comments

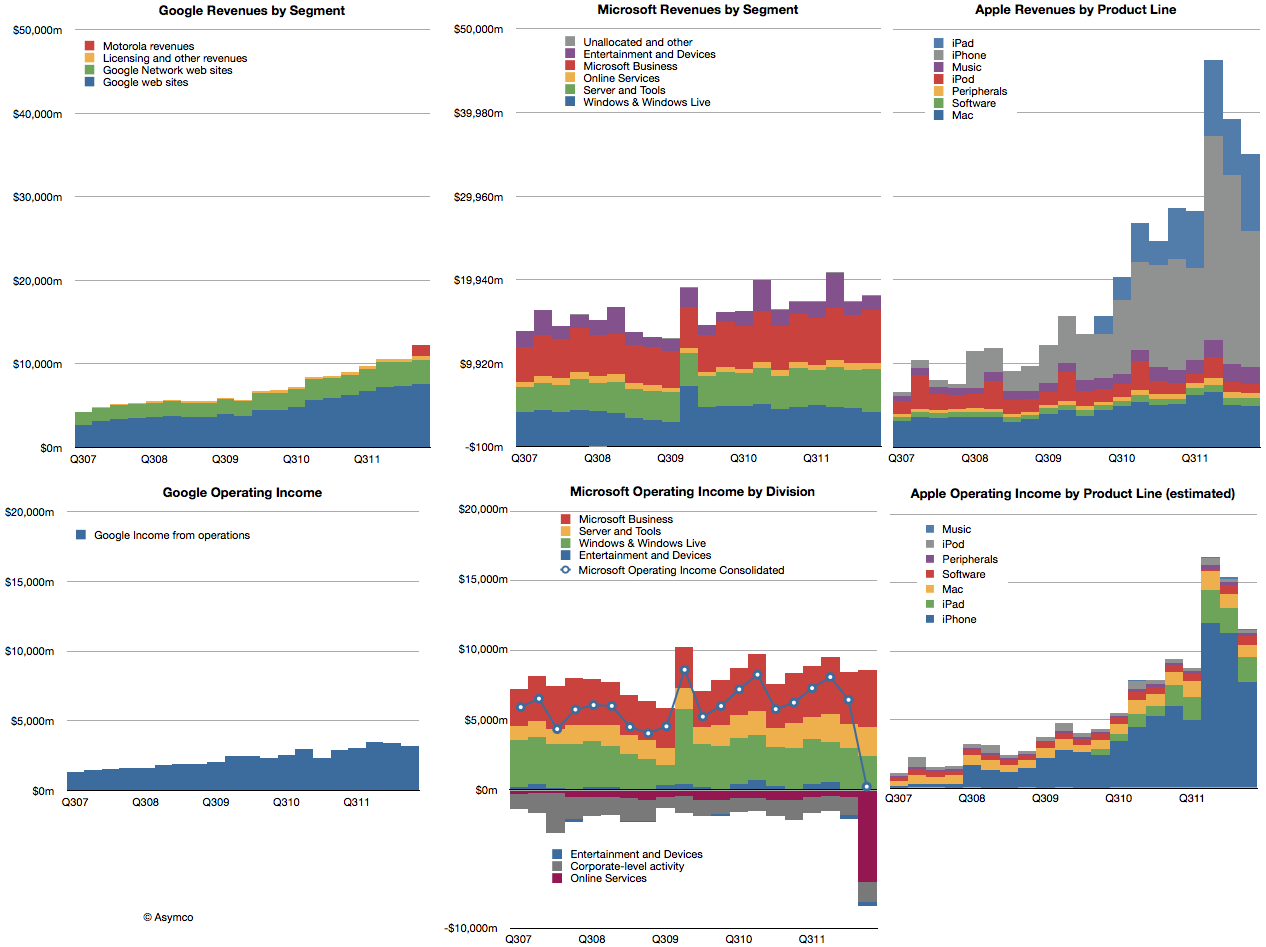
    Google, Microsoft and Apple all had reasonably good second quarters. Microsoft's revenues grew by 4%, Google's by about 22% and Apple by 23%. Apple's growth was disappointing but the other companies weren't. The revenues for the three companies are shown in the following charts:


    I also showed the performance of each company's operating income in the bottom three charts.

    Microsoft did declare a one-time write-off of $6.2 billion which it spent on aQuantive a few years ago. That was booked as contributing to a loss of $6.67 billion for its Online Services division. Without that one-time charge consolidate operating income would have grown at about 3.6%. Google's operating income grew at a rate of 11% and Apple grew (again, disappointingly) at 23.4%.

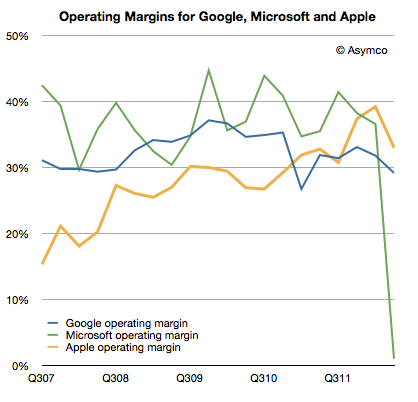
    Apple's operating margin fell to 33.1% while Google's fell to 29.2%. Microsoft's margin evaporated due to the one-time charge. If we back that charge out, the margin would have slightly topped 35%.

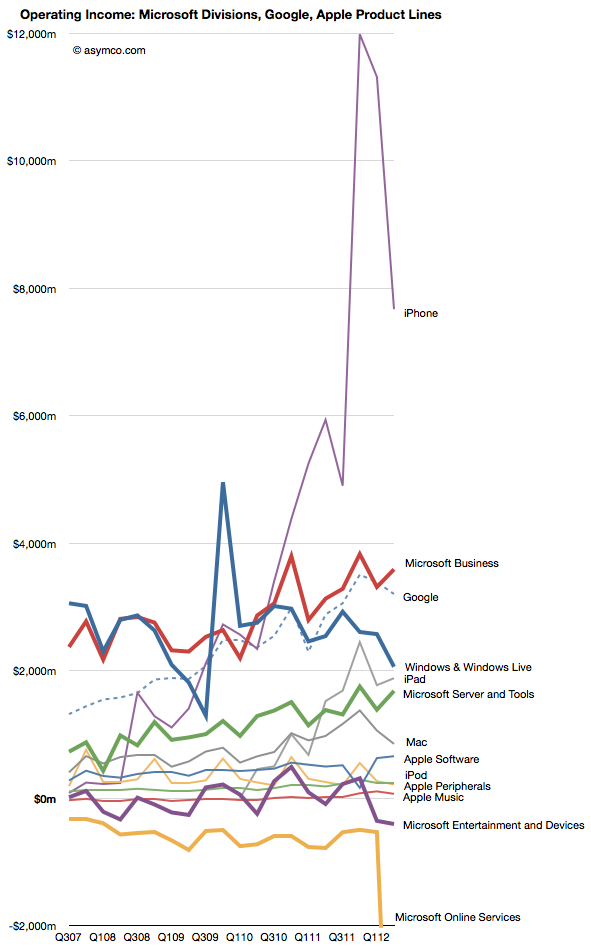
    Comparing the contribution (in operating income) for each division or product line (where possible) gives the following view:

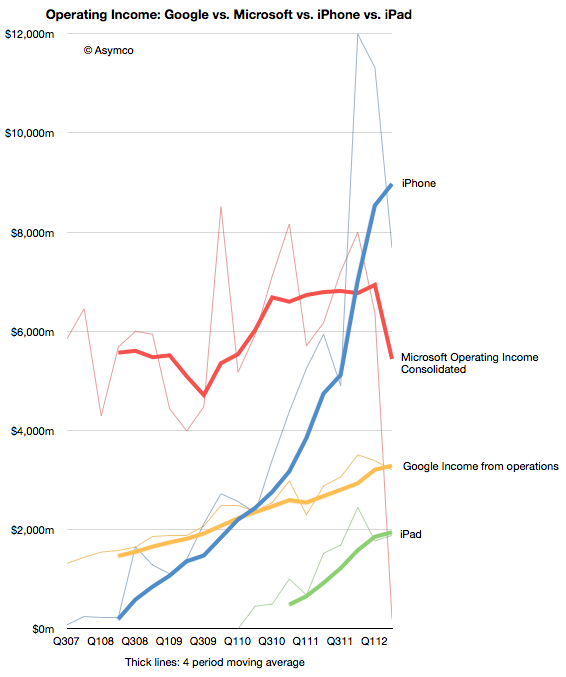
    I tried to remove some noise by isolating the iPhone and iPad and consolidating Microsoft overall and Google.

    By also smoothing out seasonality with a four-period moving average we can observe the pattern of growth for the iPhone and iPad relative to the other companies' overall performance.

    The crucial question remains if and when the iPad will be a bigger business than Google and/or Microsoft. The iPhone climbed over both some time ago.

  8. It’s costly and has unpredictable consequences

    Research · 25 comments

    ``It’s costly and has unpredictable consequences. That makes it a very bad business model. I suppose both companies have agendas that are not visible in court and perhaps Apple is signaling to other parties, and perhaps Samsung is using it to raise its profile. It still seems that unintended consequences may arise and the result could be very bad for everybody,’’ said Horace Dediu, founder of equity-research firm Asymco, in an e-mail interview with The Korea Times.

    The above was a quote from the article  Samsung can’t afford to lose Apple fight by Yoo-chul Kim from The Korea Times. Yoo-chul contacted me via email with a series of questions. I want to share all his questions and my answers as well:

    Samsung wides market gap with Apple, according to research firms. You think the gap will further be widen and please tell me why

    As Samsung converts its phone portfolio to be all smartphones, it is very likely to reach much higher smartphone volumes. One year ago Samsung sold about 56 million feature phones. Last quarter it sold about 43 million. The smartphone portion increased from 20 million to 50 million. At the same time, Apple has maintained a growth in its smartphone business of about 100% on a yearly basis. I expect that to continue into 2013 as well. Therefore it's possible that Samsung could sell 290 million smartphones in the next 12 months and Apple could sell about 200 million in the same time frame.

    However, it's important to understand that the companies compete on different bases. What I mean is that what generates a profit (i.e. payment by the consumer above what a product costs) is different for each company. Apple is a platform company that sells access to the iOS ecosystem across many other device types. Samsung sells consumer electronics with limited "network effects" but desirable features. In this view, the gap in device sales is "asymmetric" and not reflective of the actual competition which is between Google's Android and Apple's iOS as forms of access.

    Samsung's rapid rises mainly due to the company's heady dependence
    on Google Android. If Google applies better software for Motorola,
    then you think Samsung will face difficulties?

    Think of Google as a supplier to Samsung. No manufacturer wants to have a situation where they are dependent on only one supplier, especially when there are huge substitution costs for another supplier. And even more especially if that supplier owns one of your competitors. However, it's unlikely that Motorola will become a strong competitor to Samsung. I also don't expect Google will damage their OEM "customers" by favoring Motorola. Motorola can't become big enough quickly enough to be a threat to Samsung. What is more likely to be a problem for Samsung is ZTE and Huawei. They are on the same trajectory that Samsung was on 10 years ago. For Samsung to beat them in the future it will need to develop products that nobody can copy.

    How about software? Samsung is good to roll out price competitive
    models, however, software is always problem. Any advice for this
    issue?

    Software is hard and expertise can't be quickly acquired. It takes time. Only advice [I have] is that efforts must be patient and there need to be many experiments like Bada and Tizen. Google started with Android in 2005 and Apple started with iOS in 2003 or 2004.

    How about the patent dispute with Apple and Samsung. The patent war
    is helping Samsung see a rise in its brand awareness and that also
    worked for Samsung to grab more shares in smartphones?

    It's very difficult to measure the impact of litigation, both in the positive and negative. It's costly and has unpredictable consequences. That makes it a very bad "business model". I suppose both companies have agendas that are not visible in court and, perhaps, Apple is signaling to other parties and perhaps Samsung is using it to raise its profile. It still seems that unintended consequences may arise and the result could be very bad for everybody.

    Samsung wants to become a market creator not just a fast follower.
    For me, it's quite negative for Samsung to create a wholly-new
    eco-systems because Samsung's edges are coming from manufacturing, not creative thinking. What do you think? If Samsung wants to be a
    creator, what conditions should Samsung need and what things should
    the company do?

    Unfortunately, manufacturing excellence is not enough to remain successful long term. US companies were successful, then the Japanese, Taiwanese, Hong Kong, and now Chinese. Companies either adapt or become irrelevant. Building ecosystems is the new basis of competition but it's not the only option. Unfortunately we don't know what will be necessary to build the next basis. What matters is experimentation and the building of new businesses. I can't offer specific recommendations as there is no recipe book for how to create new markets.

    For your views, who is much better so far since the trial has begun
    in the US. Samsung or Apple?

    I cannot comment on this. Performance in court can only be judged by those present and I'm sure everybody present disagrees.

    You think Apple is enjoying its so-called a homeground advantage
    for the trial and is there any possibility that the issue to go for
    the highest court in the US. My Samsung contacts say that's the
    possibility, though.

    Again, I don't have an opinion on legal matters. Broadly speaking, IP litigation is similar to playing the lottery.

    Need your perspectives about Google's support for Samsung. Google
    confirms its supports for Samsung for an united front against Apple
    because the fight between Samsung and Apple is a kind of version that
    represents Google and Apple fight.
    Any comments about that?

    I believe Google does support Samsung. I question however how this relationship will develop over time. I attached below commentary from a researcher at Deutsche Bank on Android in China. I think it has some clues about how Google treats its partners.

    What are pre-conditions before Samsung making an action to sign a
    peace treaty with Apple?

    It depends on the motives behind Apple's actions. I think they want to see a "no copying" rule. They don't mind competition and Android could be a help in the long run by moving users from feature phones to basic smartphones which could later be upgraded to Apple phones. But what I think they want is to signal to others that direct copying is unacceptable. Essentially, the work of their designers is very important to them and copying destroys [the designers'] incentives to do breakthrough products.

    ---

    See also: Who Cares If Samsung Copied Apple? by James Allworth - Harvard Business Review

  9. Are Apple stores overstaffed?

    Research · 45 comments

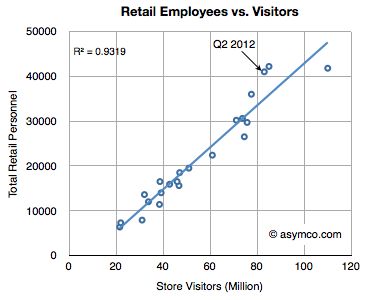
    ifoAppleStore's Gary Allen alleges that John Browett, head of Apple Retail, felt the stores were "too bloated". He cites "numerous tipsters" that Browett ordered a reduction in the number of employees. As the information on employees and visitors is public, we can quickly test the assumption.

    The following graph shows the relationship between Retail employees and Visitors on a global basis.

    The total figure for the last quarter was 41,000 employees for 83 million visitors. This is above the expected ratio as shown by the line shown in the graph. Reversion to that line would imply that about 35,000 employees should have sufficed during that quarter.

    However, Apple's business is cyclical and employment is not--or at least not on the same frequency of cycle.

    During a slow, transition quarter, there will be over-employment and during a rush holiday period there would be under-employment. Consider the right-most point in the chart. It represents Q4 2011 when there were 110 million visitors and only 800 more personnel than during the last quarter.

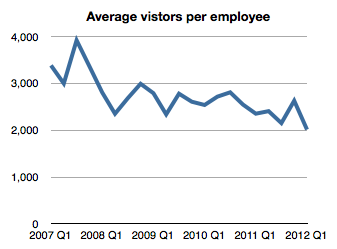
    Overall, this ratio of visitors per employee has been relatively steady, though declining.

    Perhaps the company should check this decline. Perhaps the company has not been able to match demand with supply as well during the last six months. Perhaps they are overstaffed. However, I doubt that there has been a decision to reduce the overall level of service offered. Or that service is not paramount.

    The accusation that employment is being sacrificed for the sake of profits seems disingenuous. The stores were never designed as a profit center. They have to be profitable in the sense that they have to justify themselves. But we need to recognize that they rely on a brand and product mix that is unique to that store. In return, they are designed to sustain that brand and offer a service rather than merely a sales channel.

    For the head of the division to misidentify this fundamental purpose for the operation would be catastrophic and I would expect a lot more evidence to support such an extraordinary claim.

  10. American exceptionalism

    Research · 45 comments

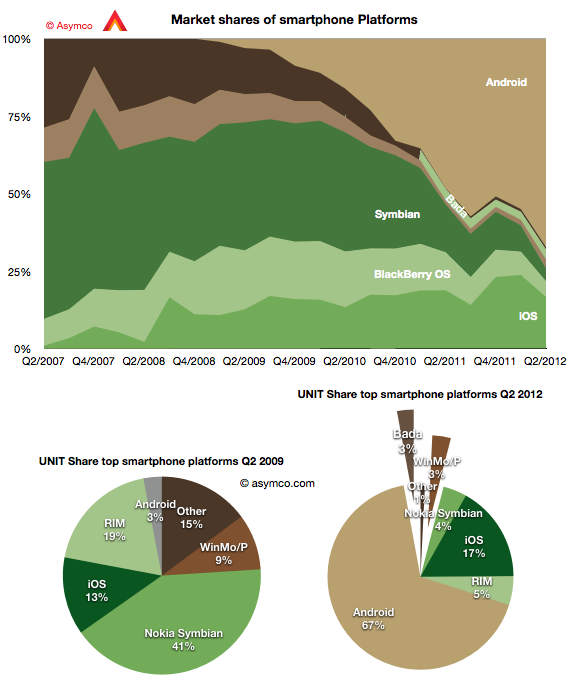
    The second quarter showed continuing growth for Android with 19 points of share growth from a year ago. Only Windows Phone showed a gain y/y in share up 1.6 points to about 3%. In the same time, Bada lost half a point, iOS lost 2.1 points, RIM lost 7.2, Symbian 11.4.

    The result is shown in the graph below:

    I also show a "before-and-after" pair of pie charts which show the difference in smartphone platform market share from the same quarter three years ago. Android went from 3% share to 67% while Symbian went from 41% to 4% and RIM went from 19% to 5%. iOS increased its share from 13% to 17%.

    If this trend continues Android could reach 50% of all phones sold in a few years. That's a run rate of 200 million per quarter. And it's likely that 100 million of those will be shipped by Chinese vendors.

    However, looking at the global picture can also miss some important trends in local markets. Had one looked at the global smartphone business in 2005, the conclusion would have been that Symbian would be the dominant platform in perpetuity.

    What affected the global market was a change in the US: the launch of iOS and thereafter of Android. The US, a smartphone backwater until then, became the most vibrant market and today it's the most penetrated and has the highest ratio of smart to non-smart of any of the major regions.

    The curious thing about this vast market is that it's still not truly open. There are technology and political reasons why some platforms are permitted to sell in one region or not. The iPhone is not available on either the largest Chinese operator or on the largest Japanese one. It's largely absent from India because of distribution (i.e. subsidy) and much of South America. Even in the US, the iPhone is still, after five years, not available on one of the top four operators and has only reached another less than a year ago.

    What intrigues me is what would the market look like if distribution were not an issue. What if there was equal choice to all buyers. We can't test this question directly but we can ask. But there is some pattern we can look at in the US data. Thanks to recent revelations at the Samsung vs. Apple trial we can see the effect of increasing distribution in the US.

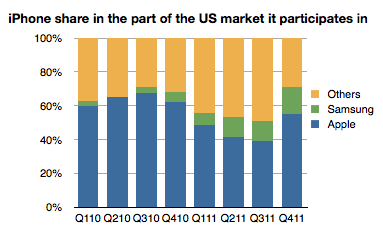
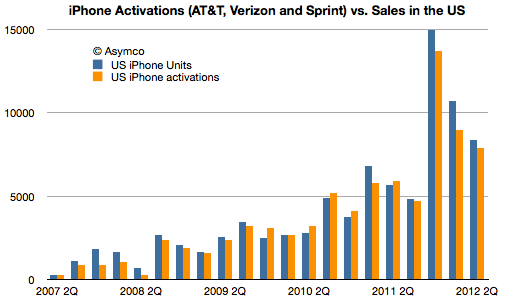
    The data on smartphone market share by carrier can be blended with data from carriers about iPhone activations (which are a proxy for sales, see note below) to give a more precise figure of market share in markets where iPhone participates.

    For example, when the iPhone was only available on AT&T, one could measure iPhone market share vs. the global smartphone market, or the US smartphone market or within AT&T alone. Some assumed that the AT&T share would be reduced once the product would become available on Verizon or other US carriers. However there was no appreciable drop. Share in Q4 2010 was 63% at AT&T and it was 63% a year later after the iPhone was available for four quarters at Verizon.

    So the share of iPhone within those operators which carry it tells a story independent of distribution.

    The following graph shows the share of the iPhone vs. Samsung in the market defined by its availability. (I.e. the volumes of smartphones sold by AT&T throughout the time period, Verizon Q1 2011 to end and Sprint in Q4 '11).

    The share of iPhone thus defined shows a slight decline but it's an overall number that is remarkably resilient as distribution increases and is remarkably high overall. Note that globally, the iPhone gets only about 17% share of smartphones--a value that has not varied greatly since mid 2009.

    So at least in the US, on carriers where it's available, the iPhone is holding on to a significant share. In a global market it's expanding distribution but not yet covering the world. As a consequence it's keeping up with overall market growth and staying between 17% and 20% share.

    The big question is what will happen if and when its availability matches that of Android in terms of points of sale. Or even that of BlackBerry or Symbian. Is America a different market from the rest of the world? It was different in being isolated while Symbian roamed globally. It was different in being a launch platform for BlackBerry and then iOS and then Android. But now that iPhone is beginning to be widely available there, will it be exceptional in how it rewards Apple?

    ---

    Note:

    1. Activations data can be seen next to Apple's testimony of US sales in the following graph. Note that more phones were sold by Apple than were activated in total of the life of the product. 86 million sold and 80 million activated. This implies that an analysis based on activations undercounts the iPhone. 
  11. Samsung's basis of competition

    Research · 69 comments

    Samsung has been selling smartphones for a relatively short time. Although the company sold Windows Mobile, Linux and PalmOS during the last decade, it did not gain significant volumes until it began selling Android phones in 2010 with strong operator support.

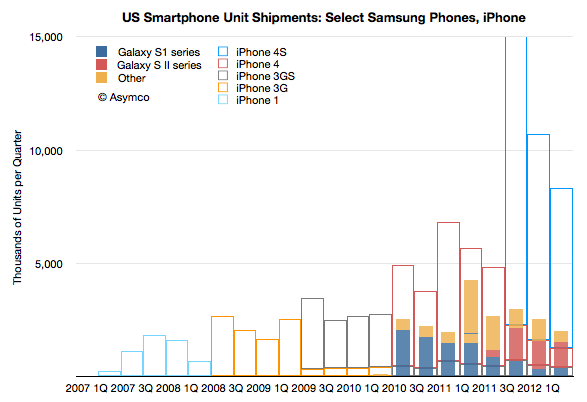
    That support was substantial in the US. The company crashed the Android party in mid 2010 with its Galaxy brand. Trial evidence reveals that the sales level for Galaxy S1 series phones burst out of the gate taking Samsung from 90k units to 2.5 million units in one quarter.

    The following graph shows the unit shipments recorded by Samsung for a set of US smartphones.

    Note that the profile of sales volume shows a cyclicality with respect to product launches. Each new generation overlaps with previous generations and "fills in" while the older generation product tails off in sales. This is standard portfolio strategy. It also shows the cycle time of launches is approximately four quarters. As the S1 was four quarters old, the SII launched and the SIII follows after four quarters of SII.

    What is surprising is that the overall sales volume is not growing. At least for the products catalogued (which exclude the Note) growth for the last four quarters has been: 5%, 34%, 31%, -53%. These are in stark contrast to the iPhone pattern shown in the outline bars behind Samsung's.

    The iPhone ramped slowly in 2007 and 2008 and has been showing remarkable generational growth.

    Perhaps it's still early and Samsung SIII product will ramp up as the contemporary iPhones do, but if it doesn't we have entertain the possibility that the iPhone does not compete along the same basis.

    What does it mean to compete on a different basis?

    The basis of competition is the aspect of an offering for which a customer is willing to pay a premium price. It's hard to know (or to put your finger on) what the basis actually is, but we can test whether it's the same by measuring whether two products capture prices the same way. If one product that seems to resemble another can obtain price advantage consistently, then perhaps it's being bought for a different reason.

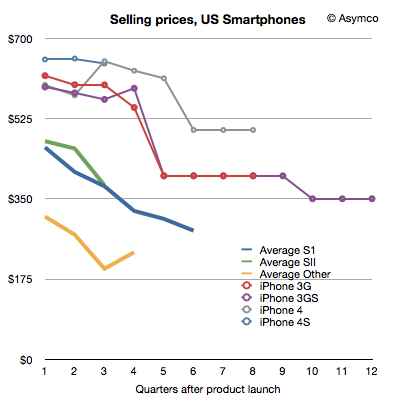
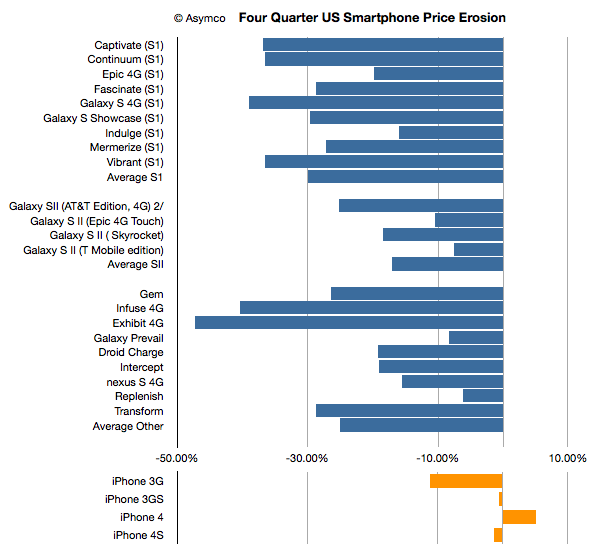
    To test this, I produced the following chart showing the prices that Samsung's phones have been able to capture through their lifetimes; and the same for the iPhone.


    I've narrowed the analysis to the first four quarters and summarized the price erosion across all the products as well:


    [Note: iPhone 4S, Skyrocket, T-Mobile Galaxy SII showing only three quarters]

    As mentioned, it's still early perhaps, but the pattern for the iPhone has been different.

    Samsung's pattern is not unusual. I've seen similar pattern for almost all Nokia products. Prices drop. It's a standard industry phenomenon.

    Therefore the question is not perhaps what is Samsung's basis of competition: it's the same as the overall phone industry. The question is what is the basis of competition for the iPhone.