Asymco

Asymmetric Intelligence

Industry

  1. Apple Store Operational Economics

    Research · 18 comments

    In a footnote to my last post on Apple Retail (The face and the brand) I used data on operating performance from Apple and an assumption about employee salaries (which turned out to be low) to estimate that about 7% of Apple store sales are spent on "cost of service" or the operational expenses, which consist of mostly employee salaries.

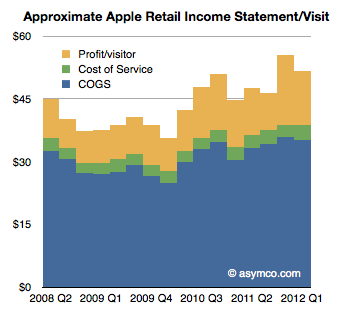
    An updated view of this store income statement (on a per-visitor basis) is shown below:
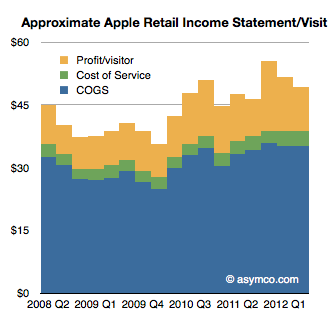
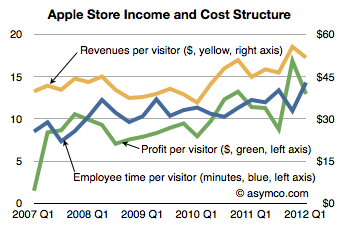
    To summarize the logic, during the last quarter Apple received $49.2 in store revenues per visitor. Knowing the retail profit ($10.46/visitor) and knowing the time spent per visitor (14 minutes, itself derived from the number of full time equivalent employees--41,000 or 112 per store) and assuming the cost of that time in employee salaries ($15/hr including benefits), gives us an estimate of the service cost ($3.55/visitor) and therefore the cost of goods sold ($35.2/visitor).

    Now I want to focus on this ratio of service cost/sales which turns out to be about 7%[1] and ask whether this is significant or revealing.

    In order to do this we have to understand that most stores, especially electronic goods retailers, don't spend this much on salaries. They do spend quite a bit on commissions however. From a post on the subject, I gathered the following commission rates for various retailers:

    • Phone stores: $25 for activations, 10% of accessory sales
    • Beauty/handbags at department store counters: 3% to 5%
    • Shoes, appliances, electronics: 8 to 10%
    • Furniture: 2% to 6% (low rate includes salary)
    • Real estate: 2.5% to 3% (no salary)
    • Car salesmen: 30% after dealer costs

    Now 7% to 10% that Apple spends on salaries starts to make some sense, economically. It's roughly equivalent to what another retailer might spend out of their sales on the help.

    The difference is that Apple does not pay commissions and that cost is spread over a far larger headcount of staff. Roughly speaking it implies that Apple hires five times as many employees (consider how many people you might see in an Apple store where the average is 112 and in a similarly sized Polo Ralph Lauren outlet) as would be needed to "just sell stuff."

    The trade-off seems to be that Apple will pay a modest wage to a hundred employees rather than a commission to a handful. The trade-off is pretty even since the profits would be the same.

    But they wouldn't be.

    The difference is that what the customer buys is different. Or, put another way, a store bursting with staff is hired by the customer to do a different job than a store filled with a handful of "salesmen".

    Even though the economic ratios are similar, the result is that visitors at an Apple store are made to feel they're getting a service rather than being sold a product.

    And that's the key to there being very many visitors. And, incidentally, they happen to buy more things. And also incidentally they come to value the brand more.

    It also leads to a virtuous cycle. More visitors means more visibility for the store and that leads to more visitors still, and that leads to more employees.

    So a simple decision to hire in proportion of a level of service rather than a level of sales leads to completely different bottom line results.

    That's not to say that this model is transplantable. The entire system depends on having the right goods to sell and the right brand image. But if Apple had all those things and imposed a commission structure in its stores, one can be fairly certain that sales would not be as spectacular and growth itself would suffer.

    ---

    Note:

    1. Again, this is probably quite an under-estimate and the actual cost of service might range up to 10%.
  2. Measuring iOS as a gaming platform

    Research · 35 comments

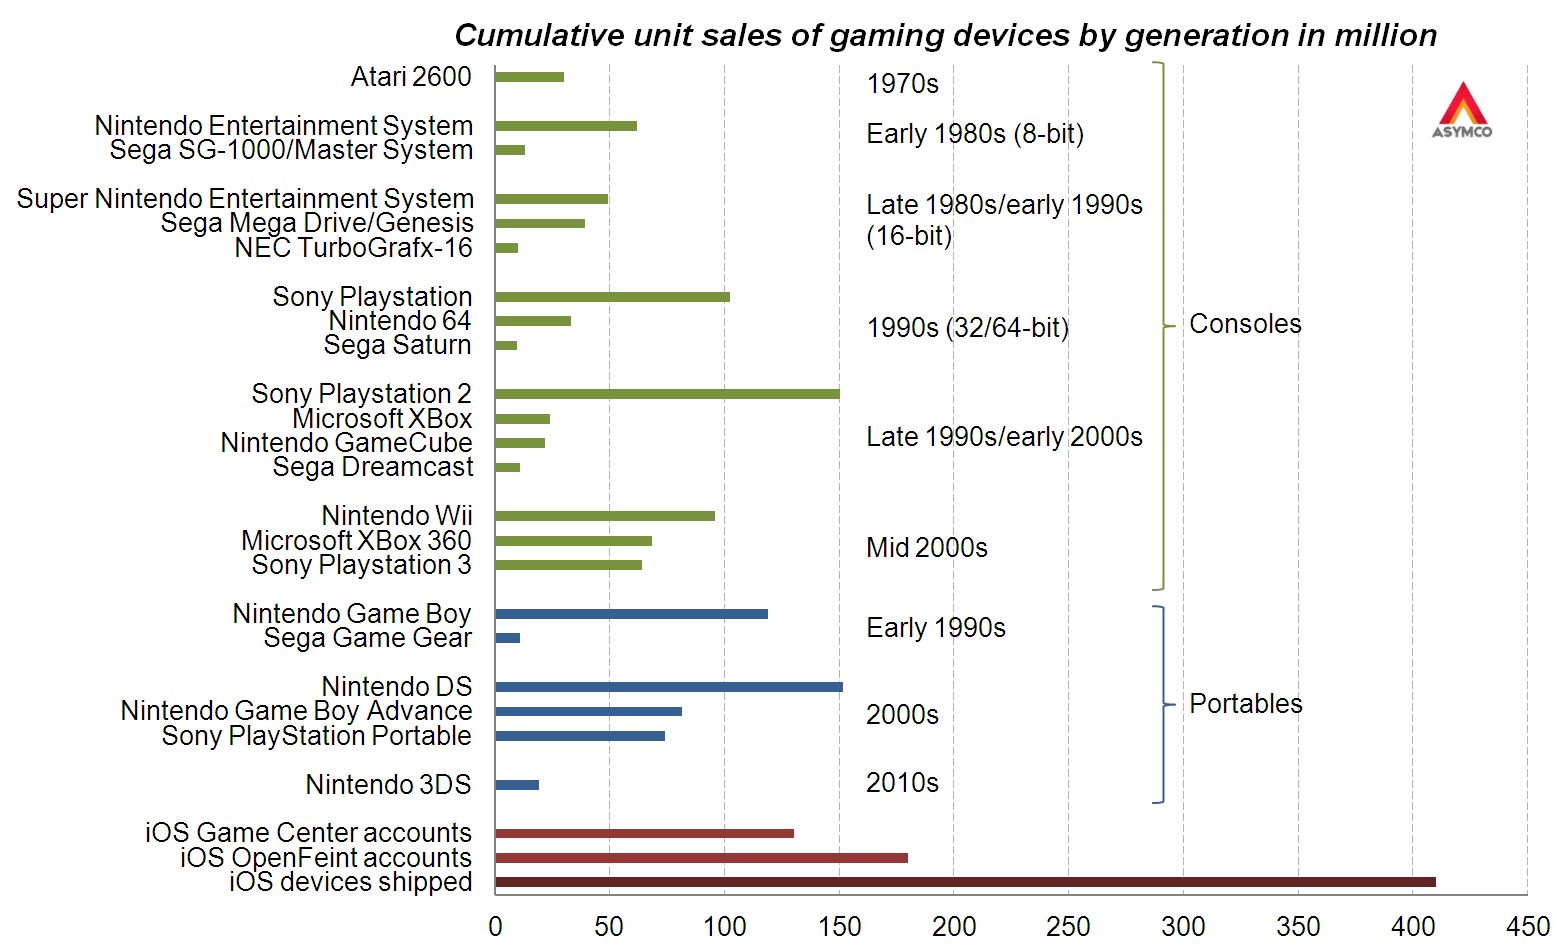
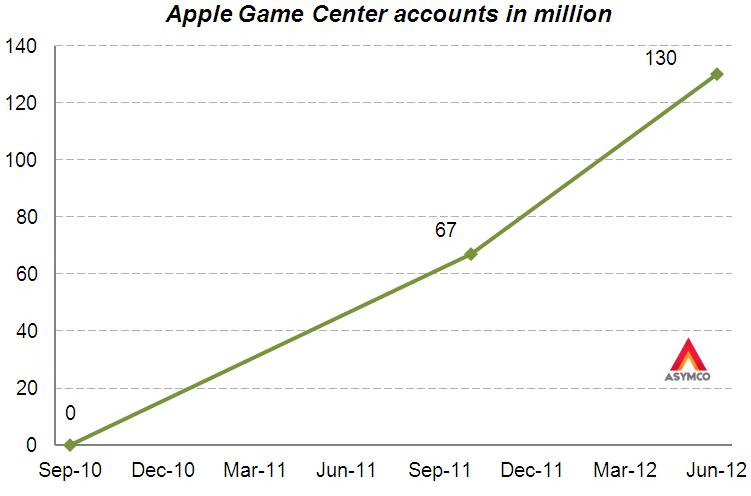
    At this year's WWDC Apple offered an update on Game Center accounts. The data we have so far is shown in the following graph.

    Before being acquired, another network, OpenFeint, announced 180 million iOS accounts in October 2011. Another figure to consider is the 40 million subscribers to Xbox Live (out of 66 million Xbox users). This subscriber base is paying for a service (about $1 billion per year) so it's not the same as the free Game Center model.

    Rather than being a revenue source, Game Center is designed to engage users and to capture usage information. It also lets us gauge gaming "consumption" on iOS devices. That itself allows us to contemplate it as a gaming platform vis-à-vis alternate platforms.

    To consider the figure as a proxy of penetration and engagement, the graphic below shows cumulative sales of gaming devices.[1]

    Here are some observations:

    • There is a pattern of turnover of market participants
    • Each console "generation" had a clear market leader
    • The best-selling gaming device was the Nintendo DS closely followed by the PlayStation 2 [2]
    • Considering the 130 million Game Center accounts, iOS is already the third largest gaming platform
    • Furthermore, considering the OpenFeint iOS figure of 180 million accounts announced in 2011, iOS has already surpassed the cumulative sales figures for the Nintendo DS
    • No gaming device has ever reached the 200 million mark
    • At the current growth rate the number of Game Center accounts will surpass 200 million before the year end

    Apple cites the number of games, downloads and payments to developers as evidence of ecosystem health and growth. The figure of Game Center accounts is yet another indicator. It shows growth in and of itself, but it also has the side effect of offering comparative measurement of performance. That measurement compares favorably with other game platforms.

    The economics are different but they always are when a disruption takes root.

    ---

    Notes:

    1. Based on reported cumulative sales (Wikipedia), excluding gaming devices with less than 10 million cumulative sales (excludes for example PlayStation Vita), excludes also “home computers” due to missing reported figures
    2. This Wikipedia article contradicts the previous.
  3. The biggest loser

    Research · 36 comments

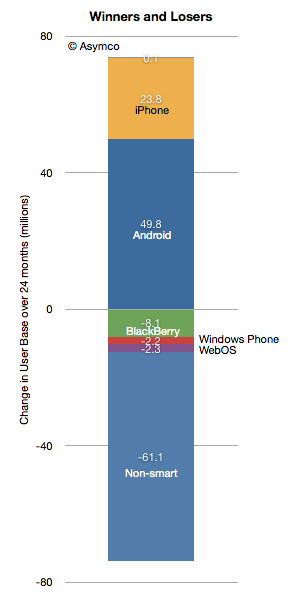
    According to data from comScore, in the past 24 months 50 million Americans became Android phone users. In the same time frame Apple added 24 million iPhone users. As I mentioned in my Asymmetric Competition post, it would be unwise to consider this data in isolation. Consider the following graph showing the net change in users in the US.

    Android and iPhone grew mostly at the expense of non-smart users. The BlackBerry lost 8.1 million users and all the others only lost about 4.5 million.

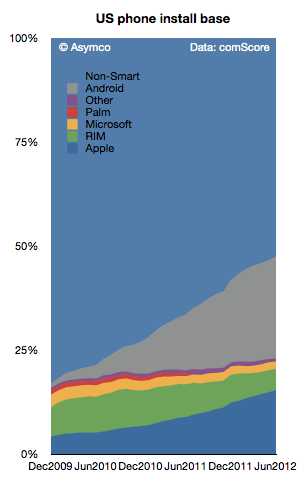
    With penetration at 50% it's still impressive that there is so little "churn" between platforms. In fact, measuring churn as the net platform user loss as a percent of all smartphone users, we get something less than 1% per month.

    The smartphone competition is still primarily with non-consumption.

    That will change at some point when smartphone penetration (shown below) will begin to saturate. The basis of competition will have to shift from converting non-smart users to converting users of other platforms while maintaining one's own user base.

    The market has not experienced this sort of rivalry on a wide scale. The defections of BlackBerry and Symbian users are relatively rare events.

  4. Perspective and Context in Personal Computing

    Research · 49 comments

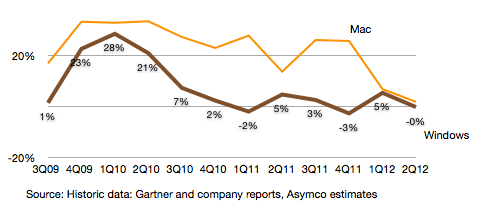
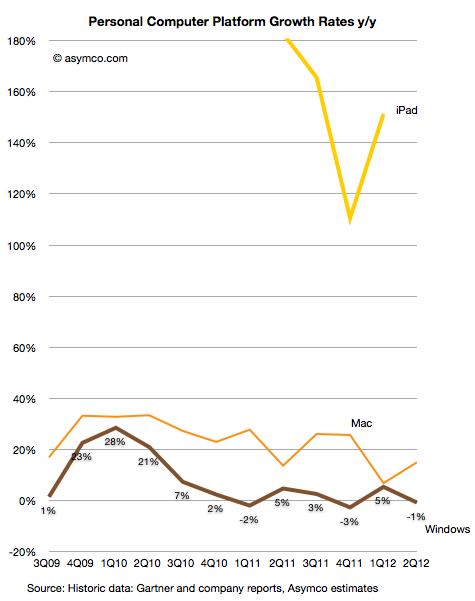
    The Mac grew at the extremely low rate of 1.8% over last year's second quarter. Although it grew faster than the Windows PC market, the gap has narrowed quite a bit. The following graph shows the growth of the two members of the computing Ancien Régime.

    We have to wait a few more quarters before we can decide whether the Mac will enter a new phase of diminished expectations. Although it's not immune from the impact of the iPad, the effect can take a long time to be evident and in either case, growth can come from conversion of Windows users which vastly outnumber loyal Mac users who might upgrade.

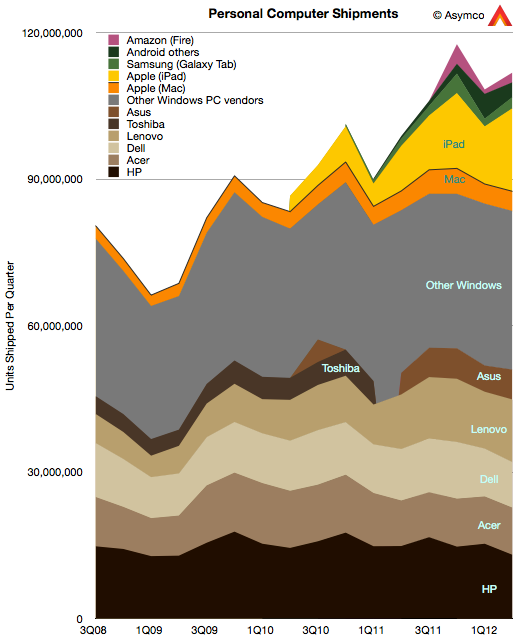
    If we see the computing market as the superset of keyboard+mouse input and touch-based input then new computing consumption becomes easier to spot:

    Seen this way, rather than there being a crisis in personal computing, we have a renaissance. And as in the actual Renaissance, it's a volatile and unsettling period.

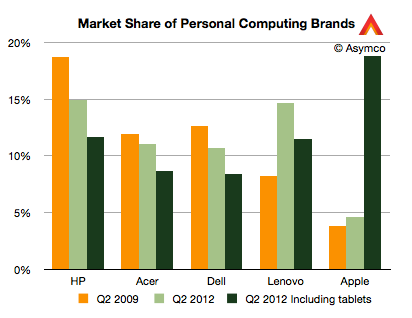
    Nowhere more so than in the changing of bases of power. Consider the following data:

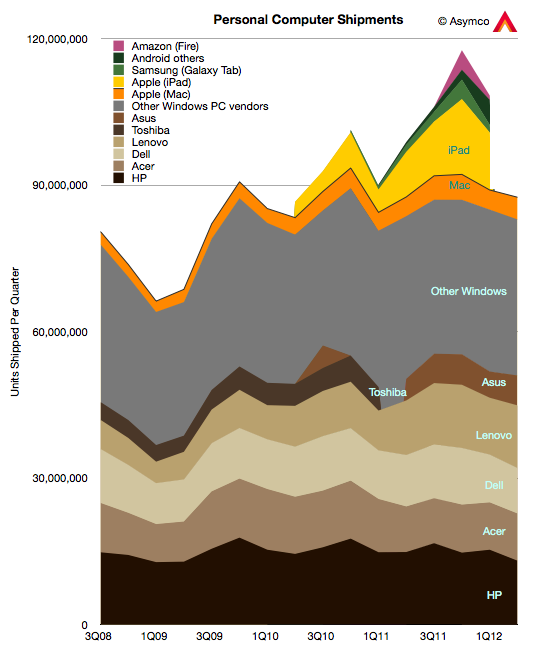
    A change in perspective leads one to conclude that Apple is the new leader in selling personal computers. Maybe this charting is putting too fine a point on it, but the data is beginning to make evident that which has been perceived subjectively by only a few.

  5. Cracking the India Code

    Podcast · 67 comments

    In my last podcast (Impatient for Growth) I mentioned my frustration at Apple's slow entry into emerging markets outside of China. I cited Tim Cook's comments that he did not see an opportunity there in the short term. He mentioned the multi-level distribution challenge which I took to mean the difficulty in setting up Apple stores (in itself due to restrictions on foreign owned retail chains) and the absence of device/service bundling.

    This requires more analysis and the best place to start is to look at the data available.

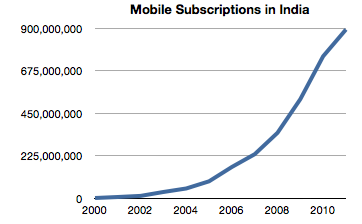
    The market potential is enormous. Globally, there are 6 billion mobile cellular subscriptions (end of 2011, ITU) and 86% penetration, but only 1 billion have mobile broadband subscriptions (which make ownership of a smartphone worthwhile).  In India there are 893 million subs (vs 986 million in China).

    In 2011 142 million mobile cellular subscriptions were added in India, more than in the Arab States, CIS and Europe put together.

    So the potential and growth are spectacular. But that is just 2G. Mobile broadband (i.e. 3G) is rare. Globally, developing countries have only 8% mobile broadband penetration vs. 51% in the developed world. Mobile broadband is a proxy for mass adoption of the iPhone (though perhaps not for Android inasmuch as it's employed as a feature phone).

    The situation for 3G in India is even worse than the overall developing world. 3G licenses were only first awarded at the end of 2010 and the process was fraught with allegations of corruption. In the year and a half since, there came to be an estimated 10 million HSPA connections in the country.

    The potential therefore is huge but the timing is difficult. Analysts are projecting 100 million mobile broadband connections by 2014 and over 350 million by 2016. Apple can affect this rate of growth as it's not only enabled by the network roll-out but can affect the take-up rate by consumers.

    It's a chicken-and-egg problem. No network means no devices but no devices may mean the network cannot be paid for. In the initial phases, the economics of mobile broadband are still dominated by the incentives for operators to pay for the infrastructure rather than for consumers to pay for the service. The iPhone will have a role to play and the question is whether 2014 or 2016 are the dates when Apple will be able to claim that they've cracked the India code.

  6. How many Lumia phones were shipped in the US?

    Research · 41 comments

    The US is a crucial market for both Nokia and Microsoft's strategies. This importance was highlighted during the launch at CES in January when not one but three CEOs (Microsoft's Steve Ballmer, Nokia's  Stephen Elop, and AT&T's Ralph de la Vega) were on stage to launch the Lumia. Knowing how well this strategy is working would be very useful to understanding how this market behaves.

    My first take on this was when I asked the question How many Lumia phones were sold in the US? The answer suggested through the combination of survey data from Nielsen and comScore[1] was 330,000. The figure is quite small compared to expectations. As it's so extraordinary, it should be supported by good evidence. Unfortunately the methodology used is weak. The figure itself is probably close to the margin of error of such sampling techniques. It would be nice to have another way to calculate this.

    Today Nokia offered another set of data which might help determine how many Lumia phones were shipped in the US. (Note the shipped versus sold distinction. Companies report shipments while surveys nominally measure consumption or usage.)

    Unfortunately, Nokia did not offer specific data on US shipments. What they did offer was:

    • Global Lumia shipments were 4 million in the last quarter
    • Global average selling price was €186 for a Lumia phone
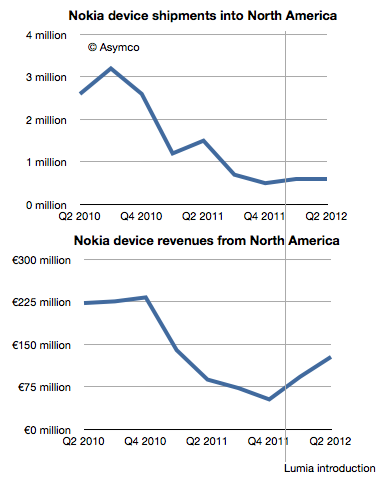
    • North American[2] phone shipments were 600k. This includes all phone types and all operating systems.
    • North American sales were €128 million.

    That's all we have. So how can this help with the question of US shipments?

    As often happens, it helps to look at the data historically. The following charts show North American shipments and sales with the Lumia launch date highlighted.

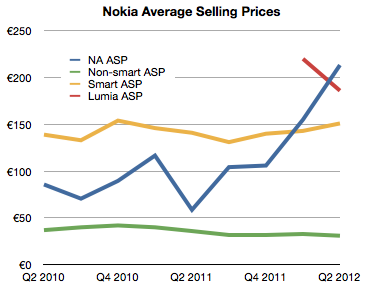
    While unit shipments were flat, revenues increased significantly. This suggests that we could plot the average selling price of phones in North America (NA) specifically. I did that in the following chart:

    Here the effect of Lumia is clear. The average revenue per phone in the US (blue line) jumped dramatically after the launch. So much so that it actually overtook the average global ASP for Lumia.

    What we need therefore is a way to estimate the "mix" or percent of smart and non-smart phones sold into North America and derive perhaps the US portion of that and then finally try to separate the Lumia from all the smart volumes.

    To help, I plotted the historic ASP for Smart and non-Smart devices as provided by the company.

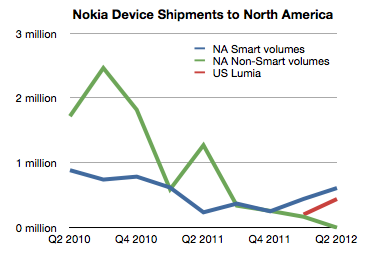
    Using a simple formula[3] it's possible to derive the mix which is shown as Green and Blue lines in the following chart.

    Getting estimates for smartphone shipments (blue line) is pretty close to Lumia shipments, but we still have to correct for US/Canada split (estimated at 90:10) and Symbian/WP split among smartphones (estimated 50:50 in Q1 and 20:80 in Q2).

    The result is the red line showing US Lumia shipments. The sum of the two quarters then comes to 630k.

    This is nearly twice the estimate from consumer survey data however I would not draw too many conclusions from this. Mainly because there are many assumptions place in both estimates, but also because there is the distinction between shipments and usage.

    However, it might be safe to say that US install base is somewhere between 400k and 1 million users. Is this good or bad?

    It's good because it's progress and there is some growth. It's bad because it's frightfully small relative to the competition. Nokia itself acknowledges the challenge and states that "We believe the Windows Phone 8 launch will be an important catalyst for Lumia."

    It seems that what Nokia needs most today is time. That is a very expensive asset. Perhaps infinitely so.

    ---

    Notes:

    1. A practice neither company would condone, principally because they are competitors, but also because they use different sampling methods.
    2. North America I take to mean US and Canada. Although geographically, Mexico is part of North America it's usually grouped as part of Latin America as a category. I'd like to get this confirmed.
    3. There are a few implicit and explicit assumptions: (a) Global ASPs are roughly comparable with NA ASPs but (b) smartphone ASPs are higher in NA by about 30%
  7. From bad to worse and from good to great

    Research · 122 comments

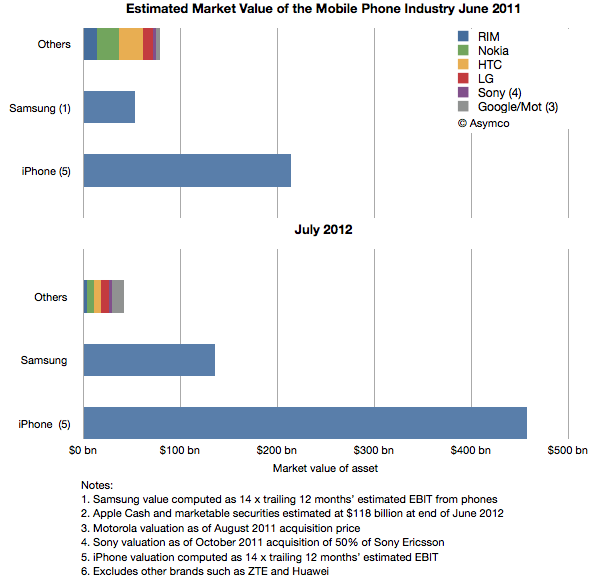
    A year ago I noted that Apple could buy most of the mobile phone industry with cash on hand (excluding Samsung's operations).

    Since then Apple's cash has grown significantly and the value of all phone vendors except Samsung has gone down significantly. The following chart shows the year ago and present day estimated market value of the industry participants.

    Phone brands other than Samsung and iPhone have seen a reduction in market value of a combined 47%. That's actually being quite generous since I'm valuing Motorola and Sony's businesses at their acquisition prices. The operations of both those companies have continued to stagnate.

    Based on the same multiple of estimated earnings Samsung grew its value by 157% and iPhone by 114% (note this excludes iPad).

    In absolute terms the iPhone franchise created $244 billion in value while Samsung created $83 billion. The others destroyed $37 billion.

    The good news is that the industry has had net value creation--always a healthy sign that innovation is being valued and absorbed.

    The bad news is that there is vast income inequality. The rich are getting richer and the poor are getting destitute. This is an unhealthy sign. The concentration of power and wealth may indicate a peaking of experimentation and discovery of new opportunities.

    Also noteworthy is that almost all the value from the Android ecosystem is concentrated in Samsung. I did not include Google in this analysis since its mobile is so small as to be not visible in its accounting. A separate analysis of Android economics shows that Google's benefit from the platform is modest. In contrast, Samsung, and Samsung alone, is benefitting greatly. It could even be said that today Samsung is the only Android profit engine.

  8. Waiting for Godot

    Research · 45 comments

    Gartner has published preliminary PC unit sales for Q2. The data from Apple's Mac sales has not been published yet but based on some estimates, we can draw a partial picture of the personal computer market.


    My estimate is that the Windows PC market fell by 1% while the Mac market grew by 15%. Gartner reports an overall flat market. I'll leave out the iPad for the time being, and show the growth of the Mac vs. Windows:


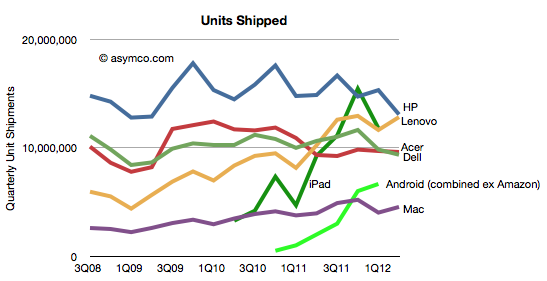
    In terms of individual vendors vs. each other, the patterns are as follows:

    It's perhaps a bit early to tell, but if the Windows PC market continues to slow or contract, it may be possible that HP and Dell will cede their market share leadership positions to Lenovo and Acer. Already "Others" account for as many units as HP and Dell put together.

    If we are to believe the analyst community reflects consensus, the industry, in the aggregate, continues to treat the potential for disruption from devices as unlikely. There always seems to be a wrinkle, a quirk, or an exceptional circumstance that is to blame. I won't get into all the excuses given by analysts for the slowing of PC sales but will point out that there's been a series of initiatives put forward by the industry to act as "catalysts" for growth. So far they have not worked. The current expectation is that Windows 8 will reverse this trend.

    Perhaps. But perhaps the relief, if it comes at all, will be temporary.

    [UPDATE: Due to a data error, the drop in Windows was overstated in the initial version of this post as 10%. It's been corrected to a drop of 1%]

  9. What will happen to Nokia?

    Research · 41 comments

    There is no shortage of information about what happens to companies in distress. The cause of distress varies widely and is often not well understood but the actions and symptoms of distress are very consistent. We can look at examples in each industry, even in each product category for a rich set of distressed company data.

    For over a year I've been chronicling the decline of incumbents in the mobile phone industry. However, decline cannot continue indefinitely. At some point a company "exits" the industry. Either through a sale or divestiture or, rarely bankruptcy. The list of exits is already long. The length and the correlation between exit and the lack of recovery implies that Nokia will also exit.

    But how, exactly?

    Will Nokia be acquired? If so, then by whom? What other options exist? How can we analyze this?

    The easiest way to guess is to look at what happened to other companies in similar circumstances. The clearest and easiest comparison to apply is Motorola. Motorola was at one time the largest phone vendor and it went through a violent decline. Like Nokia, it was diversified into networks and a few other businesses. Unlike Motorola it's not an American company. This matters because American companies are more comfortable targets for corporate raiders. The legal and boardroom mechanics are not "better" or "easier" in the US than in Europe but they are more familiar to those who might engage in it.

    So one avenue that Motorola traveled on was the intervention of activist investors who forced management change, affected strategy and pushed some tactical initiatives. This external pressure was successful in the case of Motorola. The company was split up, it was re-purposed and re-focused and, with a bit of good luck, was acquired.

    The process however still took two years. In that time the company languished but stayed alive. Its headcount was reduced by nearly two thirds. It was in a precarious situation throughout. Its story is not over but ownership did change hands and those who took a risk with it while in distress managed to get a reward.

    This example (and Sony's acquisition of Sony Ericsson and HP's acquisition of Palm) cannot apply to Nokia.  An activist investor is unlikely and the company has not yet made itself attractive to a buyer. So what would Nokia need to do to  be acquired?

    The first step toward an acquisition will be divestiture of its Nokia Siemens venture. The second will be a spinoff or sale of its non-smart phone division. The third might be the allocation of its IP across these separate entities or in a separate holding.

    As the company is broken up, value can be released. Investors will be able to value it better and make appropriate assessments of risk. Only at this point would an acquirer perhaps buy the "rump" Nokia smartphones group.

    However, even this scenario is not without huge risks. By the time the split is completed, the operating companies could have deteriorated to such a degree that they are no longer viable. Timing is critical.

    So if the smartphone group is isolated and made available, who could buy it? Microsoft is always cited as the primary buyer. I've been skeptical of this as Microsoft has found it difficult to make hardware work. It acquired Danger leading to Kin which failed. It has struggled with Xbox for a decade and has yet to recover all its costs for the effort. It has failed embarassingly with Zune. It also has shown no particular success with its original Surface table computer.

    But management has re-committed itself to a new hardware effort with the new Surface. This renewed potential opens up the possibility of entering into the integration of a phone again into their business, and Nokia would be remarkably well positioned to help.

    At this time, the possibility still seems remote. The company has dismissed speculation of building phones again and again. Unlike PCs, the phone platform is not yet mature and volumes and distribution are very different.

    However, there is one other option.

    Microsoft has historically "rescued" technology companies in distress with cash infusions for minority equity stakes. It injected some cash into Apple, Barnes & Noble and even Facebook. It did so not because they wanted to own these companies but because they wanted them to survive or thrive. The move acts as a signal to the industry, partners and developers. So what I see more likely than an acquisition is Microsoft capitalizing a spun-off Nokia Smartphones company in exchange for a small equity stake.

    The valuation of this stake will be huge as I expect billions of dollars for single digit share ownership. However, Microsoft would not be doing it to get a return from those shares. It would probably later sell them at a loss. But it would be buying a strategic option whose value may be far greater.

  10. The face and the brand

    Research · 70 comments

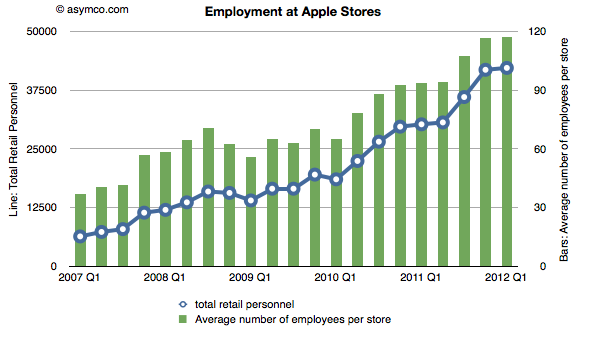
    In the five years since the iPhone launched, Apple created a total of 35,852 retail jobs.

    Some of those jobs came from new store openings. The total store count went from 172 to 361, more than doubling. But the growth in employment was faster: from about 6400 to 42,200, more than quintupling. This is reflected in the total number of employees per store which increased from 37 in Q1 2007 to 117 in Q1 2012.

    Which brings up an obvious question:  Why did Apple triple employment at each store? One could answer that many of the newer stores are bigger, so-called flagship stores. But the vast majority of stores are in mall locations which are of limited size. Flagship stores alone cannot account for the increase. One could also suggest that perhaps the stores are open longer and there is a need for more shifts. Again, the vast majority of stores are constrained by the opening hours of malls which, as far as I know, have been steady. Anecdotally, it's also evident that there are more employees in a store at a given time. There are many more of those colored T-shirts at first glance.

    One hint is in the design changes in the stores. Apple has removed shelving, registers and almost all non-Apple merchandise. It has replaced the visible stock with tables on which rest products that can be used. If there weren't any people in the store, the store would look almost completely empty, just an open space.

    But that's the whole point. The stores are designed to be filled with people. The stores have an open layout because it allows more people to be inside the store at the same time. And the more people the more employees.

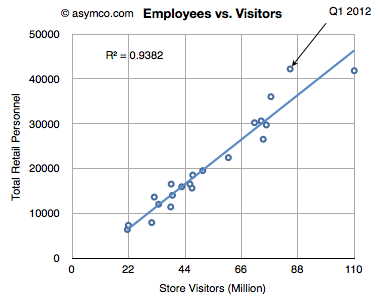
    We have the data to prove this: The visitors per store per quarter increased from 125k in Q1 2007 to 235.5k last quarter. Nearly double the number of visitors in five years. It's this increased traffic that is closest tied to the increase in employment. This is illustrated by the following chart:

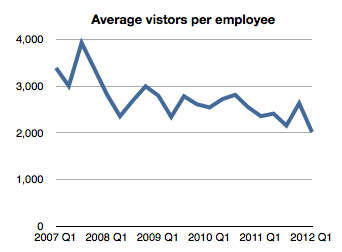
    Employment is very closely correlated with total visitors. In fact, employment has risen faster even than visitors. By dividing the number of visitors by the number of employees we see how the number has declined.

    [If we consider the time an employee spends working we can even guess that the average visit was served by about 14 minutes of employee interaction--this is up from 9 minutes five years ago.]

    If we assume this relationship as causal, then it might be that the stores are "tuned" to ensure a reasonable if not pleasurable experience for the visitor. In other words, the proxy for a "quality" experience is the assistance of an Apple retail employee.

    Taking this a step further, we can perhaps hypothesize that Apple is treating its retail stores as hired to provide a human touch to its products--not just as a service but as a way to listen and help in the most basic way. Steve Jobs once said that Apple no longer had to be present at trade shows because they have millions of conversations with their customers every day through their stores. These conversations happen with the retail staff.

    Through their Apple retail staff, Apple might even be said to be putting a face on their brand. You can see it in the advertising.

    The corollary to this would be that the job of the store is not primarily to sell things. This is confirmed by the fact that store employees are not on commission and there is no sales pressure on visitors. Indeed, the sheer number of employees in a store of modest size (117 employees on an average of about 8k sq. ft.) implies a brazen disregard for the economic orthodoxy of retail efficiency and incentives to sell.

    And yet the stores are astonishingly efficient at selling things. The statistics are off the charts in terms of sales per square foot and overall profitability. Even though this employee time has a cost, revenues and profits have all risen in unison.[1]

    Of course, the products have a lot to do with this performance. Apple stores sell desirable, popular products which are premium priced. But taking these desired products and coupling them with a "human touch" job to be done strengthens the brand as well as expands its volume of sales. It may be that Apple's retail approach could not work with a brand that was less desired. I.e. regardless of a large head count, a Sony store may not see the return on retail investment that Apple gets. Conversely, by not putting a face on Apple's brand the products may not sell quite as briskly. Ron Johnson said on the launch of the iPad that the stores were almost designed for it. Discovery and hands-on time create demand.

    It's as if Apple retail has an inter-dependence with Apple, the brand. One cannot live without the other.

    This is, as far as I know, a unique relationship for a technology company. If anything, most technology companies have sought the exact opposite: to put others' faces in front of customers--to break the messy process of sales and support down into pieces to be outsourced to "value adding" resellers.

    A pity then that this humanizing touch takes such a long time to build.

    ---

    Note:

    1. If we take a visitor-centric point of view, the analysis of the retail business simplifies considerably.  We can even derive an "income statement per visitor". Revenues are measured per visitor (currently about $52/visit). Costs are measured in terms of employee time. A $15/hr average wage and 15 min interaction time per visit puts the service cost at $3.75/visit. Profit per visit is also measurable and it's currently at $13/visit. Therefore the employee "FaceTime" costs 7% of sales, while other costs, including the cost of goods sold, add up to 66% of sales.