Asymco

Asymmetric Intelligence

Industry

  1. Who will be Microsoft's Tim Cook?

    Research · 85 comments

    As previously noted, Apple has overtaken Microsoft (and Google) in operating margin percentage. This is an astonishing statistic as Apple is still largely perceived to be a "hardware company" while Microsoft is a "software company" and Google is a "services company."

    To suggest that "hardware" could be more operationally profitable than either software or services is akin to heresy in technology analysis. This reversal is newsworthy indeed. However, even the most casual observer would note that Apple does not derive its market power from hardware alone. It is, in fact, an integrated hardware, software and services company (with a few more roles besides.)

    So the emergent successful business architecture in this technologically transitional period is of integration and completeness of solutions.

    This shift explains at least at a conceptual level Microsoft's tectonic Surface shift.

    But what about another point of view? What does integration mean for Microsoft's income, cost and profit structure? Is integration self-disruptive to Microsoft?

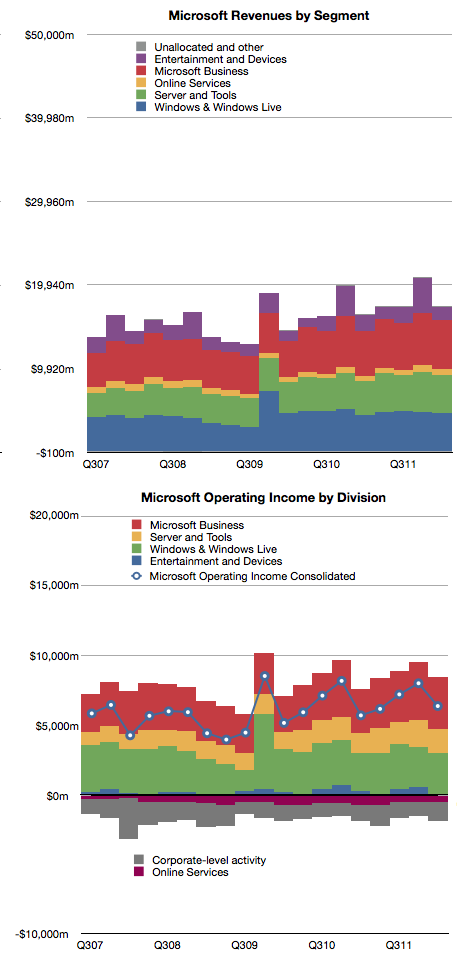
    Here's a reminder of Microsoft's revenues and operating income by division:
    The challenge of devices for Microsoft is that the licensing of software for devices is very difficult to sell.

    In 2011 Microsoft received about $18.7 billion in Windows revenues and $23 billion in Office revenues. The chart shows that this is a fairly steady growth business. According to Gartner, in 2011 there were about 336 million Windows PCs sold and that this too is a fairly stable and mature business.

    If we simply divide revenues by PCs sold we get about $55 Windows revenues per PC and $68 of Office revenues per PC sold [1]. The total income for Microsoft per PC sold is therefore about $123. If we divide operating income by PCs as well we get $35 per Windows license and $43 per Office license. That's a total of $78 of operating profit per PC.

    Now let's think about a post-PC future exemplified by the iPad. Apple sells the iPad with a nearly 33% margin but at a higher average price than Microsoft's software bundle. Apple gives away the software (and apps are very cheap) but it still gains $195 in operating profit per iPad sold.

    Fine, you say, but Microsoft make up for it in volume. Well, that's a problem. The tablet volumes are expanding very quickly and are on track to overtake traditional PCs while traditional PCs are likely to be disrupted and decline.

    So Microsoft faces a dilemma. Their business model of expensive software on cheap hardware is not sustainable. The future is nearly free software integrated into moderately priced hardware.

    For Microsoft to maintain their profitability, they have to find a way of obtaining $80 of profit per device. Under the current structure, device makers will not pay $55 per Windows license per device and users will not spend $68 per Office bundle per tablet. Price competition with Android tablets which have no software licensing costs and with iPad which has very cheap software means that a $300 tablet with a $68 software bill will not be competitive or profitable.

    However, if Microsoft can sell a $400 (on average) device bundled with its software, and is able to get 20% margins then Microsoft is back to its $80 profit per device sold. This, I believe, is a large part of the practical motivation behind the Surface product.

    The challenge for Microsoft therefore becomes to build hundreds of millions of these devices. Every year. Sounds like they need a Tim Cook to run it.

    ---

    Notes:

    1. Microsoft accounts for revenues using deferrals due to Software Assurance pre-payment models for many corporate customers so this figure is not a precise value for each license sold.
     

  2. The evolution of the computing value chain

    Research · 34 comments

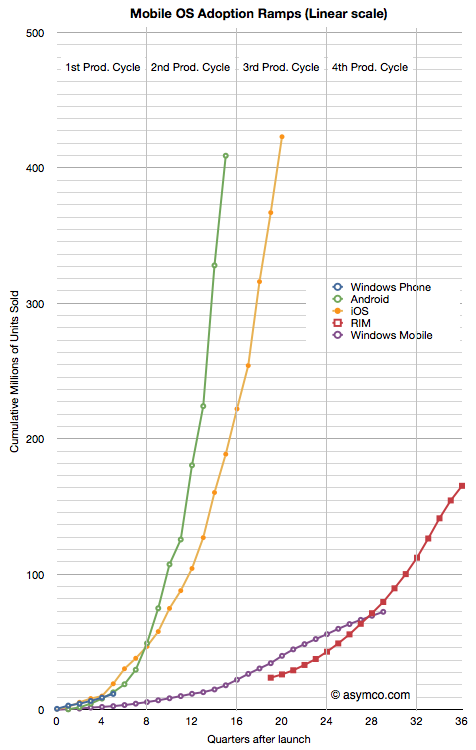
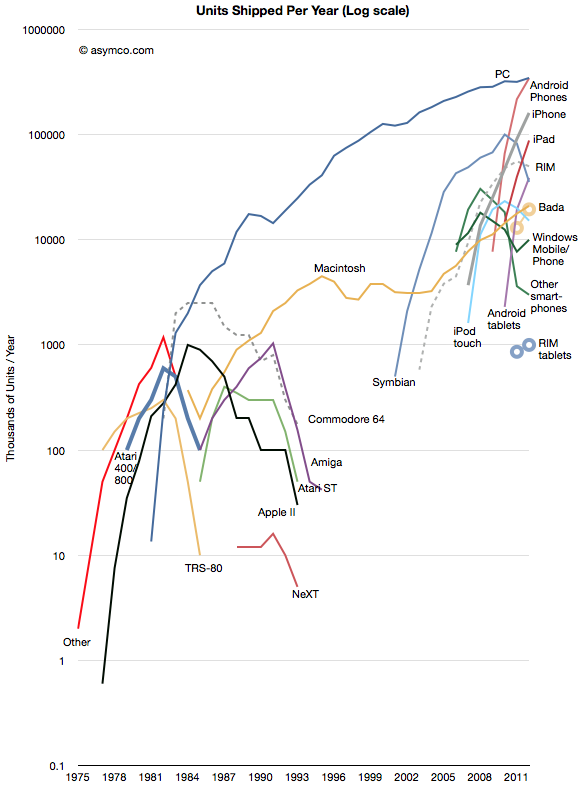
    The history of personal computing has come to be defined as the history of Microsoft. At least since 1981 Microsoft's operating systems have been the consistent market share leaders, and by a very large margin. That is about to change. This year Android will be on more devices sold than Windows. iOS is also set to also overtake Windows next year. The following chart illustrates the wave of mobile platforms that has emerged, and in spite of some notable failures, is overtaking traditional computing.

    Of course we should remember that PC themselves overtook entrenched predecessors like minicomputers and mainframes which themselves overtook business computing systems based on adding machines, typewriters and slide rules. This is the cycle of disruption and there is nothing new about it.

    However, it always seems to take people by surprise. This is because it happens in unforeseen ways and at unpredictable rates. And so it is that we are surprised by Microsoft's seeming abandonment of a business model that has sustained it for three decades.

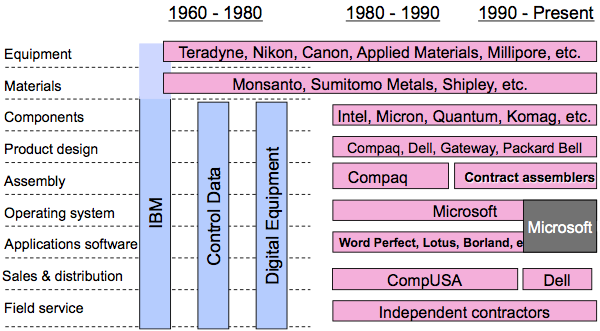
    Yesterday's reveal of Surface, Microsoft's first personal computer, was a watershed event in the evolution of value chains around computing. In a famous slide Clay Christensen illustrated (in 2004) the value chain evolution in computing from the 1960s to 2000.

    As computing moved from the desktop to the pocket the industry re-integrated. First, Apple moved from Product Design into Sales & Distribution with its stores. Then it moved into service with Genius bar. Then it moved into component design with the A series chips and unique batteries. Then it moved into materials with exclusive licensing of LiquidMetal. It also began to own the equipment used in its manufacturing. This in addition owning the operating system.

    Now we see Microsoft following in the same footsteps. First applications came early then stores, then service, and now product design. Google is also tracking closely behind as well with its acquisition of Motorola, the results of which have yet to be revealed.

    And so we can see value chains evolving in real time before our very eyes. They have always evolved but in technology industries they evolve far more rapidly and will continue to accelerate.

    Whether Microsoft or Google will be successful in their integration efforts remains to be seen. The challenges are immense as the value of the existing chains are enormous and the bonds that tie the company to them very strong. Breaking these ties will seem like value destruction and corporate antibodies will be set loose to kill the transitions. HP, RIM, Nokia and Dell are vivid examples of what happens when the response mechanisms have their way.

  3. Update on Android growth

    Research · 24 comments

    In February of this year MediaTek introduced an ARM chipset for Android smartphones targeting $160 end user pricing. I've heard estimates that this chipset will sell in the "hundreds of millions".

    The question is: are these units going to be "activated" as per Google's definition of Android?

    Historically, MediaTek's chips have been used in "grey market" devices. These are typically copies of branded phones and are sometimes shipped without IMEI numbers and hence not even sanctioned by regulatory authorities. If hundreds of million of such Android devices are sold in the next few years then tracking Android will become even more difficult.

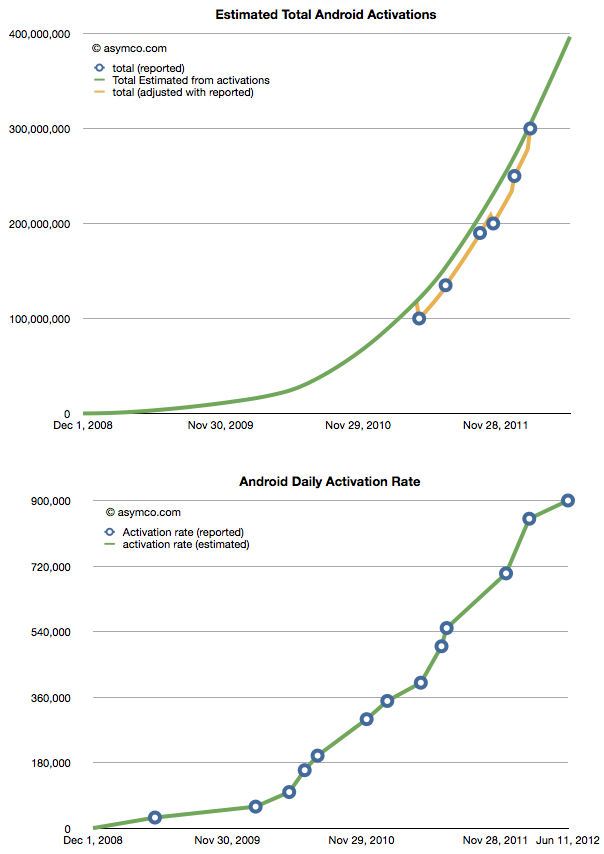
    The current total is difficult enough. We just received an update on the activation rate (900,000 per day) and that allows us to create a picture of total cumulative activations.

    We still don't know the retirement rate so these are not devices in use, however most of these devices have been sold in the last two years implying they are (nominally) still functional. The following chart shows the ramp overlaid with an estimated 24 month product life cycle.

    The one million per day Android activation rate has probably already been crossed with all the unsanctioned versions of Android available today. What will be the rate once the MediaTek chipsets are in wide distribution?

  4. The highway to hell

    Research · 57 comments

    A glance at Nokia and RIM's market values today shows that they are both valued below book. With respect to RIM,

    The company's share price has collapsed in the past year, and it is now only valued at about $5.4 billion, down from $84 billion at its peak in 2008. Excluding its cash and the estimated value of its patents, RIM's device business and its 78 million subscribers around the world are in aggregate worth less than $1 billion to investors.

    Analysis: RIM's new woes seen speeding loss of BlackBerry users - Yahoo! Finance

    With respect to Nokia,

    MKM: We are downgrading Nokia to Sell from Neutral following our U.S. retail Lumia model checks. We assume no value for the handset business and no value for the roughly four billion euros [about $5 billion] in net cash.

    Nokia Suffers From Hang-Ups - Barrons.com

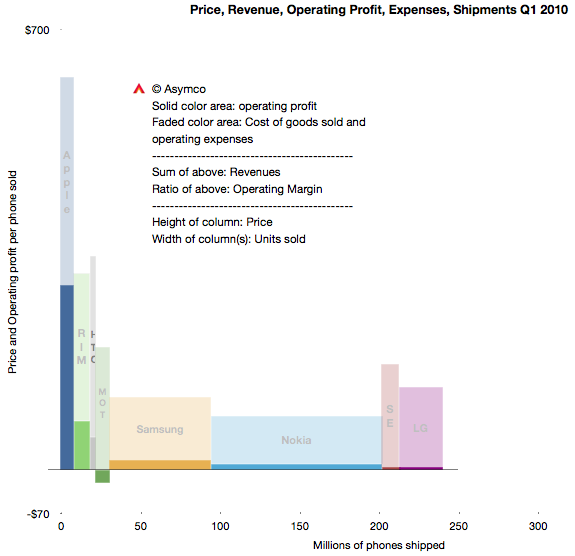
    Three years ago the situation was dramatically different. RIM's share price was six times higher and Nokia's about four times higher. Here's what the market looked like in Q1 2010:

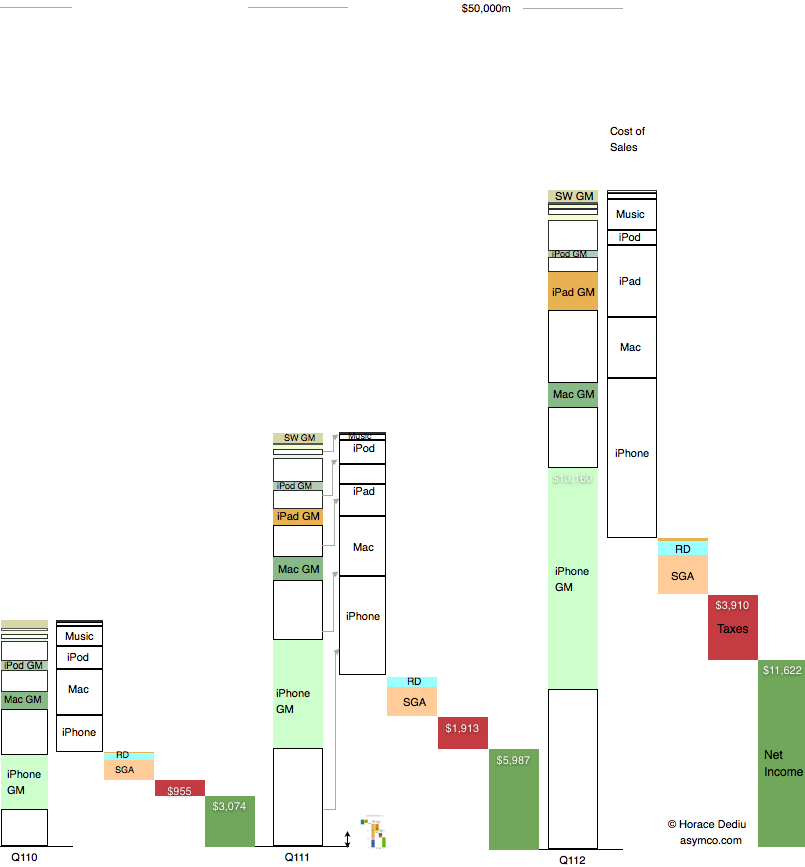
    This summary view shows individual competitors in the phone market as well as their combined total volumes. The profitability/volumes/pricing can be visualized as well as margins and revenues.

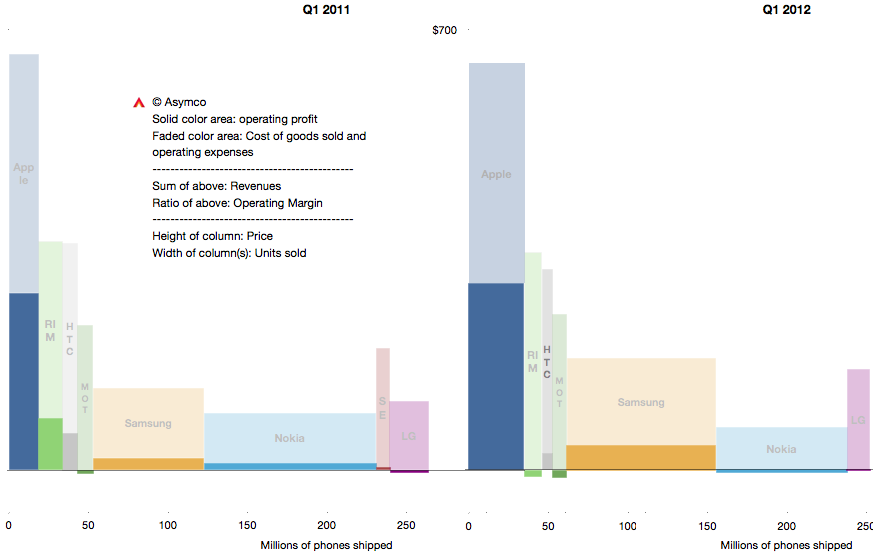
    The same visual summary is presented for the first quarters of 2011 and 2012 below:

    The change may be subtle to the untrained eye, but it can be summarized as contraction for most vendors and expansion for Apple and Samsung. RIM and Nokia not only contracted in terms of revenues and volumes but also, crucially, lose money.

    I've written about this before (many times.) But it's important to repeat again that this is a very short time span. Only three years separate the top chart from the bottom right. The "shape" of the market participants has not changed much but a tipping point has been crossed. This is the point where some participants are disrupted enough that they cannot recover.

    Did it happen in 2010, 2011 or 2012? We're only looking at data which results from hundreds of decisions and thousands of actions. It's improbable that there was a single moment when the shift occurred or a single decision that caused it. But it's equally improbable that the disrupted could have countered any of the actions that got them to this point.

    The cause (and remedy) for disruption is never found in a single act. It's a process and a way of operating and thinking. Is management to blame? That's always the answer. But how did management go from being smart to foolish so quickly and why did all managers in a firm, even an industry, conspire to become foolish at the same time?

    If you study the decisions on a day-to-day basis, management consistently applies all the lessons they learned that led to success in the past. But these lessons lead to decisions that end up with exactly the worst result possible.

    The crux of this dilemma is that doing the "right thing" leads to the wrong result. In a comment I questioned the possibility of management in a public company solving the dilemma.

    Some have argued that public companies with professional managers entrusted with fiduciary responsibility are inherently incapable of solving the innovator's dilemma and are thus doomed to be disrupted. I'm starting to believe the argument. Whenever you as a manager try to work out the solution to the dilemma, you encounter a value destroying obstacle that cannot be surmounted while maintaining your position in the company. [As you attempt to solve it, you lose your position] Your successor won't make the same mistake and [thus] the whole enterprise collapses.

    There are counter-examples however. The reason Apple should be studied is that it gives hope that they have cracked this problem.

  5. Beneath contempt: The Apple TV business model

    Research · 96 comments

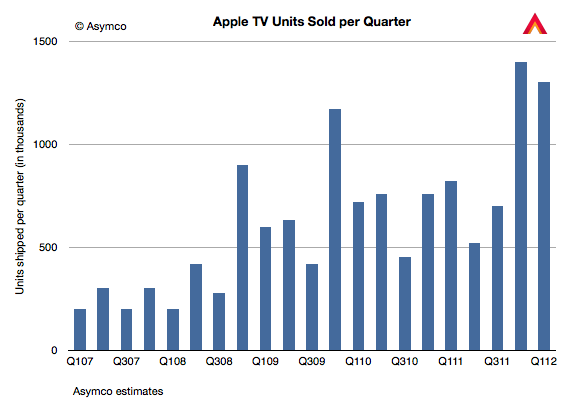
    Last year we sold ... 2.8 million Apple TVs. This year, just in the first six months of our year we've sold 2.7.

    Tim Cook at D10 1:45.

    I note the "our" in "our year". This implies fiscal year (that and the fact that he spoke in the past tense before six months had passed in the calendar year.)

    Given the public information we have so far, it's now possible to estimate with some confidence the sales history of Apple TV. The following chart is my estimate. It includes all the known data so far with some interpolations to fill in the gaps.

    Assuming average revenues per device of $100, we can get an estimate of about $344 million in Apple TV hardware revenues for calendar 2011. This is not a large amount relative to Apple's other lines of business. It is, for example, only 14% of the overall Peripherals revenues and only 5% of the iPod.

    However hardware revenues are not the whole story. The business model for the device is in many ways the polar opposite of the business model of the iPhone. Whereas the iPhone employs "break-even" iTunes App Store (and the Music and Video and Book stores) in order to sustain its high hardware margins, the Apple TV business has low hardware margins that sustain content.

    The complete picture therefore has to include an assessment of the content attach rates and the agency fees that Apple gets for that content.

    Let's assume that each Apple TV is used to generate $10/month in content sales. This is not a lot. It's equivalent to 5 TV shows or one movie purchased or two movie rentals per month. The model I have shows that the installed base of Apple TVs was about 10 million by the end of 2011. That means that the run rate is $1.2 billion in content sales for the Apple TVs in use.

    Now Apple does not book all that. They book only about 30% as revenues as their agency fee. That means that Apple TV could be generating revenues at a run rate of $360 million (to Apple.)

    If we add that to the $344 million in hardware revenues we get about $704 million for 2011. This is still not a huge business. It is about equal to the revenue from iPad Smart Covers[1]

    Looking forward, if Apple TV units sell at double the rate of last year and we increase the footprint accordingly, we could see a revenue rate of $1.2 billion for 2012.

    Now this is not a high margin business. The margin on the content may be less than 50%--depending on transaction costs and hosting/traffic fees. The margin on the hardware is also likely to be below 40%. So the business is not wildly profitable. But it probably is profitable. Which means it makes sense to keep it running while waiting for other pieces to fall into place.

    As Tim Cook repeated, they are very interested in this space. However, any discussion of the future must include an analysis of the business model and the sustainability in terms of profit that keeps long term development focused on getting the product to be good enough for the right jobs to be done.

    What we should think about however is this "polar opposite" business model. Apple is running this as a "hobby" or as an internal experiment. Sales are (relatively) tiny but it generates some profit. Volumes are small but they are growing. It's taking a heck of a long time. It's asymmetric to the prevailing model the company relies upon. It's beneath contempt from all observers. Sounds familiar?

    ---

    Notes:

    1. In 2011 there were about 40.5 million iPads sold. If we assume half of those purchases also resulted in a Smart Cover purchase and if the average revenue per Smart Cover was $35 then total Smart Cover revenues were $709 million.
  6. Post-traumatic life expectancy of phone vendors

    Research · 44 comments

    “Clearly this stuff isn’t selling,” said Monga [an analyst at Veritas Investments Research in Toronto.]...

    RIM took a $485 million pretax charge to write down the value of its PlayBook inventory in December, after shipping just 150,000 of the tablet computers in the quarter. Then in March, the company recorded a $267 million expense for BlackBerry inventory. RIM said at the time that it would stop giving sales and profit guidance because of “ongoing weakness” in the U.S.

    via RIM Writedown Risked With $1 Billion Inventory: Corporate Canada - Businessweek.

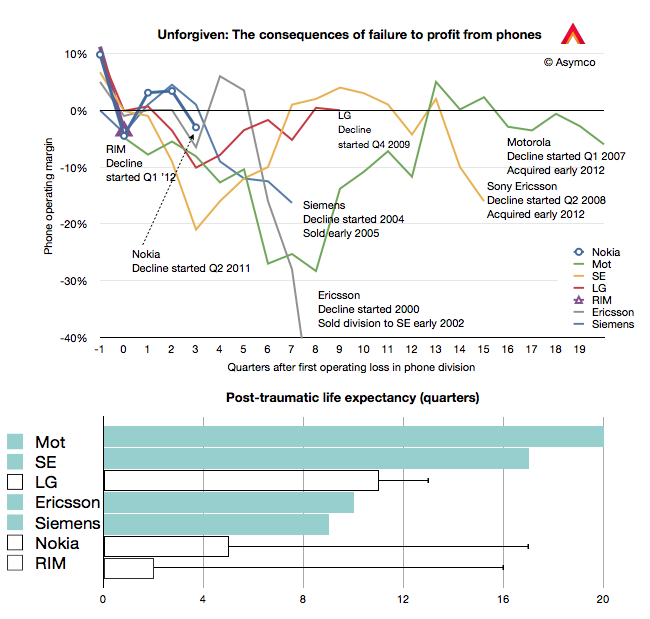
    RIM has just entered what I call the Post-traumatic period of a phone maker's life. This period is defined as beginning with a loss-making quarter and ending  with the company's exit from the business. These post-traumatic periods were visualized first here and the pattern was first discussed about a year ago here.

    I've updated the chart with the current data and added the bar chart below to illustrated the "post-traumatic life expectancy" for the companies shown. Companies still operating are shown with bars without color while companies that have exited are shown with solid color bars.

    The pattern may be that companies either have short post-trauma lives of about two to three years or relatively long post-trauma lives lasting 4 to 5 years. What determines this life expectancy and how long do RIM, Nokia and LG have?

    There is precious little data, but perhaps one hypothesis I could offer could be that the bigger the commitment to the industry (in terms of having no fall-back options) the longer the post-traumatic period lasts. In other words, as there is no easy way out, the fight lasts longer.

    This can also be interpreted using Porter's "barriers to exit" force analysis where companies which can liquidate a division see it as a low cost of exit whereas companies that need to restructure (usually more than once) and then seek either a buyout or rescue may interpret exit as a very costly endeavor.

    Long exits compile larger costs of distress and can cause more pain for stakeholders, especially if the end is inevitable.

    Given this hypothesis, as both Nokia and RIM depend largely on mobile phone sales, it's likely that they will not exit quickly. (Ironically perhaps, LG has a better shot at a quick exit given its diversified conglomerate status.) It might imply that there are at least two more years before Nokia and RIM call it quits.


  7. Shipped and sold: A brief introduction

    Research · 39 comments

    Markets are difficult to measure. Mainly because the information is not easy to obtain and that which is obtained is not made public. Collecting, analyzing and filling in the gaps is big business with many firms involved in selling it.

    However, with all the analysts and companies selling and promoting their "numbers" it's important to understand the difference between the methods used. There are for instance at least the following measurements:

    1. Units sold to end users. For example NPD or GfK data of retail transactions. Also Gartner's estimates for phone units sold.
    2. Units sold to the channel. For example units recognized on income statements usually reported by companies. Also IDC's estimates for phone units sold.
    3. Units in use. For example comScore and Nielsen survey data.
    4. Units "activated". The measurement Google uses to describe Android performance.
    5. Intent to buy. For example ChangeWave surveys of early adopters.
    6. Utilization rate. For example browser statistics.

    Each measurement tells a different story about the market but the best story is told when all data is analyzed in a combined integrated market review.

    Before diving into that it's important to understand the difference between the first and second measurements or the difference between shipped and sold.

    What does "Sold" mean?

    Let’s say that you sell a phone to another party. What constitutes a sale? The sales agreement? That you shipped it? That he wanted it? That you were paid for it?

    What if he changes his mind and returns it? Is it still a sale? What if a manager's bonus depends on these sales? What if the company’s share price depends on these sales? Is there a way to rig the accounting?

    As it turns out, yes there are; many ways. Unethical and fraudulent practices happen surprisingly often. A classic instance would be: A customer is shipped ten phones, though he only wants one, and he gets paid to ship the other nine back, after the close of the year.

    The sales manager records ten times the sales he actually made, making ten times the commission and the company’s stock price rises. To compound the offense, the manager could also tip his friends to short the stock at the end of the year, leaving investors “holding the bag” when the inevitable correction follows.

    There have been so many cases of this kind of accounting fraud that the FASB (GAAP), SEC, and IFRS have placed a very stringent definition on “revenue recognition”. This means that although you can sell all you want, the company can only recognize the proceeds and profit in the financial statements according to strict rules.

    In the case of hardware (Sales of Goods), the customer must receive it (“delivery has occurred”), and like it enough to not return it (“amount to be refunded”), and be able to pay for it (“collection is probable”). If some are projected to be returned or unpaid, that percent is subtracted from total revenue. In the case of software (Sales of Services), it is generally accounted for over a time period. And because it is customary to send the customer upgrades, the revenue must be spread out over the time the service is provided. (“upgrade rights … 24 to 48 months.”)

    It gets complicated when a piece of hardware has upgradeable software. The rules used to stipulate that the hardware, in its entirety, must be accounted for as a service and have subscription accounting. This is how Apple had to report sales during the first few years of the iPhone. It still defers some revenues for its hardware, mainly on account of iCloud, but the vast bulk of hardware revenue (96%) is now accounted upfront, recognized upon the product's acceptance by customers. 4% is for software upgrades and is accounted for over a specific lifetime of the product (24 months in the case of the iPhone).

    What does "Shipped" mean?

    The discussion so far implies that if a product that is accounted for as "Sold" on an income statement does not mean that it's in the hands of an end user. These "revenue recognized" products are sold to a distributor, typically for a phone that's an operator.

    These sales satisfy the requirements for financial reporting as revenues booked. But they are not in the hands of users. Nor are they "activated" and they don't generate page views that are measured by web analytics companies. Most analysts and companies now use the phrase "Shipped" to describe these revenue-recognized units though it's also common to hear "sold".

    When a product sells to end users it's sometimes called "sell-through". It's counterpart is "sell-in" which is sales to the channel distributors.

    A big gap between sell-in and sell-through might imply large amounts of in-channel inventory. This is product that is sitting either in stores or in warehouses or on trucks in transit. If sales are steady, the inventory is measured in time as in "weeks of inventory". This means that the excess is expected to be sold within a fixed time frame if shipments were to end. The smaller this amount, the better or "tighter" the operations are. Inventory, as Tim Cooks says, is fundamentally evil. It eats capital and erodes profitability.

    Sometimes miscalculation of sell-through could result in vast amounts of inventory that has to be returned by distributors. That inventory is either written off or sold at fire sale prices resulting in a "write-down". This happened recently with both the HP TouchPad and with the RIM PlayBook. This special charge against income is a one-time (usually) incident but it can also affect a firm's reputation with channel partners for a long time. This type of failure is very costly.

    Therefore what matters most is to keep the difference between Sell-in and Sell-through as small as possible. However, it can't be too small. Sometimes if Sell-through is too fast, you get stock-outs which means that there is more demand than supply and sales opportunities are missed. This has happened many times with iPhones and iPads. This is also an unwanted situation (unless there was too much inventory in the channel during the previous period and thus it was being drained in the current period.)

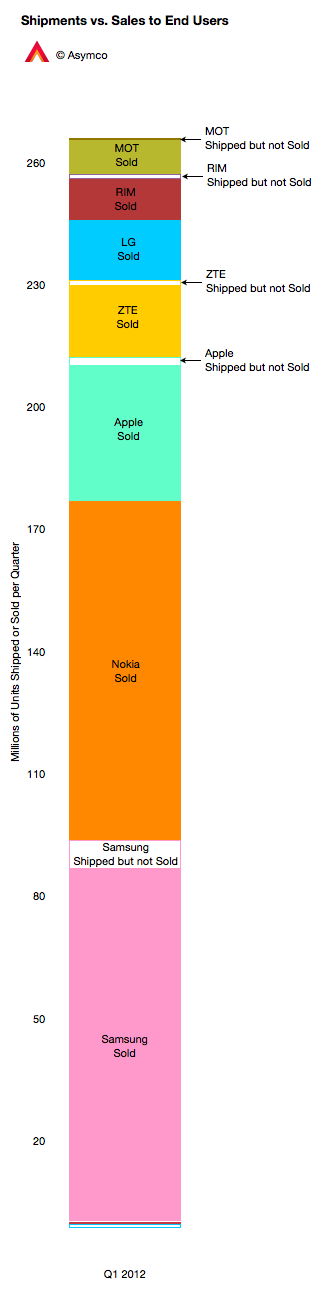
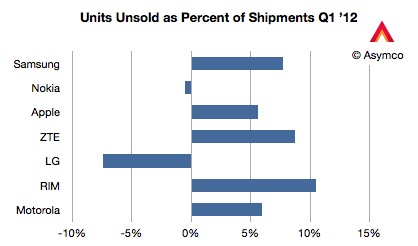
    The chart to the left shows how the phone market looked for various vendors last quarter. I compiled the data based on Gartner's "sales to end users" and IDC's "shipments" data. Two vendors had higher sell-through than sell-in (Nokia and LG) probably because they were draining excess inventory. The others had channel inventory of between 5% and 10% of units shipped.

    This ratio is shown below in a chart comparing the largest phone vendors.

    Management is often rated for performance on this metric, as they should be, since it's a measure of operational skill. However, there are many factors that affect overall performance.

    New product launches, windows of opportunity related to seasonal buying patterns, anticipating macroeconomic slowdowns, even natural disasters and legal challenges can affect this metric.

    Understanding the overall market requires an appreciation of this distinction but also an understanding of all the other metrics listed above and what stories they tell.

    ---

    Notes: My thanks to Michael Dediu for input on this discussion.

  8. Calculating Google's contribution to iPhone profitability

    Research · 16 comments

    In the iPhone cost structure analysis I showed how revenues and costs for iPhone are probably allocated. The revenue per iPhone was shown to include $29 for revenue items "above" the price of the phone to the channel. This total includes Apple's own iPhone accessory sales plus revenue from licensing the "Made for iPhone" trademark to third party accessory makers. Apple also receives some revenues from cloud services. But, pertinent to our recent discussions on the Android business model, Apple also receives revenues from Google.

    Wouldn't it be nice to know how much? Here's a way we can estimate it.

    I've read an estimate that 50% to 60% of ad revenues from Google search initiated via iOS are paid to Apple. This is believable because the TAC for Google overall is about 40% and Apple probably drove a hard bargain to get a premium for its, presumably, premium traffic.

    So if we knew the revenue run rate for Android search on a per device basis we could perhaps guess how much of each phone's revenue comes from Google. What we've heard last year in Congressional testimony is that two thirds of its mobile revenues come from iOS devices. This would imply that the run rate for iOS would be 2x the run rate for Android.

    Having a model of Android revenues helps at this point. Assuming Google obtains $4.4 from Android (excluding AdMob and App sales) and assuming negligible other mobile revenues from other platforms gives a possible Google revenue per iOS device per year of nearly $9.

    Taking the lower bound of the revenue share estimate above means that half of Google's revenue goes to Apple or $4.4/iOS device/year or $9 over the two year life of the device.

    That would put revenue from Google at about 1.4% of iPhone revenues (see average revenue per iPhone here). And that revenue comes without any costs and so flows straight to the bottom line. That, in turn, would imply that 3% of Apple's operating margin is provided by Google. Not a bad deal considering that some phone vendors can't get that for their entire product line.

    The interesting factors at work here are that this contribution by Google to Apple is higher than the contribution by Android to Google. In yesterday's post, I calculated that in 2011 Android contributed about $590 million to Google's operating margin (5% of total).

    If we consider that Google pays Apple $9[1] for every iOS device and since Apple sold 156 million iOS devices in 2011 then Apple received $1.4 billion from Google, all of which went to the bottom line.

    $1.4 billion from Google to Apple vs. $600 million from Android to Google. Three percent contribution of Google to iPhone profits vs. 5% contribution of Android to Google's profits.

    This sets up all kinds of game theorizing which will undoubtedly entertain and enrich us all.

    ---

    Notes:

    1. Perhaps this $9 value is not valid for all devices. Perhaps iPod touch does not get a lot of traffic and is less valuable. Perhaps iPads get more traffic and are worth more. On average, this may be plausible.
  9. Android's contribution to Google

    Research · 41 comments

    Yesterday I presented the estimated Android income statement vis-à-vis Apple's income statement. In this post I'll compare Android as a part of Google's overall business.

    Recall that Google has already been compared in terms of overall revenue, growth and profitability to Apple and Microsoft here.  The argument can be made that mobility has not yet had a measurable impact on Google (certainly not noteworthy enough to be reported by management).

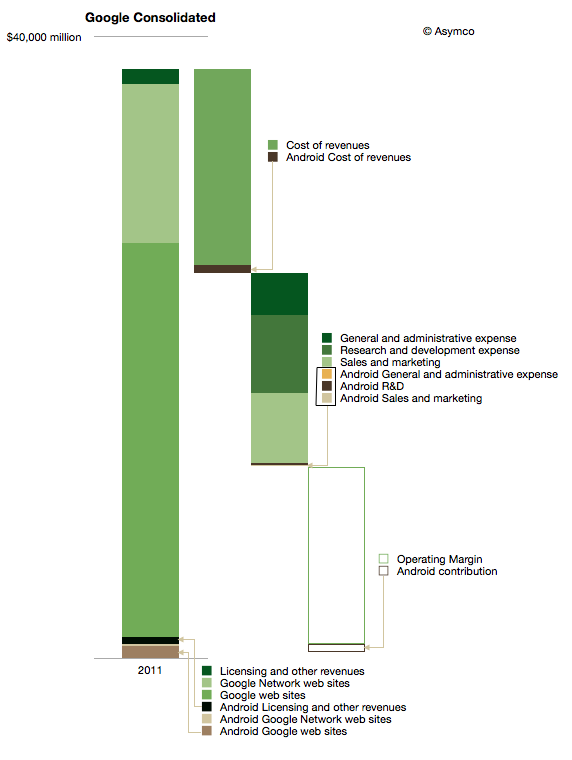
    The impact on Google of Android can be shown in the following diagram:

    I used color coding to identify non-Android (Green) and Android (Brown) segments of the business. Overall, Android could amount to about 3.5% of total Google revenues and about 5% of operating earnings.

    It's important to note that this is not all the revenue that Google obtains from mobility. This diagram represents Android only and there are revenues also coming from alternative platforms and operator deals.

    iOS contributes between 3 and 5 times more ad revenue to Google than Android.[1] The contribution to earnings is even more difficult to assess. We don't know the terms between Google and Apple for search revenue sharing and placement. One analyst suggests that the cost of sales (TAC) for mobile Safari search could be as high as 60%, far above what Android traffic costs.

    The other observation is that Android cost structure is quite small (see third bar from the left above.) My estimate is that Android R&D is only about 3% of total Google R&D. I'm projecting $200 million for 2012. That implies between 700 and 900 headcount. It's interesting to compare that total to the 20,000 or more that came with the Motorola acquisition.

    Having these estimates allows one to calculate many ratios and potential valuations. I'll refrain from putting a value on Android using multiples or sales or earnings, but would come out well below what was paid for Motorola's $12.5 billion.

    Which again compels one to ask what is the strategy at work here.

    ---

    Notes:

    1. There are various reports of the ratio including congressional testimony and reports to courts. BlackBerry, Docomo and KDDI were listed as significant other sources of ad revenue by Google in 2010.
  10. Android Revenues in Perspective

    Research · 87 comments

    Data is useful only when put in perspective. Yesterday's post on the Android Income Statement showed how sales and revenues are captured and how costs are paid for that revenue. The data was shown for the entire calendar year 2011 and the maximum value in the vertical axis was $1.5 billion.

    Google has also reported that their revenue "run rate" is now in excess of $2.5 billion so there is significant growth, as would be expected from an exponentially increasing user base.

    However, it's important to place this growth in perspective, both in absolute and in relative terms.

    Below is a diagram showing Apple's revenues for the first calendar quarters of 2010, 2011 and 2012. Each product group (iPhone, Mac, iPad and iPod) is shown separately with estimated gross margins (GM). Operational costs, taxes and net income are also shown.

    Consistent with previous versions of this data are the color schemes where white areas represent costs of goods sold.

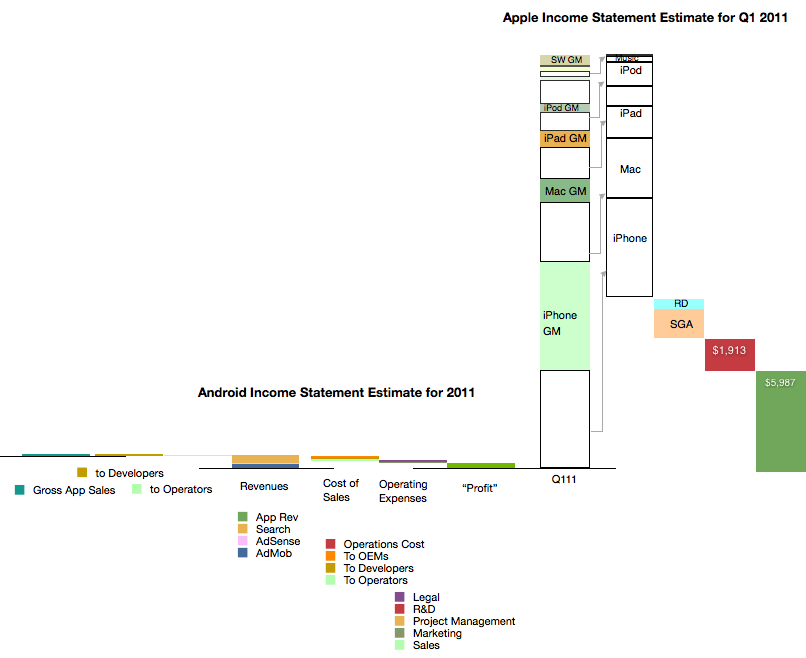
    I also placed a scaled version of the Android Income statement next to the first quarter 2011 revenue bar for Apple. The scale is maintained where $1 billion is represented by the double-ended arrow line.[1]

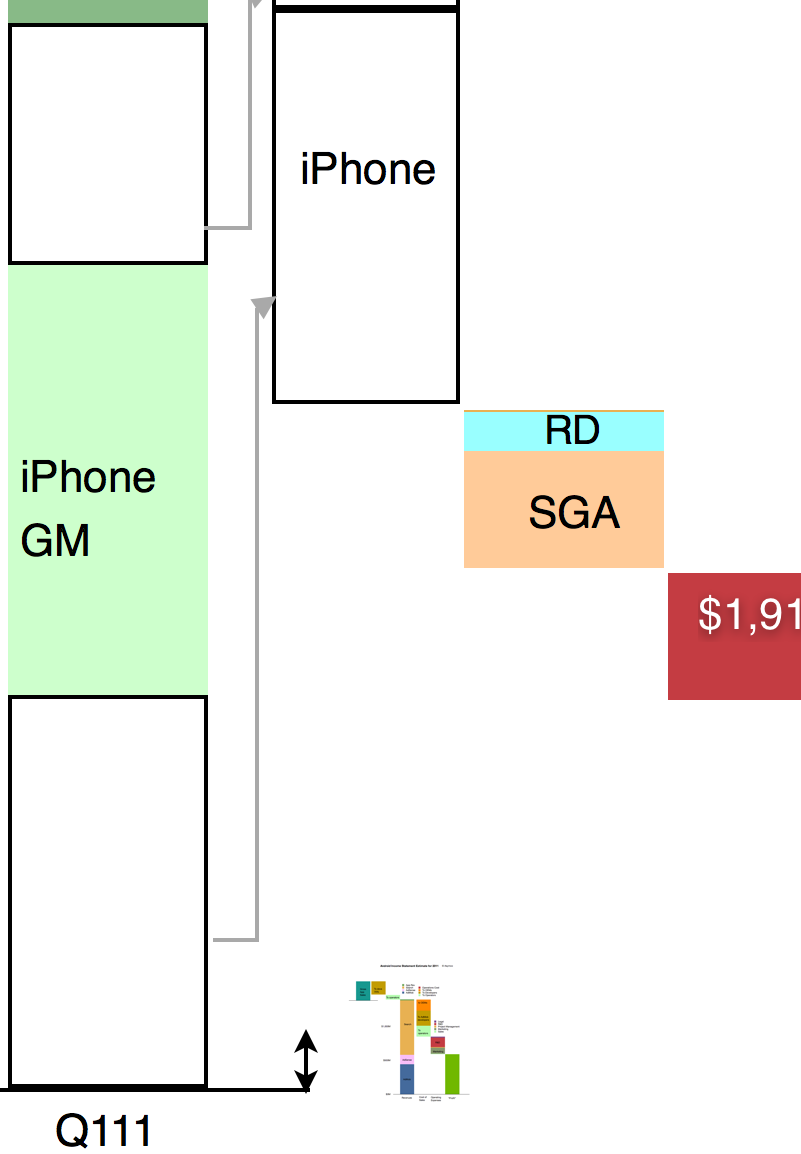
    It might be hard to see the Android section of the chart so I expanded it below at 400% the original:

    It is still difficult to resolve the data at this resolution but the picture should become clear nevertheless. Keep in mind that the iPhone data is for one quarter while the Android data is for one year. Comparing revenue "run rates", on a yearly basis Android is 2.5% of iPhone or 1.6% of iOS.

    As various members of the Android ecosystem are rewarded from the 40% revenue share of Android, it would be important to consider the scales involved in these illustrations when considering the influence Google exerts. It could be argued that Google's spreading of wealth from search creates strong incentives for participation in its ecosystem.

    However, there is little wealth created. 40% of a little is a lot less.

    ---

    Note:

    1. The scaling of the image in both X and Y dimensions can be deceptive. I provide the following view where only the vertical dimension (value) is reduced for Android
    1. :


  11. The Android Income Statement

    Research · 38 comments

    This is a continuation of the "Android Economics" series of posts. It deals with how revenues and costs are categorized for Android.

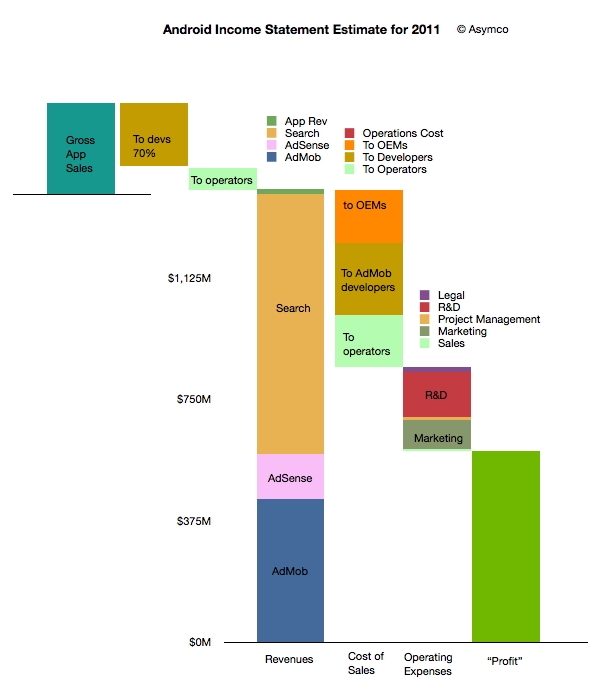
    The following diagram shows an approximate representation of what Android's "Income Statement"[1] would look like.


    I'll discuss the assumptions that are built into the model as I go along. I'll begin at the upper left and move toward the lower right in the discussion.

    The first thing to note is that sales from Google's (formerly known as Android Marketplace) Play are not registered as revenues. This is because Google, like Apple, treats itself as an agent. Agency means that the revenues don't "belong" to the agent but get passed on through to the primary beneficiaries. In the case of Play, Google passes 70% to developers (or content owners) and then distributes on average 25% to network operators (or carriers).

    I emphasize on average because there are many cases where Play transactions are not handled by or don't pass through operator billing systems. In those cases where operators are involved, it's possible that they capture more than 25%. It's not uncommon for operator billing to capture 45% of a transaction's value. The reason for this is that there is significant collection risk on billing--far more risk than on credit cards. It would also imply that on some transactions Google may be paying out more than it receives.

    This means that on average about 5% of Play content sales to be booked as revenues for Android.

    This 5% ends up a quite a small amount if overall app sales are small. We don't know the exact amount but anecdotal evidence from developers seems to indicate that they receive far more revenues from ad sales than from direct app income. Hence the size of the Android app sales is overall, modest. My estimate is that in 2011 there were about $330 million in gross app sales through the Android market. (Google estimated its sales to be 76 million for 2010 half way through that year.)

    The bulk of revenues are therefore from other sources: Search, AdSense and AdMob. I'm modeling that overall revenues are based on a "revenue per device in use" multiplied by the number of devices in use. Google has publicly stated that they are targeting $10/device/yr. in revenues. This is probably ambitious as the amount was nearly that much in early 2010 but the number of devices bought by emerging market consumers exploded. As they are not actively targeted by Google's primary customers (especially in China), the average revenue per phone is likely to be much lower. I estimated $6.5 on average for 2011.

    However, even if we use $6.5 per phone per year, the total revenues are quite strong since there were likely more than 215 million users at year end[2]. That results in a total revenue base of $1.4 billion for 2011. Removing the app revenues results in about $1.38 billion from Search and AdSense and AdMob.

    How to allocate revenues to these three businesses is mostly guesswork. I used a split of about one third to AdMob, 10% to AdSense and the rest to Search. If we assume this split then the next step is to consider how to allocate costs to these sources of revenue.

    As discussed in the introduction to this series, the primary costs of sales for Search and AdSense are network operators and OEMs or phone vendors. They are the primary "channel" which ensure the flow of search terms to Google. As Google also explains, the channel receives revenue share--so-called traffic acquisition costs (TAC).

    I used an overall allocation of 39% for TAC. Crucially, this includes the payments to developers for AdMob traffic. The rule of thumb I used was:

    • Network operators get 20% of Search
    • Developers get 50% of AdMob
    • OEMs get the rest (of the TAC)

    The resulting split is shown in the column above with the "Cost of Sales" at the bottom. There are also additional operations costs which are negligible.

    After this 39% TAC (revenue sharing), Google needs to pay its operating expenses. This includes R&D, Marketing, Sales and Legal costs for the Android division (including AdMob). You can see the approximate values in the column labeled "Operating Expenses". This operating cost amounts to about 27% of sales, with R&D at 14% and Marketing at 9%. These rather high fixed costs make sense as there is a significant development work underway for Android.

    Finally, after these costs are allocated, the remainder is the contribution of the division. This comes to about 34% of revenues which is called the operating margin. Google has to attach depreciation from data centers and other costs as well as taxes before placing this into earnings.

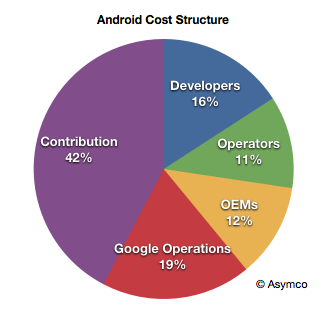
    Considering the agency structure, the overall cost structure of Android looks like this:

    When playing with the assumptions, it becomes clear that the model is most sensitive to the revenue per device and total devices in use. The profitability is entirely dependent on those figures as variable costs are a percent of sales and fixed costs are limited by talent constraints.

    For example, if revenues per device drop to $4.5/yr then the operating margin drops to 38%.

    Now we can calculate some of the more interesting figures. For example:

    • Android OEMs receive $0.76 on average per device per year
    • Android Operators receive $1.07 on average per device per year (including Play)
    • Android Developers, as a group, receive $1.94 per device per year (including Play and AdMob)
    • Google receives a contribution of $2.75 per device per year from Android

    Again, these figures are very sensitive to the revenue per device (currently assumed to be $6.5).

    Because of the number of devices involved, these cash flows are an important part of the value network of mobile computing. The next step will be to assess how they affect the incentives, alignments and competitive stance of various platforms vying for a seat at the table of the future of information.

    --

    Notes:

    1. An income statement shows the sources of revenues and the costs associated with those revenues. It also shows the fixed costs (or costs which are independent of revenues so they don't go up or down if revenues change). Finally it shows the operating income which is called contribution if it's a division within a company. This contribution is still subject to taxes and depreciation before it's recorded as earnings.
    2. I'm using Android installed base estimated based on daily activation rates as published by Google. I've discussed these estimates here. I'm using year-end estimates but subtracting retirements based on a two year device life.