Asymco

Asymmetric Intelligence

Industry

  1. Android economics: An introduction

    Research · 51 comments

    Android has had unprecedented growth. Based on activation announcements, it's possible to estimate that thus far, about 370 million Android devices have been activated. The total number of devices in use is a lower figure which depends on replacement rate and retirement rate. This total number of devices in use at year end is estimated in the following chart.
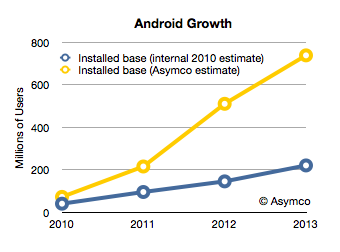
    I added the blue line which represents what Google had as an internal estimate in mid-2010.[1] The difference between the two lines shows that Android's growth is far higher than what the company expected.  If the company itself did not expect this growth, it's unlikely anybody else did either.

    Unexpected, exponential user growth is usually accompanied by a dramatic positive improvement in the finances of a company and a higher return to shareholders. The curious aspect of Android's success is that it has not had an impact on either. The market has not "discounted" the half-billion anticipated Android users into a price for Google shares that reflects this growth. It can only imply that those users are not very valuable.

    But why would there be such a disconnect between the number of users and their value?

    In order to answer this question we have to come to grips with what I call "Android economics". We need to understand how Google uses Android to make money and whether it is succeeding and if it's not, why not.

    In many ways, the Android business model is straight forward. It's an extension of the existing Google business model: Revenue is obtained from Search, AdSense and the applications that enable these two.  In the case of Android there is also revenue from app sales (Google Play a.k.a. Android Market) and from AdMob. Of course, all these revenue sources (except for Play) are sold through other mobile channels that include alternative, competing platforms. They are present on iOS, Symbian, BlackBerry and even embedded OS phones ranged directly by carriers. For each of these alternatives, Google pays for placement of their search as the default search in the browser.

    To Google, total search revenue from iOS is far higher than it is from Android. That's because iOS users engage more with their devices and there are not yet a large multiple of installed Android users vs. iOS users.

    But it would make sense that having your own platform would be more economical because there would be none of these placement fees. In this sense Android is another "channel" for distribution of Search and AdSense. But one which may be a lot cheaper.

    However, it turns out that it does not work that way. Android has other costs.

    In fact, Android's distribution costs might be higher than other channels. What we have to understand is that all of Google's channel revenues have a "cost". The revenue from a particular distributor of search results that Google generates is offset by the cost to acquire the terms. You can think of it as Google paying for the queries through a revenue sharing agreement. Google does not get search terms directly and depends on distribution. Overall, it pays about 50% of revenues back to distributors. In the case of its own web sites the rate might be lower, perhaps 40%.

    Google even has a term for it: Traffic Acquisition Costs or TAC.

    This revenue sharing in exchange for search terms extends to Android. Google pays about 40% TAC to Android distributors of those searches. But since Android is owned by Google, who does Google need to pay for traffic? Who is an Android distributor? Who gets the revenue share?

    Google does not make a secret of it: network carriers and device vendors (OEMs) receive revenue share. From the latest earnings conference call:

    Yes. I mean, again, I'm not going to talk about specific of the TAC on mobile. But as you know, we get people using our devices both organically as well as through our distribution partnerships with carriers and OEMs. And typically, the OEMs and carriers participate in some of the economics that are on the Android marketplace or Google Play and some of them participate in the economics around Google Search just the way we would do syndication on the Web platform, which you do with many partners around the world. We have similar deals on the mobile front.

    - Nikesh Arora, senior vice president and chief business officer at Google Google Management Discusses Q1 2012 Results - Earnings Call Transcript - Seeking Alpha

    Arora made another point in the quote above. Not only is there revenue sharing with carriers and OEMs for Search and AdSearch but also for Google Play (app and content sales.)

    Device vendors and carriers get a cut. Google's model has always been one of giving a cut of revenue to their upstream distribution. It just might be surprising to hear that device vendors like Samsung and carriers get a piece of Search and apps.

    This basic observation leads to a series of questions:

    • How much is paid out and to whom?
    • Is that revenue sharing sustaining the ecosystem? Do vendors create Android devices and do carriers push Android to consumers because they get this revenue share or is the amount insignificant vs. device margin? What about tablets? Why haven't Android tablets they taken off as Android phones have? Are the economics to blame?
    • Is this a competitive advantage vs. other platforms? Does Windows Phone compete with revenue share for Bing? Is Microsoft offering a bigger carrot (as well as a stick?)
    • How does this economic picture show up in Google's financial and stock price performance? Or, more precisely, why doesn't it?
    • And, finally, what conditions create a virtuous cycle of growth and what conditions could turn it into a vicious cycle of decline? Is there a lurking factor which would cause Google to benefit greatly from this user base or is there an inherent point of failure in the model?

    I'll be answering these questions in a series of posts this week.

    --

    Notes:

    1. Google's internal documents were leaked as part of the Oracle trial (Exhibit 1061). They can be found by using Google search with the following search term: "OC quarterly review".
  2. What retail is hired to do: Apple vs. IKEA

    Research · 123 comments

    “Within five years after discount retailing pioneer Korvette’s opened its first store in 1957, over a dozen copycat discounters had emerged. In contrast, the giant discount furniture retailer IKEA has never been copied. The company has been slowly rolling its stores out across the world for [close to 50] years; and yet nobody has copied IKEA.

    Why would this be? It’s not trade secrets or patents. Any competitor can walk through its stores, reverse engineer its products and copy its catalog. It can’t be that there is no money to be made: its owner Ingvar Kamprad is the third richest person in the world. And yet nobody has copied IKEA.

    Our sense is that the other furniture retailers have followed the positioning paradigm and defined their business in terms of product and customer categories, which are readily copied. Levitz Furniture, for example, sells low-cost furniture to low income people. Ethan Allen sells colonial furniture to wealthy people.

    IKEA, in contrast, has organized its business around a job to be done: “I need to furnish my apartment (or this room) today.”  When this realization occurs to people anywhere in the developed world, the word IKEA pops into their minds. IKEA is organized and integrated in a completely different way than any other furniture retailer in order to do this job as well as possible.”

    Integrating Around the Job to Be Done (Clayton Christensen, Harvard Business School; Scott Anthony, Innosight LLC, Scott Cook, Intuit; Taddy Hall, Advertising Research Council).

    IKEA is the world's leading furnishing retailer and an amazing success story. As Christensen points out the success is all the more perplexing because it seems perfectly defensible. Nobody has tried to duplicate or undermine IKEA.

    Positioned around a clear job-to-be-done it integrated design, manufacturing and distribution (including warehousing) as well as "big box" retailing as an experience.

    This may sound familiar.

    Apple's entry into retail depended on a clear job-to-be-done, design, carefully selected merchandise and retailing as an experience. Similar to IKEA, Apple also became a dominant player in its segment and even achieved seventeen times better performance than the average US retailer in terms of sales per square foot.

    At first glance they seem to be similar businesses in terms of strategy or "architecture" but how do the actual businesses stack up? Can we find data to support any claim of similarity.

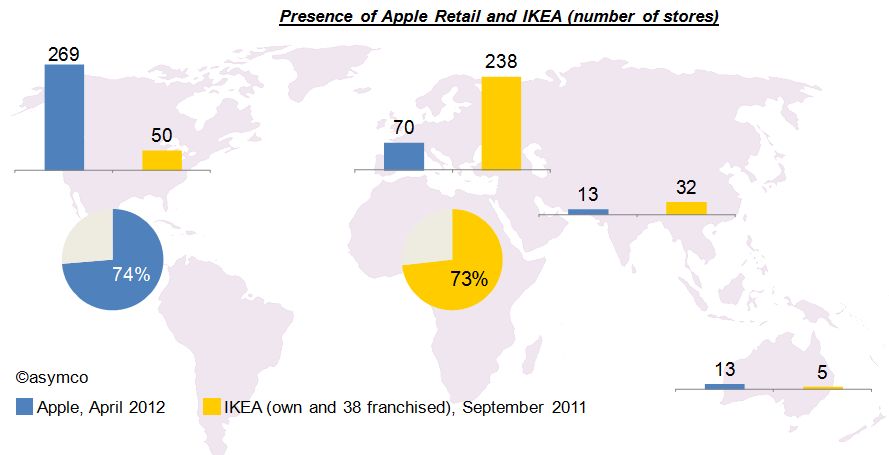
    Let’s first have a look at the geographic focus of both companies. The graphic below shows that Apple’s retail operations are focused on North America with 74% of its 365 stores in the USA and Canada. By contrast, and maybe as much based on its origin, 73% of IKEA's 325 stores are located in Europe[2].

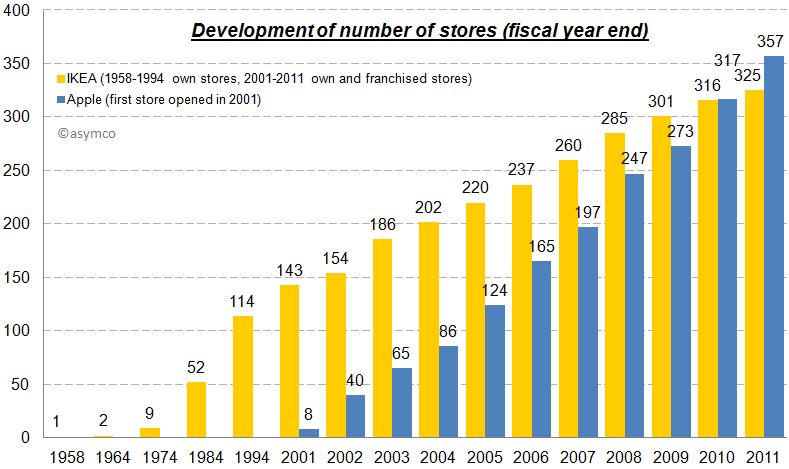
    Unlike Apple however, IKEA has grown much more slowly. IKEA’s first store was opened in 1958 and had 6,700 sqm (72,110 sqf). The first two Apple stores opened in May 2001. Since then the number of Apple stores grew significantly faster (CAGR: 46%) and surpassed the number of IKEA stores in 2010.

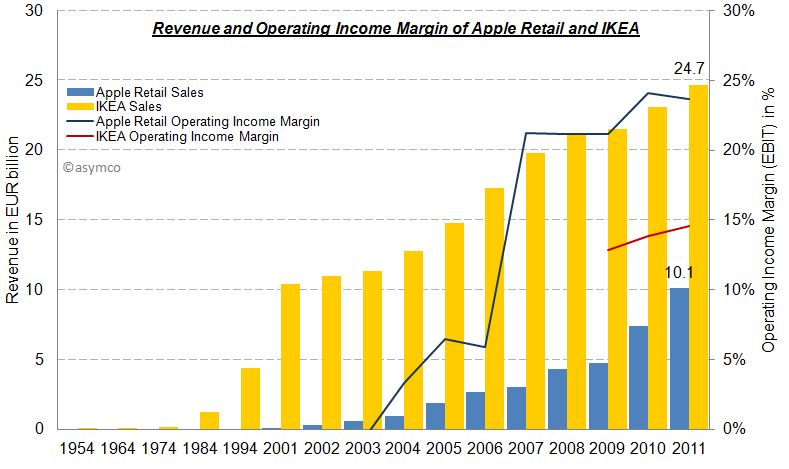
    The other difference is in sales growth. In 1954 IKEA’s revenue amounted to approximately $1 million but has grown steadily (note in chart below that first five bars represent decades). In contrast, Apple has grown more rapidly and is also more profitable in terms of margin.

    Part of the difference in growth is that Apple was able to subsidize its entry: Apple’s retail operations were loss making for the first three years while IKEA had to rely on financing from its own cash flows.

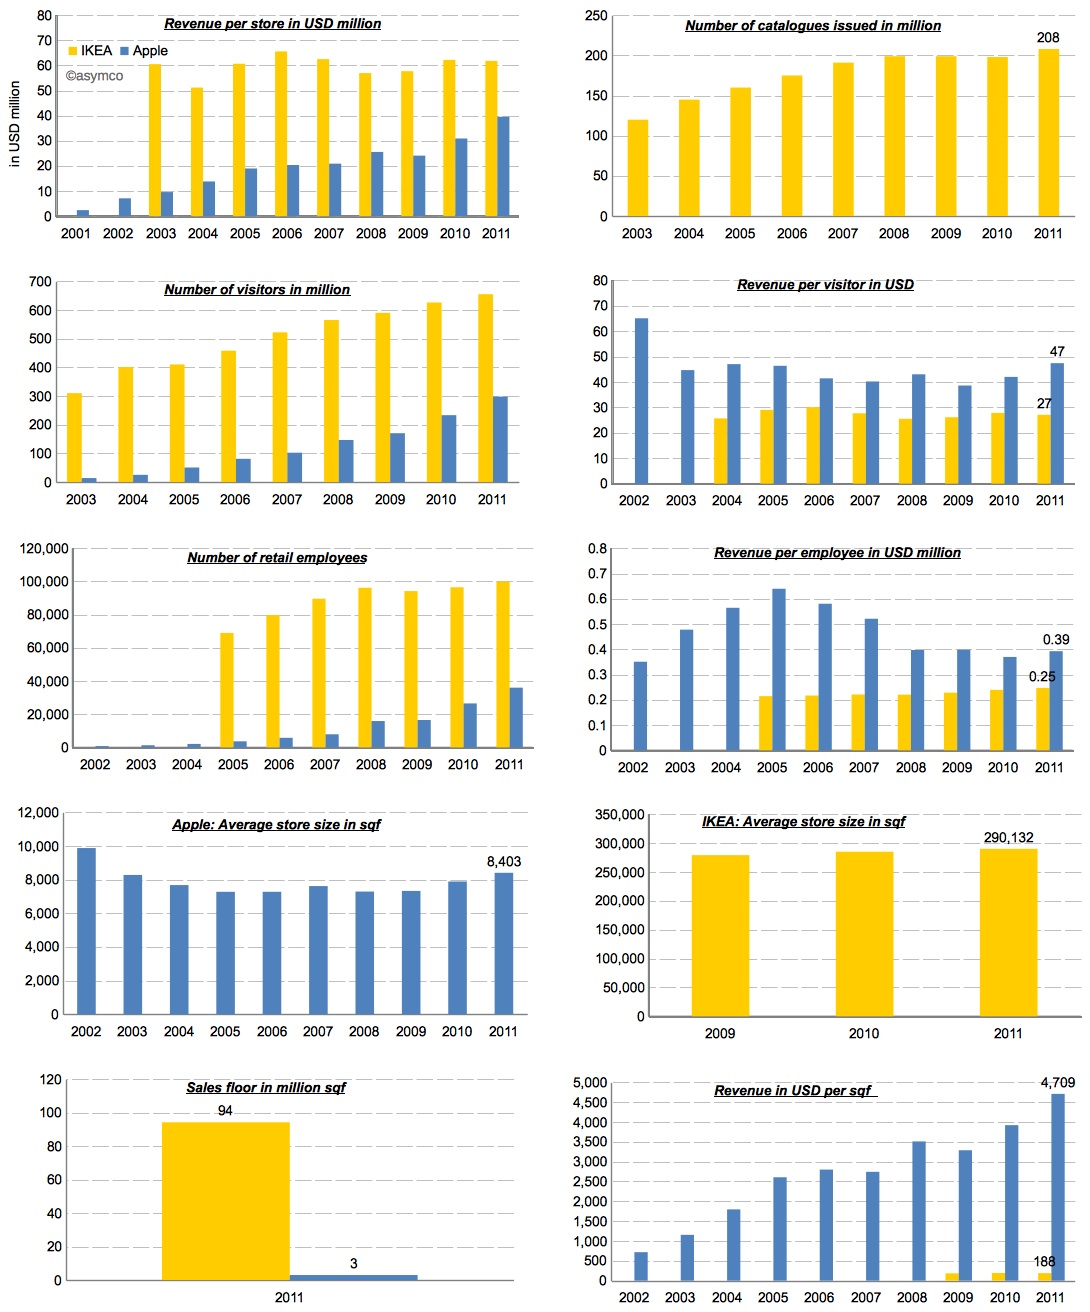
    Eventually, Apple retail became self sufficient and is now more profitable than IKEA. The following charts provides an overview of the economics of Apple’s retail operations and IKEA side-by-side:

    While Apple’s revenue per store is still growing, IKEA’s business seems more mature and stable. This makes sense because furniture prices are stable and the number of products (SKUs) depends on available area per store which cannot grow. Apple on the other hand is limited only by traffic issues. Its products take little space and can even be stored off-site.

    Speaking of traffic, with 655 million visitors in 2011, IKEA had more than twice as many visitors in its stores compared to Apple. However, each visitor spent about $27, while Apple’s store visitors purchased for almost twice as much.

    The same story applies in employee productivity. IKEA has three times the number of retail employees, but Apple’s revenue per employee are 1.5x bigger than IKEA’s.

    The largest difference is in the efficiency of real estate. In terms of total sales area IKEA’s operations have more than 30 times the sales floor of Apple.

    As much as these numbers tell a story, they don't help us understand the cause of success. The two companies have completely different operations and their metrics seem at odds to one another. What works for one could never be applied to the other.

    The fact is that there is no magic economic formula for disruptive retail. For example, by measure of sales per square foot, IKEA would not even make the top 20 list of US retailers.

    However, there is one major thing they have in common: a clear formula for positioning your retail operations. Both operations are positioned around a job-to-be-done that has a high priority in people’s life. As mentioned in the opening quote, In IKEA’s case it is “I need to furnish my apartment (or this room) today” and in Apple's case Tim Cook said it best:

    “Our retail stores provide the best buying experience and the best customer service anywhere. And while that’s important for a buyer of a Macintosh, in some ways it’s even more important for a buyer of an iPad or an iPhone or another post-PC device because these devices are new to many people. There needs to be a place to discover them, to learn about them before they are purchased, and learn how to get the most out of them after they’re purchased.” Tim Cook, March 2012

    Apple offers a place where people can discover and get answers about technology without the pressure of making a purchase. The job is to simplify that which is complex for a price premium.

    IKEA offers a place where people can get exactly what they need exactly when they need it. The only downside is that "some assembly is required". In a way, their job is to introduce some complexity in exchange for convenience and a discount.

    In the end, they both get the job done and are amply rewarded for it.

    ---

    Notes:

    1. Including 13 in Russia.
    2. The acquisition of UK-based furniture retailer Habitat in 1992 is the only exception.
  3. The phone market in 2012: a tale of two disruptions

    Research · 93 comments

    During the first quarter this year HTC, RIM and Nokia all surprised investors with bad news. The effect is evident in the share price of these companies which, in the case of RIM and Nokia is around book value, and in the case of HTC, neared 12 month lows and a 70% drop from peak.

    These "misses" in earnings and expectations are on top of the already woeful news from Sony Ericsson and Motorola, which have not had profits for years and LG, which has been borderline since late 2009.

    In combination, this seems to imply a dearth of profits in an industry that is, by all measures, booming. Units are up 7% with smartphones up 47%. Revenues are up 20% and overall profits are up 52%. This are exceptionally strong numbers. Few industries can measure growth in double digits.

    So if the industry is booming but the majority of participants in the industry are loss making (and surprisingly so) then what is going on? There are two answers: new market disruption and low end disruption.

    The new market disruption is the migration of a large number of demanding customers away from phones-as-voice-products to phones-as-computing-products. The low-end disruption is the migration of a large number of less demanding customers from branded phones to unbranded, commodity phones.

    The New Market Disruption

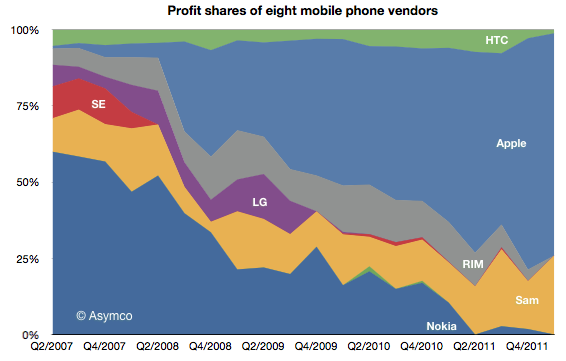
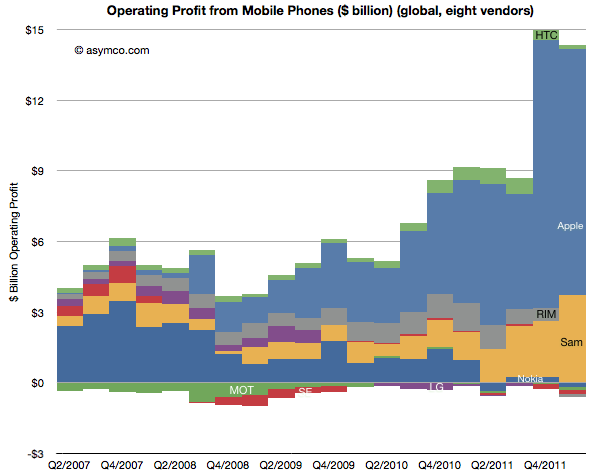
    The new market disruption is evidenced by the shift of fortunes to Apple and Samsung and away from every other device maker. Here is the profit picture:

    Of the vendors tracked (public companies who report mobile phone divisional performance), Apple obtained 73% of operating profits, Samsung 26% and HTC 1% [1][2].

    The "share of profit" picture is potentially misleading because it could imply that the profits available are a constant. They're not. The absolute profits picture below shows how the industry actually expanded available profits by quite a lot. Two years ago the vendors generated profits of $5.3 billion in the first quarter  and last quarter they generated $14.4 billion.

    Seen this way, the story isn't so much that Apple "took the profits from the incumbents". Rather, it's that Apple created a vast new pool of profits. And one need not look far to find out where they came from: operators. These profits were mostly carrier premiums for the iPhone 4S.

    Before shedding tears for operators, consider that although this does amount to a current transfer of profits from carriers, the decision is a popular one. Hundreds of operators have made it. It's unlikely that they all colluded to be robbed. Indeed, they willingly hand over these premiums because the iPhone ensures a competitive advantage or preserves their customer base from churning. The calculations that go into a decision to range the iPhone are compelling enough that 250 operators made the decision (though, crucially, there are still 250 who have not).

    Following this value proposition to its logical conclusion would suggest that the industry is rewarding those who can supply computers-as-phones which preserve the cash flows of what is essentially a trillion dollar data services business. Vendors which cannot offer this solution saw their businesses implode. At least on the high end.

    The low end disruption

    Simultaneous with this shift of the high end to smartphones-as-app-and-service-platforms came an explosion of growth in unbranded phones. As Apple led and most brands followed the new market, the old market of voice-oriented phones was abandoned to new entrants offering cheap "good enough" phones. Nokia tried to preserve its volumes and margins there but it's becoming increasingly difficult.

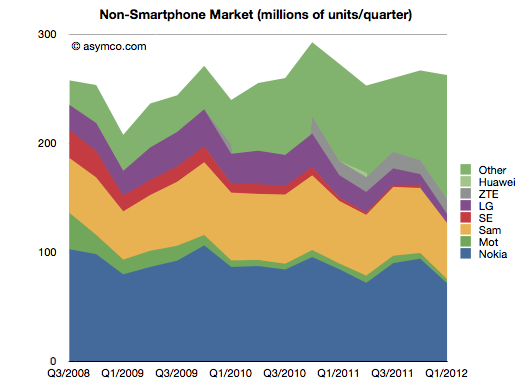
    The following chart shows how the "Other" vendors have come to make up about 44% of the market.

    Note that although this "feature phone" segment is not growing, it is still a large market (250 million units a quarter). The entrants in this market are numerous (perhaps in the thousands) and they are offering white label and unlicensed knock-off products. They are also offering unregulated (i.e. without IMEI numbers) products which are technically illegal and sold mainly in underdeveloped countries which have no incentives to enforce regulations.

    This is a consequence of feature phones reaching the point of being "good enough". The feature set and quality are adequate for voice, text, games and even media playback and are priced at $30 or less.

    This commoditization of the low end is pressuring what would normally be the fallback cushion under an underperforming smartphone business. The crisis for the incumbents comes from not only being unable to shift to the new market as fast as needed but also from not having cash flows from a low end that was thought to be sustaining.

    This combination of two disruptions is why we see an explosively large and growing market failing to reward all but two of the participants.[3]

    ---

    Notes:

    1. You can download, view and interact with a motion chart for the industry data here. All data is sourced from company filings except for some estimates where data is missing.
    2. Operating profits are sales minus cost of sales minus operational expenses attributed to the business. When not available, opex is estimated as a percent of total in proportion to sales. Note that operational income excludes taxes, depreciation and other capitalized costs.
    3. We cannot say that the thousands of low end entrants are unprofitable. They are probably enough profits to sustain them and even to attract more entrants, but we have to also recognize that there are likely to be very low margins.
  4. 400 million phones per quarter and everything's topsy turvy

    Research · 39 comments

    Sony Ericsson is no more. The company remains but the brand is gone. Now the phones it makes will be sold under the Sony name. Unfortunately, that means we no longer get reports from the company on its volumes, profitability and sales. The units will be part of "Other" from now on.

    That vendor's data disappears as did HTC's and Samsung's earlier reporting. Bit by bit, vendors are withdrawing information. RIM stopped reporting its average selling prices some time ago, Motorola may disappear completely and they already stopped reporting tablet sales.

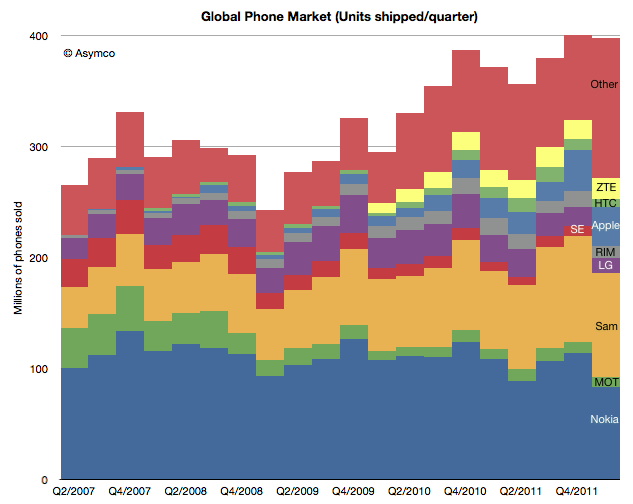
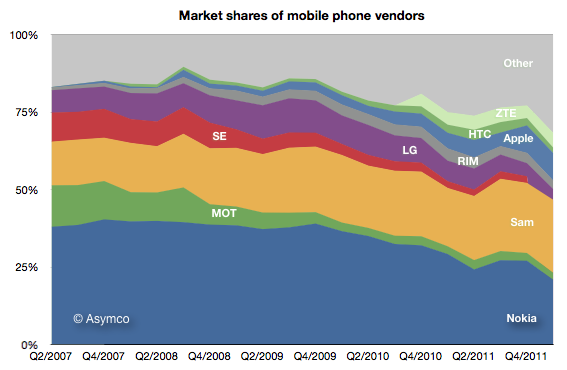
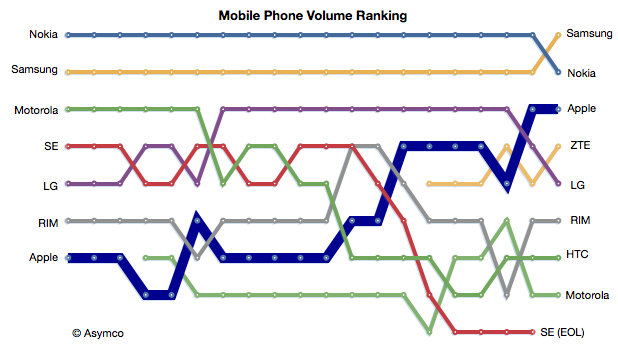
    This makes the picture of the market fuzzier each quarter. We have to rely more and more on analysts who publish estimates. I try to pick from the available data the best assumptions but the errors are undoubtedly increasing. Here are the charts showing unit volumes in terms of absolute, share and ranking.

    As I wrote previously, Samsung has overtaken Nokia which lost the top spot in unit shipment ranking, a spot it held for 14 years.

    Of all the participants, only three brands enjoyed growth this last quarter: Apple, Samsung and ZTE. ZTE, like Apple, is noteworthy for its late entry. The others are in a mess: Motorola -4%, Nokia -24%, RIM -26%, HTC -29%, LG -44% in terms of unit growth y/y. This, while the market managed a modest gain.

    It still find it fascinating that such a large market, selling 400 million units every quarter can exhibit such rapid change in participant ranking.

  5. Which is best: hardware, software or services?

    Research · 43 comments

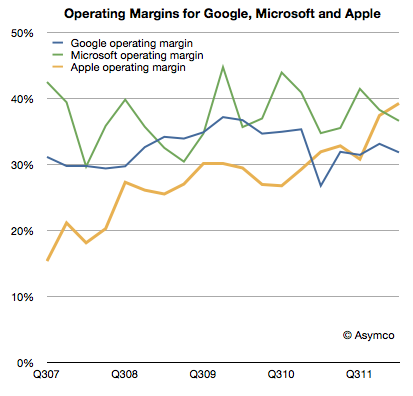
    Apple's recent margins are nothing short of spectacular. It's hard to convey just how remarkable 47% gross margin and 39% operating margins are. For a company that sells hardware these are simply unheard-of numbers.

    The best way I can illustrate this is by comparing Apple's operating margins with those of two other platform-based companies, Google and Microsoft.

    Microsoft invented the software-as-a-business model and, as software is easily reproduced, their margins are phenomenal. The gross margins are typically in the 80% range for software. Overall, the company had higher R&D and SG&A expenses so their operating margins are a more modest 37% on average. However, Apple managed to exceed this value even though it has the disadvantage of actually having to build things made of atoms.

    Google also has led a charmed life free of inventory and factories. Its operating margins have been however hurt by investments needed to sustain the infrastructure for indexing the internet. That means that their margins have hovered around 33%.

    As the chart above shows, Apple has been creeping up on both these benchmark companies with exceptional operational leverage and, as of this last quarter, overtaken them.

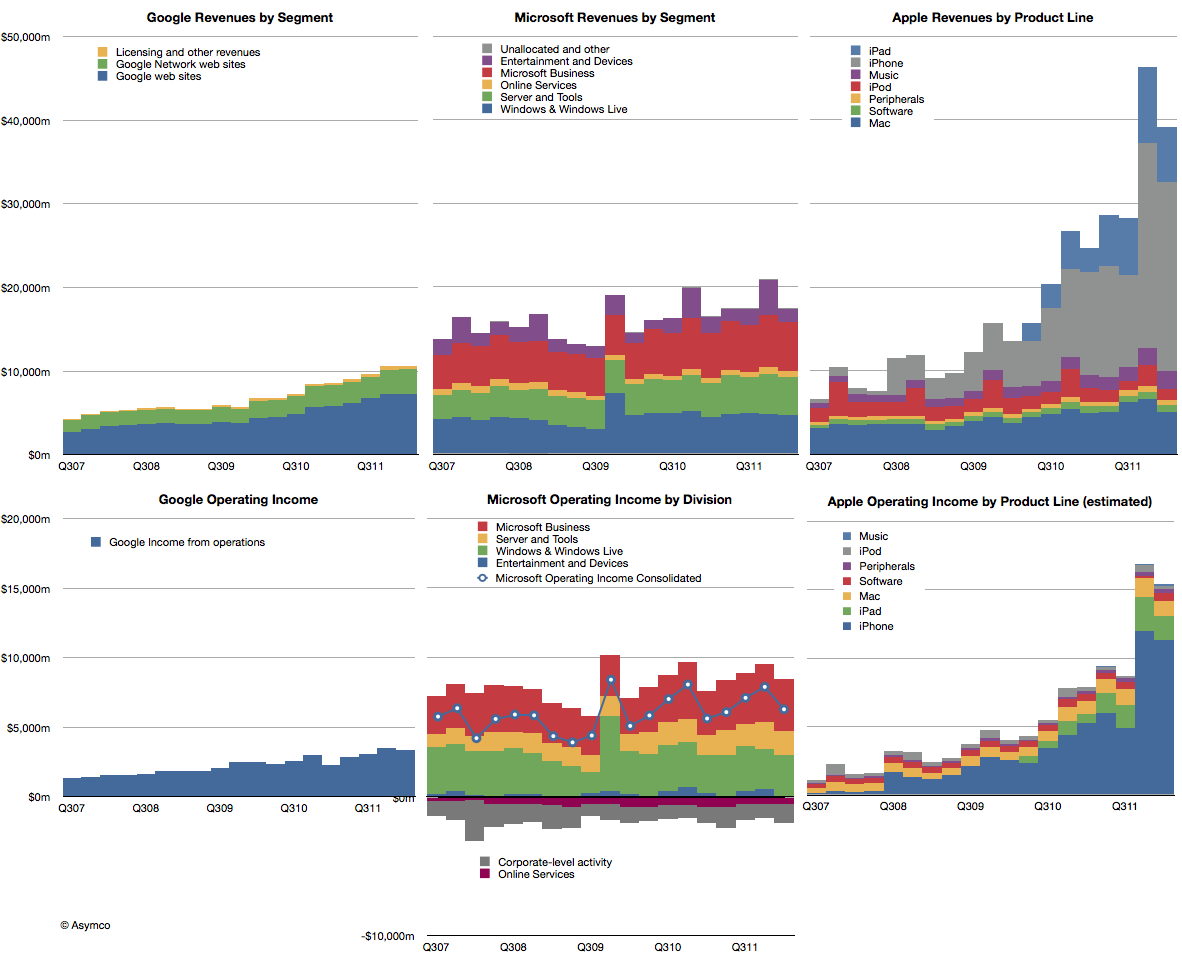
    The reason Apple is able to do this is that its iOS businesses are extremely profitable and, as those businesses grow in absolute terms and relative to its other businesses, the overall margins are reaching into the stratosphere.

    The impact of iOS on Apple is shown in the right-most two charts below. The difference in growth relative to these other great companies makes Apple all the more impressive.

    But the temptation is to compare the "core" business models and ask which is best: hardware, software or internet services. It would seem that hardware is winning, suddenly getting the best margin and best growth--a dramatic reversal with prior technology business dogma.

    However, it would be a mis-reading of what allows Apple to succeed. Apple is the most valuable company in technology (and indeed in the world) because it integrates hardware, software and services. It's the first, and only, company to do all these three well in service of jobs that the vast majority of consumers want done.

  6. Apple's Growth Scorecard for the first quarter of 2012

    Research · 115 comments

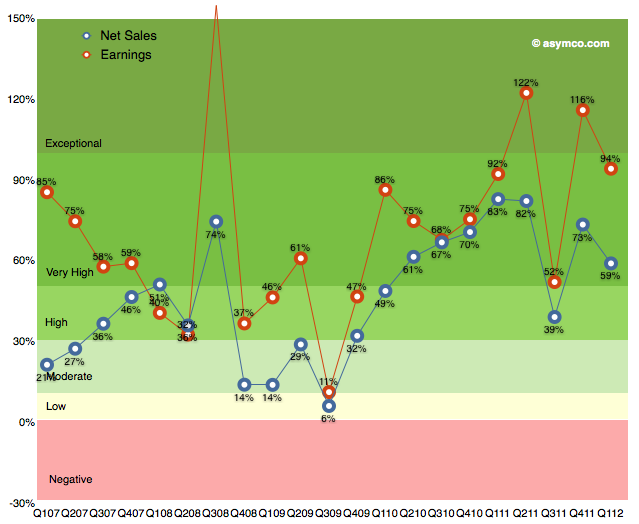
    For Apple 2012 started with almost the same growth as 2011 started. Q1 2011 saw earnings growth of 92% and Q1 2012 saw growth of 94%. As the following revenue growth table shows, the pattern for the last twelve months has been very consistent:

    Here are some notes:

    • The iPad is growing at a faster rate than the iPhone and has achieved in two years what the iPhone took four.
    • The iPhone grew units at nearly 90% and revenues at 85%. This is slightly below the quarterly average over the last two years of 99%
    • The Mac showed significant weakness though the previous year's Q1 had exceptionally high growth of 32%. The Mac still grew faster than the market and therefore gained share
    • The iPod is declining consistently. Units showed a lesser decline than revenues as the average price dropped from $164 to $157.
    • The iTunes store continues to grow very rapidly, reaching a new record level above $2.1 billion revenues
    • Peripherals were weak with 11% growth but that may have something to do with lowered Mac sales
    • Software had good quarter though not exceptional
    • The top line grew at nearly 60% which is not exceptional but the bottom line grew at 94% which is above average

    Overall, the company had a very good quarter and showed consistency, which, incidentally, implies predictability. The following graph shows the top and bottom lines in historical context with color coding matching the table above.


  7. Unforgiven: The consequences of profit failure in mobile phones

    Research · 34 comments

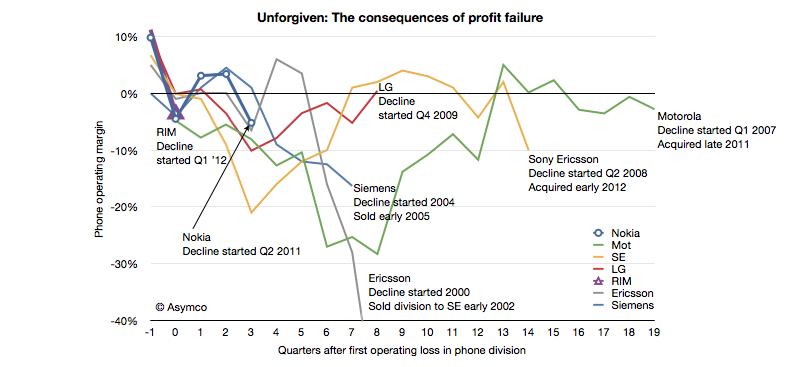
    In June of last year I wrote a post titled "Does the phone market forgive failure?" It was written on the eve of Nokia's Q2 2011 report highlighting the historic consequences of a dip into negative operating margins for a phone vendor.

    I listed 13 phone vendors who were either merged, liquidated or acquired. There are no examples of vendors who recovered from a position of loss making.

    I was prompted to follow-up by a note Charter Equity Research analyst Edward Snyder wrote illustrating the effect of negative operating margins on phone vendors. I took his illustration and expanded it with additional data.

    Since my post in June last year Sony Ericsson and Motorola were acquired making the victims list total 14 companies, with Nokia, LG and RIM having joined the "endangered species list". If the pattern repeats, then RIM and Nokia are in early phases of what promises to be an extended period of pain followed by an exit.

    What the analysis does not answer is when a vendor loses its independence after beginning loss making. Motorola took 20 quarters; Sony Ericsson 14, Ericsson 8 and Siemens only 7. We cannot tell if or when LG, which is still operating after 8 and Nokia, which is now in its fourth and RIM, now in its second quarter post-loss, will lose independence.

    The rumors swirling around RIM and LG are centered around exits and some suggest Nokia will follow. Many also argue that these companies will recover. The conditions they each face are different in details but broadly they are the same. Earlier last decade the exits were prompted by loss of brand value and subsequent loss of distribution. This decade disruption brought upon by mobile computing brings with it new business models centered on ecosystems and value captured through software and services.

    Until and unless these endangered companies solve the dilemma of having the wrong business model at the wrong time, the chances are that they will not be forgiven for market failure.

  8. Google and Microsoft speak volumes with silence

    Research · 23 comments

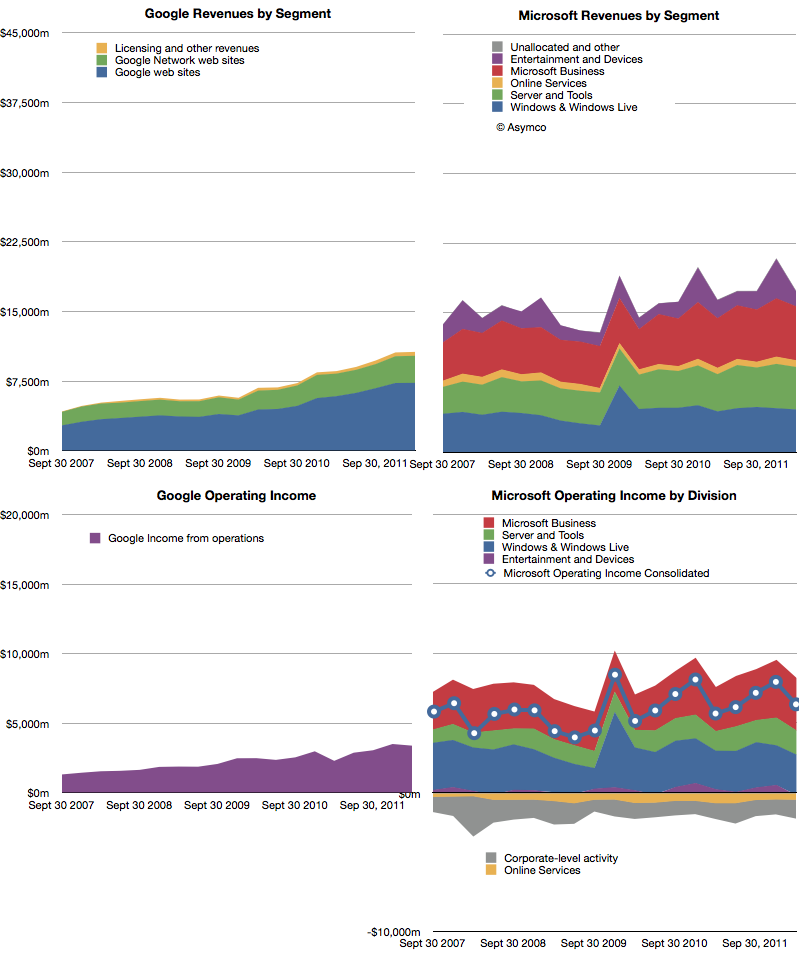
    The following charts show Google and Microsoft revenues and operating income:

    Both companies showed healthy growth. Revenues: Microsoft 6%, Google 24%. Operating Income: Microsoft 12%, Google 48%. Google had a particularly weak margin Q1 2011 so its income growth appears very strong.

    The surprise in Microsoft's performance was the 4.8% increase in Windows revenue at a time when PC sales were expected to be declining or flat. Final PC numbers are not yet out so we'll have to check back on this figure to see whether Microsoft has been able to get higher pricing for Windows or whether the market did expand. (Average revenues per PC sold have been quite steady for years). Overall, Microsoft's business shows consistency. Of course, that should not be cause for comfort. Nokia had remarkable consistency until it jumped from a burning platform and RIM grew more rapidly until its platform imploded.

    As Google still obtains 96% of its income from advertising, it's quite remarkable that it is now at 61% of Microsoft's revenues. Google is also growing more rapidly than Microsoft so the possibility exists that the top ad service will overtake the top software company in revenue, establishing a new benchmark for how software can be monetized.

    The curious thing about both of these companies' financial performance is that mobility does not appear to have had any impact on either top or bottom lines[1].  There is no business division or income statement line that can be attached to mobile revenues. Microsoft placed Windows Phone under Entertainment and Devices but that division is dominated by Xbox and accessories. Google bundles everything under Advertising and has never broken out mobile, much less Android-derived income.

    The surge in valuation for mobile-focused startups seems to leave investors in both these companies unaffected. The damnation for both companies lies in mobility being non-core businesses whose strategies center on reaction and defense.

    ---

    Notes:

    1. Google does not answer specific questions about the impact of mobile on their business but they do acknowledge that there are traffic acquisition costs (TAC) associated with OEMs and Carriers who deploy Android. This means that there are costs of mobile sales (i.e. Search) but not to any measure of specific value.
  9. Forecasting Nokia's Windows Phone sales and Microsoft's mobile customer acquisition cost

    Research · 55 comments

    Our agreement with Microsoft includes platform support payments from Microsoft to us as well as software royalty payments from us to Microsoft. In the first quarter 2012, we received a quarterly platform support payment of USD 250 million (approximately EUR 189 million). We have a competitive software royalty structure, which includes minimum software royalty commitments. Over the life of the agreement, both the platform support payments and the minimum software royalty commitments are expected to measure in the billions of US Dollars. The total amount of the platform support payments is expected to slightly exceed the total amount of the minimum software royalty commitments.

    From Nokia's Q1 2012 financial interim report

    The figure of $250 million for Q1 is the same as the amount Nokia received for "platform support" in Q4 2011. This means Microsoft has paid $500 million over two quarters. During the same time frame Nokia shipped approximately three million Windows Phone devices. The average cost to Microsoft to acquire a Nokia Windows Phone user is therefore $167 per user. This is down from $250/user in the last quarter.[1]

    If the royalty is equivalent to a license fee then the more interesting question is how and when will the royalty payments nearly match the platform support payments as expected. This might give us an estimate of what both parties are expecting from the relationship.

    If the payment schedule of $250 million per quarter is maintained through 2014, Microsoft will have paid $3.25 billion to Nokia. This is well within the "billions of US dollars" range that is cited above. (The minimum would be $2 billion which would mean payments through the end of 2013).

    We also need to estimate the royalty payment structure. One figure that has been circulating for a long time is that Microsoft prices Windows Phone (and its antecedent Windows Mobile) at $15/unit. It's an aggressive price point for a mobile software license and should be subject to volume discounts but let's assume it's correct. If it is correct then the only remaining question is how quickly will Windows Phone units grow at Nokia?

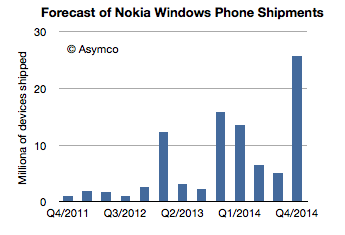
    One way to begin is to calibrate WP growth to iPhone growth. For the first two quarters iPhone and Lumia have sold at rough parity.[2] iPhone sold 1.4 million in its first quarter (including opening weekend sales of 270k in previous quarter) while Nokia sold "approximately" one million Lumias in its first quarter[3]. In the second quarter Nokia cited 2 million Lumia units and Apple had 2.3 million iPhone sold in Q4 07. So far Lumia is slightly under the iPhone ramp, but let's give it the benefit of doubt.

    If we  apply iPhone growth rates to Lumia then we have the following sales forecast for Nokia's Windows Phones:

    This looks like healthy growth, as was the iPhone's. However, this "iPhone growth" pattern only results in about $1.4 billion in payments in exchange for $3.25 billion from Microsoft, leaving a deficit of $1.9 billion in the "platform support" balance.

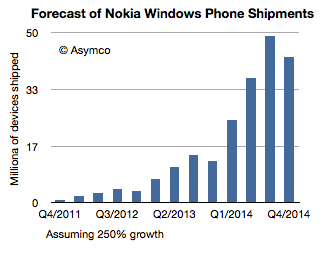
    To erase the deficit, I tried an approach where I assigned 3 million and 4 million for Q2 and Q3 shipments respectively then applied a constant (y/y) growth rate thereafter. Solving for a figure of growth which results rough parity with platform support payments gives us about 250% growth. The resulting sales profile looks like this:

    This ramp would result in 210 million Windows Phones shipped over about three years. It would also generate nearly $3.2 billion in "royalties" for Microsoft offsetting $3.25 billion in "platform support" payments by Microsoft to Nokia.

    There are many assumptions in this, royalty rate and length of contract chief among them, but the key question should be a sanity check: is this a feasible product ramp. It's certainly far faster growth than Apple has been able to achieve. On average Apple obtained about 160% quarterly y/y growth. It also exceeds the growth rate that Samsung has been able to achieve (165 to 170 million smartphones shipped from a standing start three years ago). It implies 150 million units shipping in the third year of sales and nearly 50 million in a peak quarter. It assumes perhaps as much as 20% market share in smartphones in 2014. It's certainly ambitious.

    But even if it's achieved, it's only a break-even point for Microsoft's relationship with Nokia. It would imply that payments to and payments from Nokia would be in balance. The road to (dare one say it?) profitability for Microsoft in mobile would just begin to be visible at that point.

    ---

    Notes:

    1. What the quote above also reveals is that Nokia is also expecting to pay back some of these "support payments" in the form of "royalty payments" for the software. That's an interesting word choice as usually an OEM would pay a license rather than a royalty for software. I'm not sure if this implies anything but it may.
    2. See also Charles Arthur's analysis of comparable growth ramps for mobile phone platforms here.
    3. This figure was cited "to date" in a March statement so actual calendar Q1 may have been less, perhaps 650k.


  10. Nokia's evaporating brand value

    Research · 59 comments

    Nokia reported Q1 results following very closely the warning issued last week.

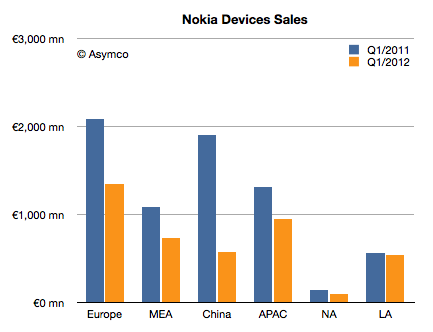
    There were few surprises. There is much more detail in terms of regional performance which might be a better indicator of how the smartphone strategy is playing out. I plotted the data in three charts.

    Regional Sales Value

    A year ago Europe and China were nearly equally valuable as regions to Nokia (€2.1 billion and €1.9 billion, respectively). Even though sales fell across all regions, China fell so much that it has become the fourth in value and nearly the same value as Latin America (€577 million for China vs. €542 million for Latin America). This is a significant reversal for a very important market. The drop in value is a staggering 70%. Is there some clue as to what caused this?

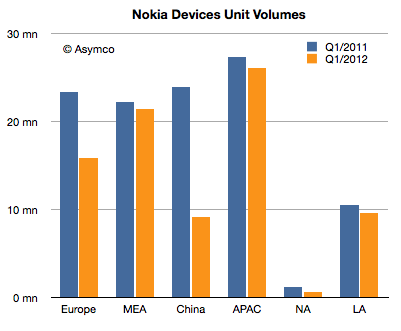
    Regional Unit Volumes

    The data on volumes shows that Europe's drop is consistent (35% drop in value coupled with 32% drop in units). This implies an erosion in pricing but not a very large drop. However, in China the volumes fell less rapidly than sales (70% drop in value and 62% drop in volume). The pricing story was significantly worse. This story repeats in Middle East, Africa and Asia Pacific where volumes held but value dropped. This implies significant change in pricing in those regions. That's borne out by the chart below:

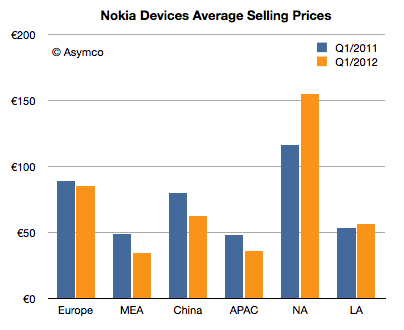
    Regional Selling Prices

    Prices in Europe dropped by about 4% but in China they dropped by 21% (from €80 to €63). In APAC the drop in price was 25% and in Middle East and Africa it was 30%. In the Americas prices increased with North America up by one third and Latin America by about 6%.

    This uplift in NA is primarily due to the Lumia launch as channel was being filled. However, note that North American volumes were extremely small: only 600,000 units sold (inclusive all models).

    As the Lumia line was not available in many markets, and as only 2 million were sold, it's hard to see its impact. The only clear effect was on North America prices and that overall smart devices ASP held the line (down only 2% y/y and up 2% sequentially). The €220 average price for Lumia was well above the €143 for all smart devices sold. Nevertheless, smart device volumes were down 50% to about 12 million units--nearly the same as RIM's pitiful results.

    What these data points add up to is that Nokia cut pricing aggressively while losing volumes. The price cuts were "forced" by conditions and probably were designed to slow the drop in demand. Emerging markets, once Nokia's core growth area, showed dramatic value contraction due to price pressure. Nokia's brand value, which normally allows for price premiums regardless of functional value, is clearly evaporating in its last bastions.

  11. Apple Stores have seventeen times better performance than the average retailer

    Research · 49 comments

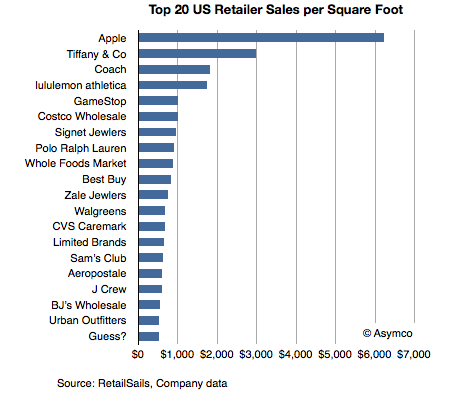
    Thanks to RetailSails we have some data on retailers in the US which can be used to calibrate the performance of Apple retail. RetailSails compiled a table of the top 20 chains by sales per square foot (annual basis). The total sample was 160 American retailers (excluding restaurants) that publicly report results.

    Sales per unit area is a standard and usually the primary measurement of store success. Here are some benchmark figures:

    • Annual store sales in the range of $300 per square foot is considered respectable in the US.
    • The US national average for regional malls is $341.
    • The average for specialty apparel retailers is $400 per square foot.
    • The average for jewelers is in the range of $600 per square foot.
    • The median for the best 20 US retailers is $787/sq. ft.

    The data for the top 20 is shown in the following chart:

    The data shows Apple leading by a significant margin. It's more than twice as efficient as the second place Tiffany and Co. It's also more than seven times the median of the top 20 and seventeen times better than the average mall retail space.

    Note also that this data includes only physical retail and excludes e-commerce, catalog or services revenues. It should only be used to compare physical retail performance.


    The achievement is also remarkable when measuring growth in overall sales.

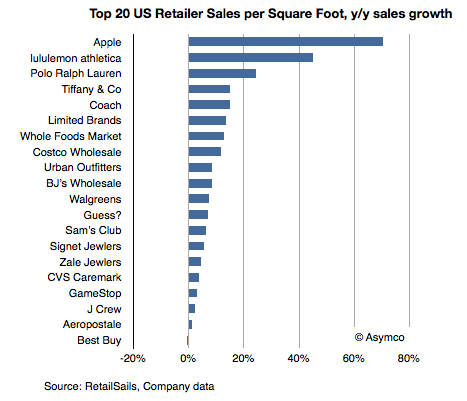
    Apple leads in absolute performance but also in growth.

    Note also the performance of electronics retailers that might be comparable to Apple. Only Best Buy and GameStop are on the list, but their growth is among the poorest, with Best Buy going in the wrong direction (data was current as of August 2011).

    We'll be getting an update on Apple retail at the next earnings call in a few days. To read more about Apple retail see:

    Apple retail growth data | asymco

    The growth surprise in Apple retail | asymco