The mobile phone market is growing rapidly. It grew 18% in the last quarter. The smartphone market grew even faster, about 75%.
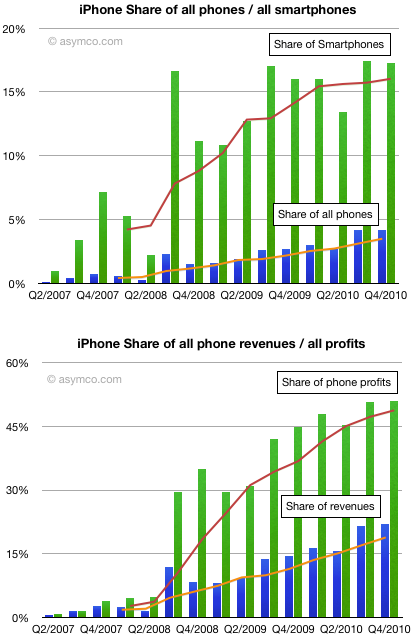
To grow share in this market means growing even faster than the market. What we can see from the following charts is how the iPhone as a product grew in share since it was launched 3.5 years ago:
Unit share growth slowed in the last quarter but the fourth quarter is not usually the most expansive for Apple. That is usually the third quarter which is the first full-availability launch quarter.
The iPhone ended the quarter with 17.25% smartphone share and 4.2% phone share. Share of revenues was about 22% and share of earnings was about 51%.
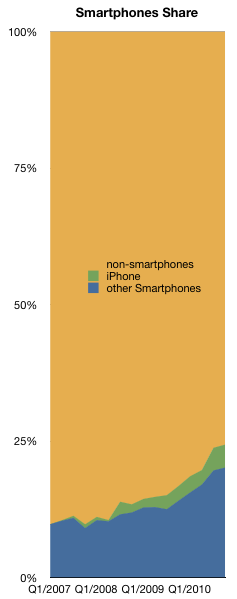
I still hold that 20% smartphone share is possible for the iPhone. As the smartphone market slowly becomes the entire phone market (see chart to the left) that share will be worth something.
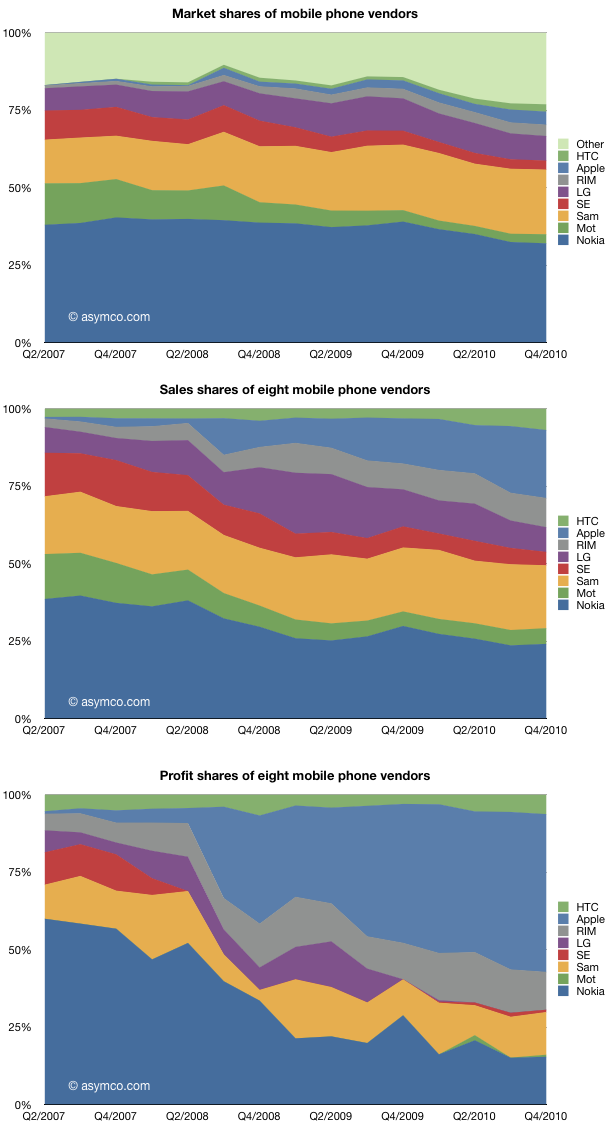
The following chart shows the units, sales and profit shares for the top eight phone vendors.
The fourth quarter did not see change in the ranking of the top eight vendors except for Sony Ericsson dropping in sales rank (to eighth). Samsung beat RIM to third spot in profit ranking, a position it held for most of 2009.
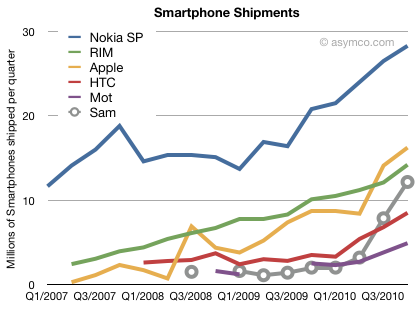
The smartphone market grew 73% in Q4. Here are the growth rates for vendors which regularly report smartphone sales:
HTC: 142%
Motorola: 96%
Apple: 86%
RIM: 40.5% (period ending November)
Nokia: 36%
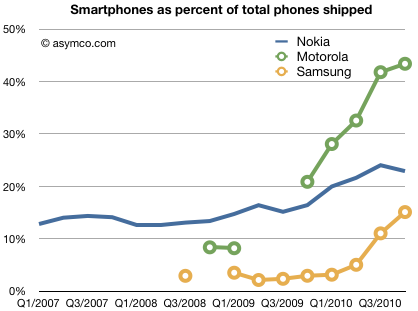
Samsung is not consistent in reporting smartphones and we don't have year-ago data but the following chart can be used to get a hint.
Samsung had a very good year with 25.2 million smartphones sold. This is compared to 2009 when they probably sold less than 5 million. Their growth has meant they overtook both Motorola and HTC and are likely to overtake RIM this year.
Samsung owes its success mainly to adopting Android. As can be seen in the next chart, Samsung moved rapidly to shift its portfolio from non-smart to smart. This is quite a feat considering the starting point well below that of Nokia.
From 2% of total phones to 15% smartphone volumes in 18 months is astonishing.
Extrapolating for the missing data leads to an estimate of smartphone growth for Samsung of over 500%.
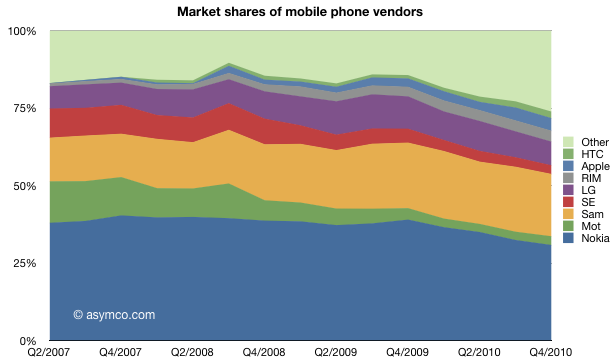
The trend toward ZTE, Huawei and others taking volume share from the traditional incumbents continues. Smartphones continue to capture value share. Dedicated smartphone vendors HTC, RIM and Apple would make up the third biggest single vendor, starting from a very small base.
Looking over this three and a half year period, the change in the market is quite dramatic.
Nokia must compete on an ecosystem to ecosystem basis.
In addition to great device experiences we must build, capitalize and/or join a competitive ecosystem. The ecosystem approach we select must be comprehensive and cover a wide range of utilities and services that customers expect today and anticipate in the future.
These kind of statements are signaling that there will be fundamental changes announced.
Here are my guesses for the February 11 announcement:
There will be a multiple OS strategy
The US market will be the first to see a new non-Nokia OS. I would guess Windows Phone with AT&T.
Low end devices will remain with Symbian due to price considerations for the chipsets, components.
MeeGo will be phased out in phone products but development will continue for tablets
This may seem like a radical departure, but in many ways it's not. Nokia has nothing to lose in the US as its platforms have zero traction. By maintaining Symbian for low end devices, they can still aim for differentiation where Nokia feels it still has distribution and cost leverage. This strategy will also allow speed in time to market.
‘Any argument that a pad is not a PC is simply out of sync,’ said Chiam. ‘With screen sizes of seven inches or above, ample processing power, and a growing number of applications, pads offer a computing experience comparable to netbooks. They compete for the same customers and will happily coexist. As with smart phones, some users will require a physical keyboard, while others will do without.’
‘Each new product category typically causes a significant shift in market shares,’ said Chiam. ‘Apple is benefiting from pads, just as Acer, Samsung and Asus previously did with netbooks. The PC industry has always evolved this way, starting when Toshiba and Compaq rode high on the original notebook wave.’
Five years ago, back when Gartner and IDC were confused about what a smartphone was Canalys was on top of the market and was the first to correctly describe the smartphone.
Kudos for being first again to recognize a re-defined market.
Thanks to David Chu for forwarding the data that made this possible and reader Narajanan for spotting the divergence in platform efficiency.
iOS and Android are both growing rapidly. According to Gartner, during the first three quarters of 2010, about 44 million iOS devices and 36 million Android devices were put into use. That's 80 million devices. An amazing achievement for two platforms that did not exist 3 years earlier.
But obviously not all devices are used the same way. Devices which have unused capabilities limit network effects for a platform and for the category of product in general. Question is: how can we measure the "smartness" of a device; how much more likely is a device to be used as a mobile computer vs. being a regular phone?
The best proxy I can think of is a measurement of browsing use. The smarter the device, the more browsing is a joy and the more it is actually done. Browsing leads to more data load on the network and creates a virtuous circle of revenues for the mobile computing value chain.
If we could measure the increase in browsing generated by each additional phone, we could compare whether one platform is better (specifically, more efficient) at generating value asymmetric to voice.
Fortunately we have data from Netmarketshare.com (see sources below) which attempts to track browser consumption and hence allows us to measure this variable. What we need to pair that with is the incremental increase in the installed base of devices.
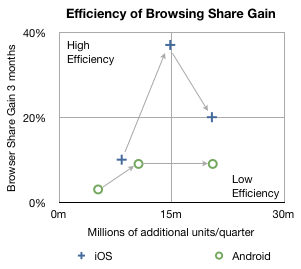
In the chart below I plotted how much browsing share increased for every phone sold by platform over the first three quarters of 2010.
The arrows indicate the sequence in time from Q1 to Q3. The vertical axis shows gain in share three months after the corresponding number of units shipped in the previous quarter on the horizontal axis. So, for example, the second circle means that in the second quarter approximately 10 million new Android devices created a gain of about 9% in browsing share. In the same quarter, 14.8 million iOS devices created about 37% gain in browsing share.
In the third quarter approximately the same number of iOS and Android devices shipped (iOS including iPads and iPod touch) but the browser gain was 20% for iOS vs. 9% for Android.
A line drawn diagonally from lower left to upper right (0,0 to 30m,40%) could represent the average gain in share per units sold--the sort of measure we're looking for.
Measuring that slope tells us that, on average, every million devices sold should generate a gain of 0.75% share[1]. I took the additional step of labeling two quadrants which are orthogonal to the expected trend. If browsing increases dramatically faster than 0.75%/million units then I call those devices sold as creating "highly efficient" browsing gain. If browsing increase lags dramatically below 0.75%/million units then those devices added share with "low efficiency".
So four data points follow the trendline down the middle of the chart, however, there are two notable outliers. Finding the causes for these outliers gives clues to what's happening with the platforms.
I believe the explanation for iOS's second quarter's extraordinary efficiency is that was the quarter when the iPad launched. It seems to have yielded a very strong spike and the trajectory of iOS improved even into the next quarter as those iPads continued to be in use. iPad seems to be a very effective way to gain browser share.
I also believe that the cause for Android's fall in efficiency in the third quarter was that it began to be sold in large quantities in the developing world. The third quarter saw a rapid acceleration of sales without a proportional increase in what was measured as sales in the US (and Europe).
Interpretation
If this trend continues, and there is no guarantee that it will, then a question could be raised about Android's value to, of all people, Google.
The core value of Android to Google is the increased use of browsing and hence search. All the other Google services and in-app ads are tiny opportunities in comparison to the potential of search on mobiles. One could argue that the raison d'être for Android since day one was to create browsing consumption. In that regard it's not as good at doing that as iOS is.
Perhaps Google can justify the under-performance of consumption of browsing (and hence search) on Android devices as benign since there is no marginal cost added to supplying Android to non-consuming devices.
But I wonder. There is the problem of opportunity cost: Those iOS devices that create more browsing activity are going to take more share. The more they do that the more Google will have to pay Apple for placement as the default search in mobile Safari.
It may be a stretch, and perhaps the data is wrong, but that's what this exercise is all about: how much can we learn from fragmentary data? Without a hypothesis there is no discovery.
-----
Notes:
Since these platforms have very low shares (less than 2% for iOS and 0.3% for Android by November) almost all the gains can be assumed to be against other browsers (e.g. Internet Explorer) and not against each other.
Update: the original Unit estimates excluded iPad and iPod touch which have since been added.
Given new information on subscriber growth and the relationship between Verizon and Apple, it's time to look back and assess how the conclusions are standing up.
The conclusions I drew were that Verizon had three strikes against them:
The iPhone has stolen their growth
They are facing the prospect of a single OS platform supplier
Android is not competitive vs. iOS
Did iPhone really hurt Verizon?
I pointed out that based on retail sampling data from ITG and what we know from AT&T own sales data, that iPhone at AT&T was outselling Android at Verizon by a ratio of 2.5 to 1.
The latest comScore data closely matches the assumed units of Android shipped by Verizon. Here's why: The comScore data shows the number of active users of each platform. So, for example, as the number of Android users at Verizon grew, it follows that the new users had to buy new Android phones. However, you can also sell more phones than just those for new users. Some phones are going to go to replace those of existing users.
When it comes to Android however, all the Verizon Android devices are pretty new, having been purchased less than a year ago. Replacements would only be sold for damaged or lost devices not covered by warranty.
So from comScore the change in subs at Verizon comes out to about 2.2 million and my original estimate was about 2 million. That's pretty close.
On the other hand, if you look at the chart, you'll notice that the number of iPhone users at AT&T grew by a similar amount (about 2 million). However, AT&T activated over 5 million. That means that about 3 million devices were upgrades. This makes a lot of sense since we know that iPhone is the bulk of AT&T smartphone users.
This is highly supportive evidence that iPhone at AT&T did indeed outsell Verizon Android by at least a factor of 2. Each of those phones came with a 2 year lock-in so indeed AT&T did manage to "steal" growth from Verizon.
Another data point in support of this conclusion was provided by Turley Muller in a comment. AT&T smartphones make up a significantly higher proportion of contract subs at 44% vs Verizon at 23%. Effectively, as a result of their sweetheart deal with Apple, AT&T got double the penetration of smartphones than Verizon since these devices are targeted only to contract subscribers. Those are high ARPU customers that either moved from regular voice plans or switched from other carriers.
So far, the first conclusion seems to be holding up pretty well.
Was Android a strategic constraint to Verizon?
Verizon revealed that they had been negotiating with Apple at least since 2008 and that they were testing the phone for a year. This is not as big a surprise as it may seem. Deals of this kind easily gestate for years. The commitment may not be made until the last minute.
Nevertheless, my point was about the fact that Android was making up to 75% of Verizon's smartphone volume in Q3. This might be a strategic constraint. But "so what?" you may say: AT&T's dependance on iPhone was even greater.
That's precisely my point though. As we've seen with the shift by Apple to multi-carrier distribution, AT&T is now facing serious constraints on growth and the share price is suffering. Although Verizon did not deal with Google as a direct supplier, they were at risk of having much of the IP on their network at least orchestrated by a company that was not always aligned with their strategic goals. Much the same predicament AT&T is facing now.
The tale of AT&T and iPhone does lend support to the premise that Verizon felt a bit too constrained by Android hegemony on its network.
Is Android Competitive with iOS?
This last point was supported by the data showing a widening higher sell-through rate for iOS vs. Android on comparable addressable markets. Although the data has been confirmed with survey data, there are issues with this interpretation. First, because the addressable base for iPhone is higher at AT&T with the post-paid contracts being more popular there, iPhone had an easier time getting sold. Second, because 3/5 of the phones were upgrades.
The jury is still out but the apparent pent-up demand (admittedly anecdotal) for iPhone on Verizon does seem to show that given similar pricing, and a similar demographic/geographic addressable market, people do prefer the iPhone.
Chief Executive Philipp Humm said in an interview that many of his smartphones will eventually be made up of Google-powered phones costing less than $100, half as much as the smartphones typically available at U.S. carriers. In October, to lower the cost of monthly bills, Mr. Humm introduced a limited data plan that costs $10.
T-Mobile seems to be attempting to differentiate on price. In a regular market reaching saturation that might be a viable strategy. However the market is neither regular not saturated. T-Mobile's chances of gaining large share are limited.
Churn, or the chance that a user will switch networks is still very low. If anything, AT&T and Verizon are more sticky and lose fewer customers than T-Mobile and Sprint.
Mobile computing saturation (25% to 30% penetration) is also not nearly at a point where competition on price leads adoption.
Lastly, the $100 price point is being put against the standard $200 price point which itself is an illusion for the user. The drop in smartphone entry price is not as powerful going from $200 to $100 as it is from $300 to $200. Psychologically, $200 is an inflection point. Apple's $100 3GS pricing (now $49) is defensive and probably effective.
In short, the market for telecom services is not very "liquid" and users are quite trapped in their carrier contracts, pricing is not yet a basis for competition and pricing illusions persist.
In conclusion:
Mr. Humm, in an interview at the Consumer Electronics Show in Las Vegas, acknowledged that the likelihood Verizon Wireless getting the iPhone as well could affect his subscriber numbers.
With a market share of 31.5 percent, Nokia is still the largest vendor of handsets in the Indian market, followed by Chinese brand G'Five with about 10 percent share, IDC said on Wednesday.
No, I haven't heard of G'Five either. The article goes on to say that there are 68 new vendors in the market accounting for 41% of total shipments. There were only five new vendors with a share of 1% in the first quarter of 2008.
It was not long ago that Nokia held over 70% of the Indian market. That market is now larger but the share for Nokia has dropped by half at least. The share was not lost to Samsung but to 63 new entrants. They managed to capture 40% of the market, roughly equal to what Nokia lost.
These new vendors will launch Android phones next year or the year after that. According to IDC, Android obtained 9.4% in the third quarter up from 2.9% y/y. The number of Android models went from 2 to 19 in the same time frame.
What does this mean for Your favorite mobile OS?
I'm sure many will use the Indian example as evidence of the inevitable ubiquity of Android. However, I would note that data networks are still very sparse in India and 3G has not reached a level of penetration that makes mobile broadband a common experience [citation needed].
The funny thing is that this lack of connectivity is not likely to be an obstacle to Android as it wasn't an obstacle to Symbian in the pre-3G era in Europe. More than half of Nokia's smartphones were selling without data plans in Europe well into 2009. Nearly all were selling without data in Africa, Middle East and India. Smartphones without data plans are just high end feature phones. They can be used for picture/video taking, listening to music/video, FM radio and, if they have a keyboard, for more productive text messaging. In emerging markets dual SIMs, FM radio and removable storage are killer features. Mobile browsing isn't.
A lack of broadband is however an obstacle to the iPhone. Here's why:
With the exception of those seeking "luxury" phones (a very small minority), the iPhone is too expensive in markets without subsidy. That's because the price Apple sets is very high (€630 or well over $800 at retail). This is not entirely because the product is inherently more expensive. Much of that extra cost is margin for Apple. What makes it popular is that much of that extra cost is paid by the operator who accounts for it as a subsidy. Don't pity the operator though. That subsidy is there for a reason: because the product entices users to data-oriented consumption at a higher monthly service fee.
The entire business model for the iPhone is to wrap a high-ARPU mobile broadband service plan with shiny metal and glass.
Put another way, an iPhone without a broadband connection is just a voice phone with an integrated iPod touch. You're better off getting a cheap phone and an iPod, or maybe an Android or Nokia phone.
When the iPhone 3G launched in India in 2008 with a price near $1000 it flopped. Many were quick to note that Apple did not understand the market. However few pointed out that the "3G" in the product's name was not just a marketing ploy. It was its Raison d'être.
To study the impact of iPhone in emerging markets you need to first plot out the penetration of mobile broadband.
Since launch, December has been the month with the most apps added. In December 2008 3,800 apps were added, in 2009 25,517 and in 2010 it looks like we might get nearly 30k new apps.
That amounts to nearly 1000 new apps per day.
It also seems that 500k apps will have arrived by mid-2011. As the production of apps continues to grow one wonders if this new medium will turn out to become more popular than recorded music in terms of creative output.