Asymco

Asymmetric Intelligence

Industry

  1. Invaluable

    Research · 323 comments

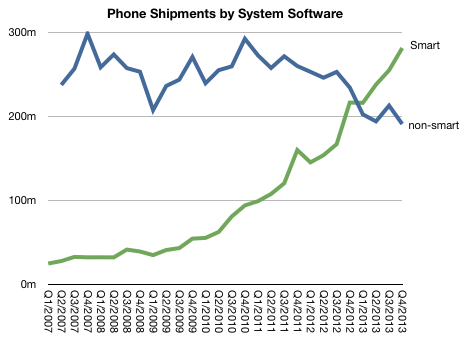
    The smartphone market continues to grow. 2013 saw total shipment of around one billion units (up from 683 million in 2012). In contrast, non-smartphone shipments continue to decline, with shipments around 800 million (down from 987 million in 2012).

    This pattern is shown below:
    Screen Shot 2014-03-18 at 3-18-12.45.12 PM

    Note that prior to 2012 the non-smart market seemed to be holding steady in spite of the growth in smartphones. The notion that smartphones would become universal was widely dismissed. I certainly heard many objections to my 2010 hypothesis that not only would smartphones become ubiquitous but that it would become increasingly difficult to find anything else to buy. (This in spite of the clearly evident demand for "low-end" non-smart devices.) ((The analogy I used was that of the black-and-white TV market as color TV became increasingly popular. There probably was a market for monochrome screens for a long time after they were discontinued but that is beside the point: the old technology becomes increasingly scarce because of economies of scale))

    I also suggested that the notion of distinguishing phones with the"smart" tag would become irrelevant and that we would just call these devices "phones". That is coming to pass, at least among the conversations I'm privy to.

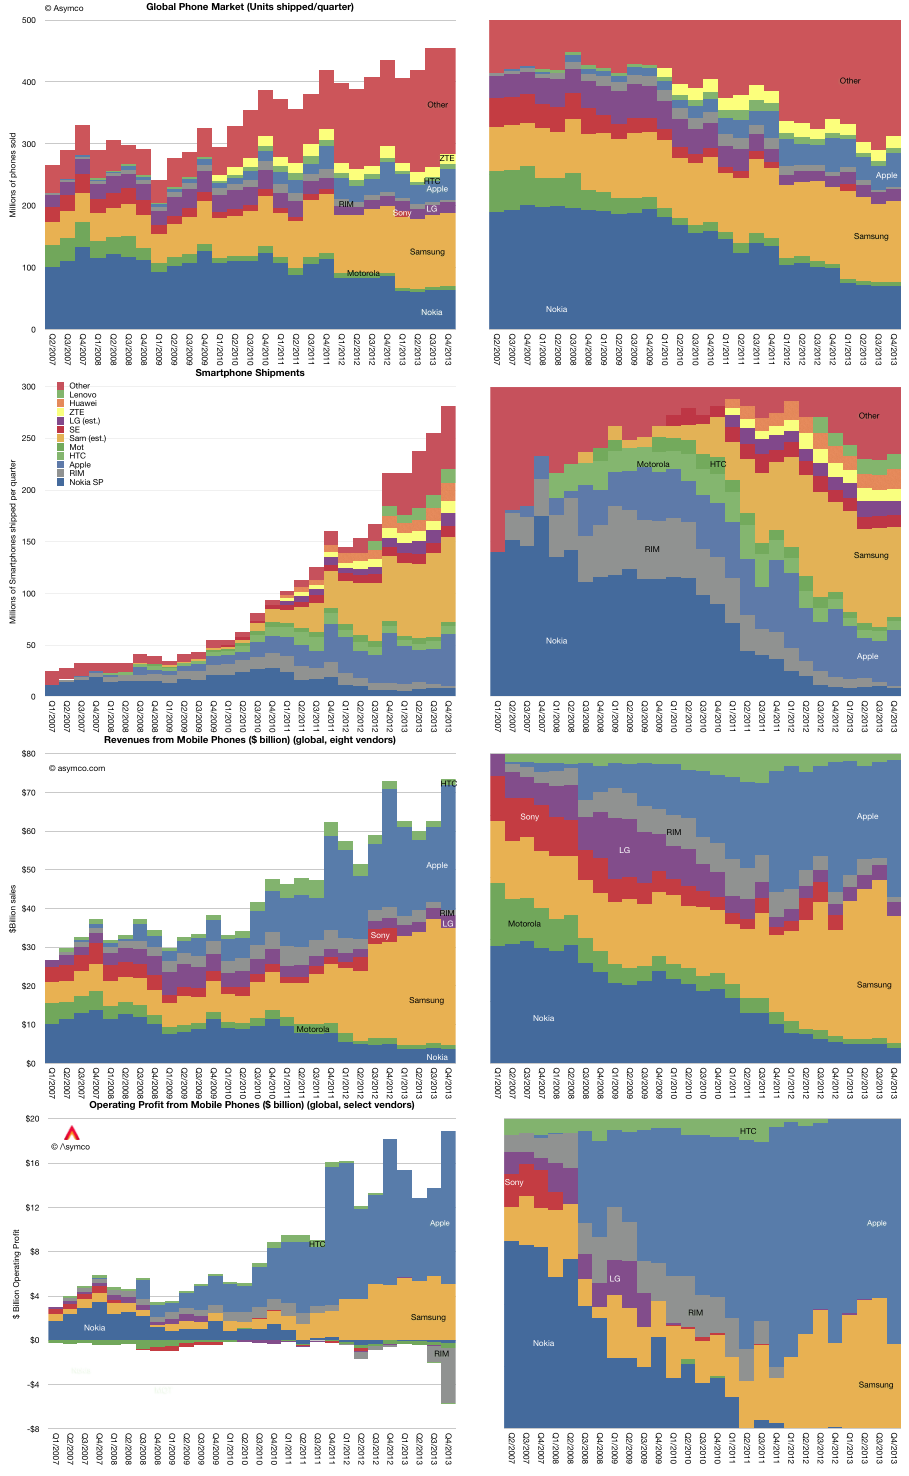
    So if the conversation is about "phones" and the expectation that all phones will be smart, what can we observe about the market? The following graphs provide the picture of shipments, revenues and operating margin in absolute and relative measure for the most significant brands.
    Screen Shot 2014-03-18 at 3-18-12.42.08 PM

    This arrangement shows the disruptive effect of adding "smart" to phones. In only a few short years ((Six shown but the effect was pronounced already in four)) profits have dramatically shifted in the industry.

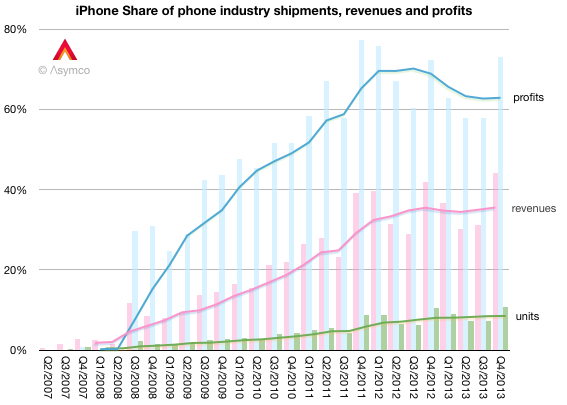
    Indeed, since the launch of the iPhone ((Which I consider to be the start of the current epoch of the industry)) the net profits earned by the collection of protagonists shown was $215 billion (($234 billion of positive operating earnings, offset by $19 billion of operating losses)).  60% has been earned by Apple, a newcomer to the market. That figure is also consistent on an ongoing basis, having reached 60% as early as 2011 and remained in a band around that figure since.
    Screen Shot 2014-03-18 at 3-18-1.23.52 PM

    The fact that this happened without corresponding dominance in units shipped shows evidence of something startling: Consistent value creation.

    To earn profit is hard, to do so in an outsized way is very hard and to do so with consistency shows a defensibility of market access that is rarest of all. The only cases where this typical is in a monopoly or protected market situation (aka cronyism.) Apple's lack of market monopoly coupled with a (near-) monopoly in profits can only be explained by disproportionate value creation.

    The mystery then is how is it possible to build a monopoly in value creation.
  2. On Google's Future. Part 1

    Research · 85 comments

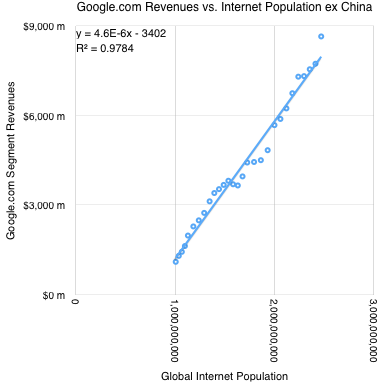
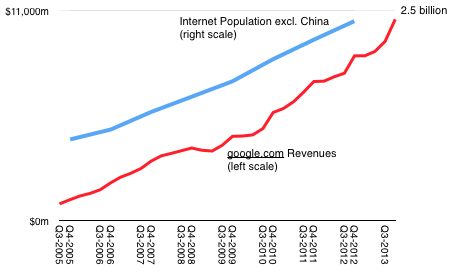
    From 2005 through 2012 Google site revenues ((Google revenues are reported as "Google.com", "Network", "Motorola" and "Other". For this analysis I am including only the Google.com revenues)) have risen at a rate consistent  with the growth in global Internet population excluding China ((Internet population is calculated as a combination of penetration as reported by the ITU and population data from the World Bank)). The Internet population and Google.com revenues for the period 2005-2012 are shown in the following graph.

    Screen Shot 2014-03-13 at 3-13-3.17.02 PM

    The correlation is shown in the following graph:

    Screen Shot 2014-03-13 at 3-13-3.17.21 PM

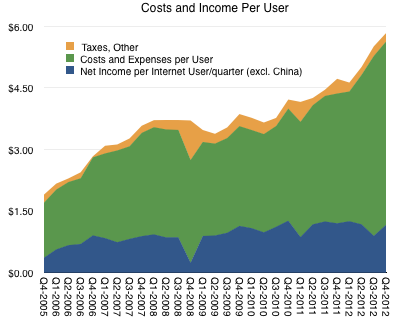
    Taking into account costs and expenses, on a per-user basis profitability per user (assuming all non-Chinese internet users are Google users) is shown below:

    Screen Shot 2014-03-13 at 3-13-3.17.14 PM

    The simple conclusion is that Google earns approximately $1.2 per user per quarter (net income is the blue area above). This figure is relatively constant with a slight increase (~20%) over 3 years.

    If the company does not alter its business model then the future potential of the business could be measured as a function of Internet (ex. China) population growth.

    How hard can that be?

    The next post will answer this question.

  3. Horace Dediu drops in to chat on MWC 2014

    Research · 2 comments

    It’s a good thing Horace Dediu got ready to start our Mobile World Congress #MWC14 tweetchat #IBMMWCChat on 2/24 a few minutes early – because as usual, the dialogue took off fast and went full steam ahead for an hour. Here is our basic topic list (ordering is mine, chat was slightly different)

    • Android Commoditization
    • Nokia,
    • Microsoft and Google
    • The OS, The Platform and the Ecosystem
    • Tizen
    • Wearables
    • Monetize This
    • The Operator Challenge
    • Nest again
    • The odds and endings

    Read Tweet transcript here: Horace Dediu @Asymco drops in to chat on #MWC14 | Electronics industry.

  4. Nokia welcomes Android developers

    Research · 100 comments

    Barcelona, Spain - Today at Mobile World Congress, Nokia unveiled five new affordable handsets including a new family of smartphones debuting on the Nokia X software platform. Based on the Android Open Source Project AOSP, and backed by Nokias deep ties with operators, the Nokia X platform gives AndroidTM developers the chance to tap into, and profit from, a rapidly expanding part of the market.

    via Nokia welcomes Android developers; expands global developer footprint with momentum across Lumia and Asha » Nokia – Press.

    It's worth remembering the distinction between operating systems, platforms and ecosystems.

    Today's announcement is consistent with the declaration of Nokia is engaged in a "war of ecosystems." Note that this is in contrast to "a war of platforms" or a "battle of operating systems" or a "competition of devices."

    Devices are commoditizing, operating systems are commodities and the Android platform is a commodity. Value will not be captured in any of these technology modules. Ecosystems are another matter. It's where Facebook (and its acquisitions) reside. It's where Google lives and it's where iTunes has been for a decade.

    Nokia's adoption of AOSP as an operating system is consistent with the ecosystem strategy set forth three years ago, and is also consistent with Microsoft's competitive strategy.

    Which is why I believe Microsoft is not only comfortable with this development but had agreed to it over a year ago when work on this initiative was already well under way.

  5. The price is right

    Research · 162 comments

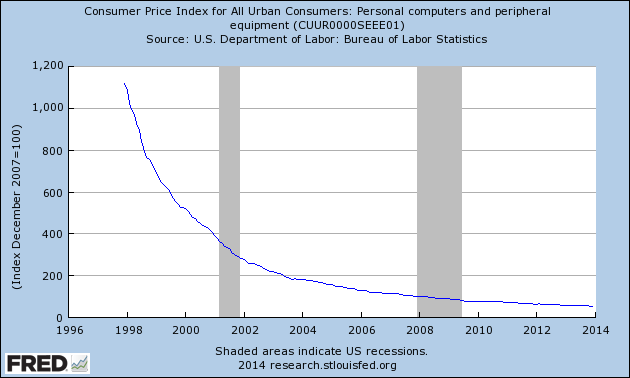
    One of the axioms of hardware business is that prices fall over time. The consumer price index for personal computers and peripheral equipment from 1998 to 2014 is shown below:

    CUUR0000SEEE01_Max_630_378

    The price index suggests that prices for computers should be 54% of 2007 levels. Charles Arthur illustrated this on a global basis using a separate set of data.

    The data shows that the weighted average selling price (ASP) of a PC has fallen from $614.60 in the first quarter of 2010 to just $544.30 in the third quarter of 2013, the most recent date for which data is available.

    The result is a chronically low margin for computer manufacturers. As Charles points out, the average profit for a PC is less than the price of a coffee at Starbucks. LG and Sony's exits from the market are symptomatic of the crisis. This is not a new phenomenon. There has been a long series of mergers, acquisitions and exits by incumbents.

    Except of course for one incumbent.

    The Mac, aged 30, seems to soldier on. Phil Schiller noted that of its original competitors, Apple is the only PC maker to still be in the market. One could imagine that this existence is marginal, or that the Mac managed to survive by giving up on unit volumes or pricing.

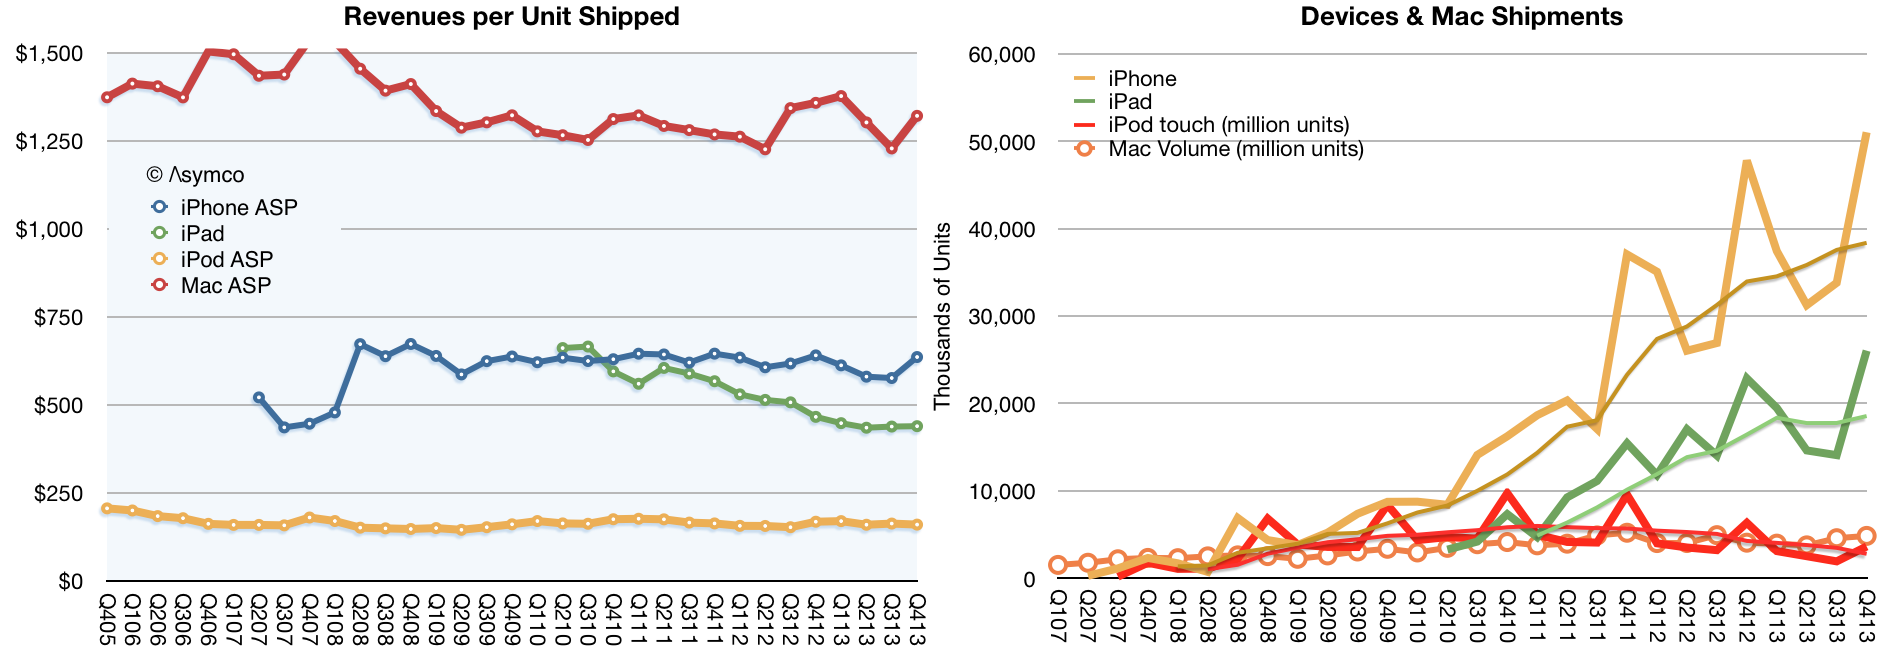
    The following graph shows the revenue per unit for the Mac and its volumes.

    Screen Shot 2014-02-20 at 2.59.43 PM

    The Mac not only continues to preserve pricing but it also seems to grow volumes at a time of overall market decline. Going back to the consumer price index, the Mac in December 2007 was priced, on average, at $1539. In December 2014, the price was $1322, with $40 deferred.

    So rather than being 54% of December 2007 prices, the Mac is almost at 90%.

    You'll note that along with the Mac I also illustrate the pricing of Apple's other devices. Even with the iPod, the pricing has remained stubbornly consistent for over 7 years. Whether the volumes are falling, rising rapidly or remaining flat, Apple's product pricing remains predictably consistent.

    The point being that the violation of the axiomatic price erosion rule in PCs is not anomalous. It suggests something about the violation of the same rule in devices. It suggests that perhaps the company does not respond to the same market forces.

    But we already know that. Jony Ive told us as much:

    “We’re keenly aware that when we develop and make something and bring it to market that it really does speak to a set of values. And what preoccupies us is that sense of care, and what our products will not speak to is a schedule, what our products will not speak to is trying to respond to some corporate or competitive agenda. We’re very genuinely designing the best products that we can for people.”

    The result is plain to see: Caring about the product means that it can be priced at a point which consumers care to pay.

    Trouble is, judging by how Apple is valued, nobody believes that this is sustainable. Regardless of the evidence within Apple's own history, it's the exception, not the rule and the bet continues to be that they cannot continue to remain an exception.

    Is Apple going to continue to repeal the laws that govern its industry, as it has for decades, or will it, as the market expects, abide by them?

  6. When Apple reached parity with Windows

    Research · 418 comments

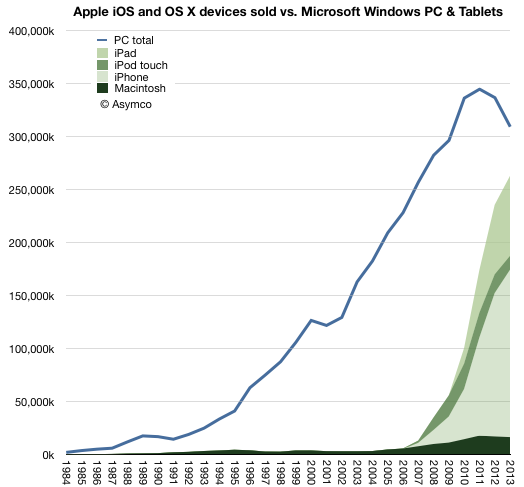
    In 2013 there were 18.8 times more Windows PCs sold than Macs. This is a reduction in the Windows advantage from about 19.8x in 2012. This decline is mostly due to the more rapid decline in Windows PC shipments relative to the more modest decline in Mac unit shipments. Gartner estimates that about 309 million Windows PCs were shipped, ((This figure is not published publicly but can be derived from subtracting Mac shipments from the total PC shipments which are published)) down from 337 million in 2012 (which was down from 344 million in 2011, the year PCs peaked.) I estimate about 16.4 million Macs were shipped in 2013 down from 17 million in 2012.

    The history of PC shipments relative to Mac shipments is shown in the following graph:

    Screen Shot 2014-01-13 at 1-13-3.09.21 PM

    I chose to graph the Mac data as an area with additional areas for iOS devices layered on top.

    When comparing these platforms, the contribution of the Apple mobile platform becomes striking.

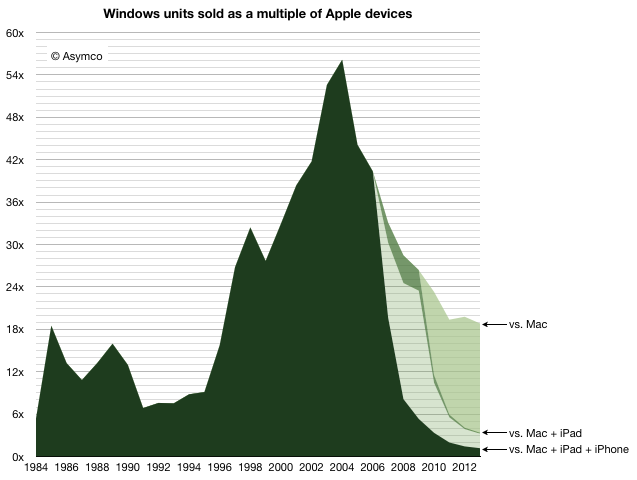
    Nevertheless, it's still important to understand the role of the Mac. In years gone, the advantage of Windows was measured in multiples of Mac sales. That peak occurred in 2004 when there were 56 times more PCs sold than Macs. At that moment, when the Windows advantage peaked, the Mac sold 3.2 million units  into a market where 182 million PCs shipped. This means the Mac had 1.7% market share.

    Screen Shot 2014-01-13 at 1-13-3.09.51 PM

    And yet, remarkably, even with 1.7% share, the Mac did not disappear. The figure of 3.2 million units was not great and below the peak to date ((which was 4.5 million in 1996)) but it was enough to sustain Apple while it developed its next products. At the time the iPod was starting to grow rapidly and development on iPhone/iPad was already underway. The point being that there were new products. 3.2 million was a sufficient volume to preserve the company until such time when they would be ready.

    Today the situation is quite different. The total number of platform products Apple sold in 2013 was about 260 million ((This includes my estimates for Q4. We'll have the exact figure in a few days.)) The total number of users Apple has is above 550 million. ((Possibly 600 million.))

    Note the effect in the graph above. Even if we only consider the Mac, the Windows advantage has decreased considerably, and the platform was certainly not extinguished. The new form factor Mac Pro and the continuing improvements in the thinnest of laptops shows how Mac has not just survived but prospered as the underdog which easily captures the bulk of profits.

    But the bigger story is how Apple's mobile platform has nearly reached the sales volume of Windows. In 2013 there were only 1.18 more Windows PCs than Apple devices sold. Odds are that in 2014 they will be at parity. ((The prediction I made in 2012 was that "it’s safe to expect a “parity” of iOS+OS X vs. Windows within one or two years". The data so far does not change this expectation.))

    But will it last?

    It's important to understand just how the quantities involved here have a quality of their own. The quantities themselves speak of a change. It's not convincing to suggest that what comes around goes around and a reversal of fortune can be reversed yet again when there are several zeros added to the end of the figures involved.

    We have to understand that the Windows advantage itself came from the way computing was purchased in the period of its ascent. In the 1980s and 1990s computing platform decisions were made first by companies then by developers and later by individuals who took their cues from what standards were already established. As these decisions created network effects, the cycle repeated and the majority platform strengthened.

    But it was the large companies who made the core decisions. In the 1980s if the Fortune 500 companies all standardized on Windows then their suppliers and customers would also standardize on it. Add governments and other institutions and 80% of the market is probably decided. There was concentration in decision making. In other words, in the 80s a platform could win by convincing 500 individuals who had the authority (as CIOs) to impose through fiat a standard on the centers of gravity of purchasing power.

    Today, with mobile products there are billions of decision makers. 500 decisions mean nothing. In fact, Apple with at least 500 million loyal and wealthy users is considered to be in a precarious situation. That's partly due to the way other platforms like BlackBerry and Symbian found themselves in crisis with tens of millions of users. ((and hundreds, perhaps thousands, of corporate buyers deciding to support its platform exclusively. What IT does matters for little.))

    The decision making process for buying computers, which began with large companies IT departments making decisions with multi-year horizons, has changed to billions of individuals making decisions with no horizons. Companies have become the laggards and individuals the early adopters of technology.

    The fundamental shift is therefore in the quantity of decision makers and the quality of those decisions. Those who buy are also those who use and their decisions will be perhaps whimsical, maybe impulsive and not calculated, but fundamentally, in the aggregate, wise.

    Ultimately, it was the removal of the intermediary between buyer and beneficiary which dissolved Microsoft's power over the purchase decision. It's not just unlikely that this situation will be reversed, it's impossible. Computing decision making has moved to the furthest edge where use has been for decades. The computer has become personal not just in the sense of how it's used but in the sense of how it's owned.

  7. When will smartphones saturate?

    Research · 43 comments

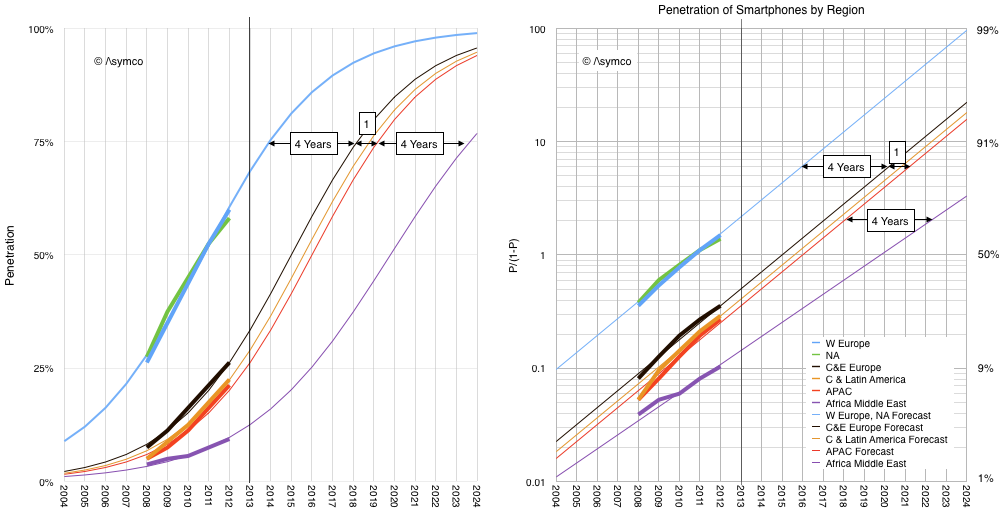
    GSMA Intelligence reports provide valuable statistics on the growth of mobile networks. One in particular shows the history of regional smartphone penetration.

    I took the historic data and plotted it as follows:

    Screen Shot 2014-01-07 at 1-7-1.43.56 PM

    Note that I chose to model using the same logistic function that I have used to describe the US market (as measured by comScore) and the global Internet user market (as measured by the ITU) and the stove, landline phone, Electricity, automobile, consumer radios, washing machines, refrigerators, TVs, dryers, air conditioning, dishwashers, microwaves, VCRs, PCs, cellphones.

    It's also the same model used to show the rise and fall of energy sources, canals, railroads, roads and air travel.

    If we believe that smartphones in parts other than US and Europe will behave the same way as all the other technologies listed above then the forecast penetration is likely to follow the thin lines in the graphs above. ((This is a big if, and, judging by their forecast, one which the GSMA Intelligence team seems not to believe will happen.))

    With the exception of Africa and Middle East, note that the primary difference between regions is not the rate of growth in penetration but rather the delay in adoption. I marked this delay as 4 years between US/EU and Central & Eastern Europe. An additional one year delay to Asia Pacific region and 4 years more to Africa/Middle East adoption.

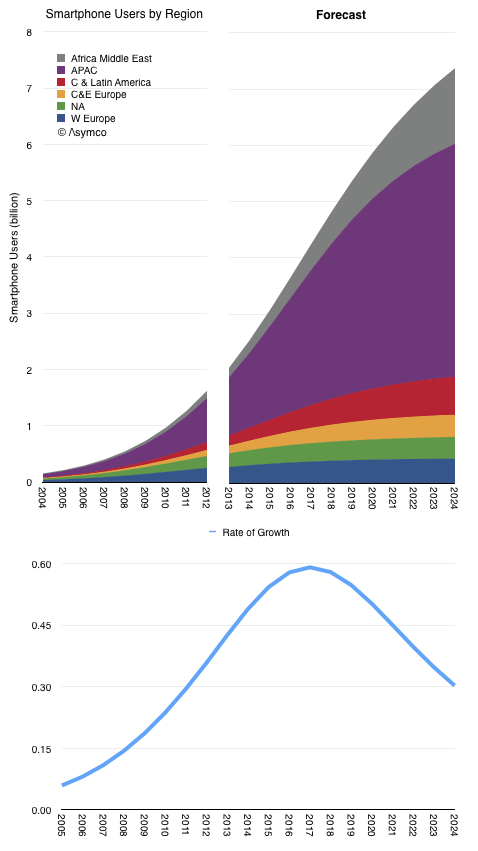
    The resulting smartphone user forecast is shown below.

    Screen Shot 2014-01-07 at 1-7-1.36.39 PM

    Although 2013 was often cited as the year when smartphones saturated ("everybody that wants one has one"), the total population of users will likely take another decade to reach maximum. The point of inflection in global growth could be expected in 2017.

    What most observers sensed was the point of inflection in growth in North America and Western Europe. Those regions are 11% of the world's population.

  8. On the future of the Internet and everything

    Research · 56 comments

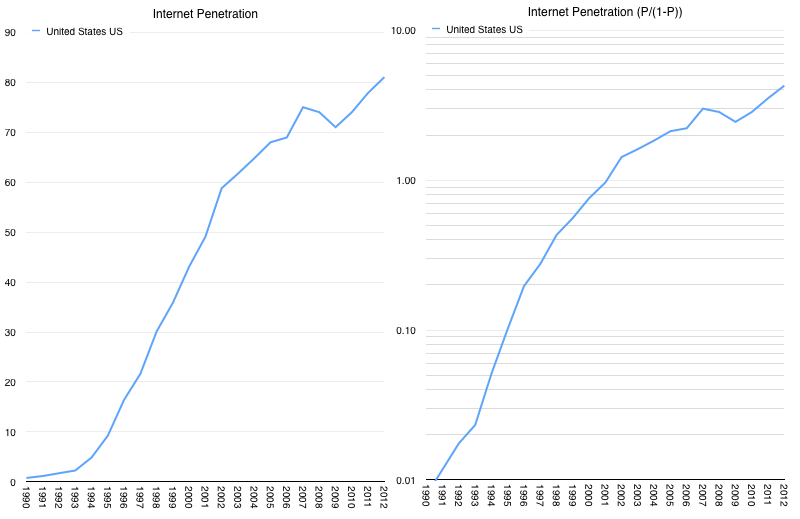
    According to ITU data, Internet usage reached about 2.2% penetration in the US (2.2 users per 100 residents) in 1993. The figure in 2012 was 81%. The history of penetration is shown in the following graphs.

    Screen Shot 2014-01-03 at 1-3-12.17.41 PM

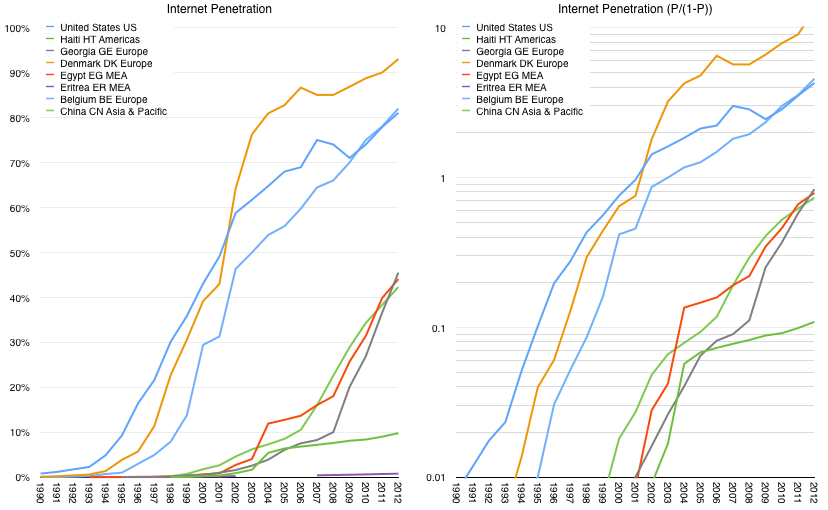
    Similar graphs can be drawn for other countries (data is available for 193 countries/territories.) I chose the following set of countries arbitrarily:

    Screen Shot 2014-01-03 at 1-3-12.26.25 PM

    When looking at all countries, the patterns are fairly self-evident. They nearly all behave the same way with respect to the impulse to move online. The pattern is approximately logistic (observed as linearity in the right-side graphs). ((Those that don't are anomalies which should be inspected individually and might provide insights into the constraints for systemic state health.)) The main difference is one of timing.

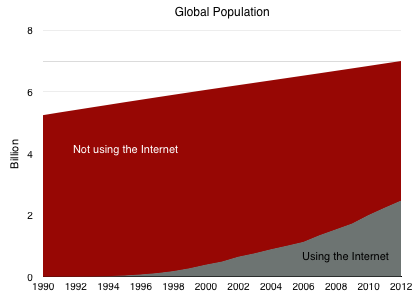
    The global picture should therefore not be surprising. In absolute terms, the penetration was 35% at the end of 2012 or 2.5 billion individuals. The graph of global population divided into Internet consumers and Internet non-consumers is shown below followed by penetration.

    Screen Shot 2014-01-02 at 1-2-3.44.11 PM
    Screen Shot 2014-01-03 at 1-3-12.55.17 PM

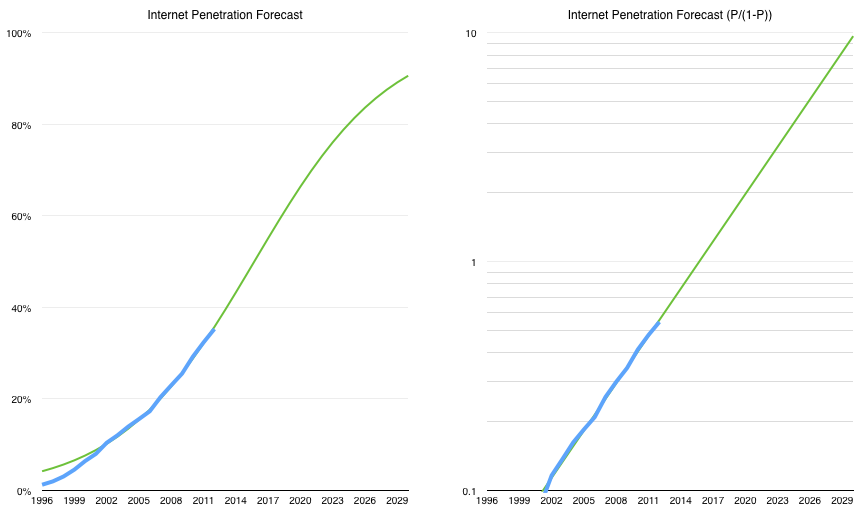
    The linearity in the blue line above is consistent after 9% penetration is reached (P/(1-P) ~= 0.1) suggesting logistic growth (far more smoothly than individual country data). Note that I also took the step of projecting the logistic curve that describes the internet's growth forward a few years.

    Based on this history, it becomes possible to project that 2013 penetration reached around 39% or 2.78 billion individual users.

    It also suggests that "saturation" could come between 2030 and 2035. ((The curve is defined as having a half-period of 19.7 years from 1996))

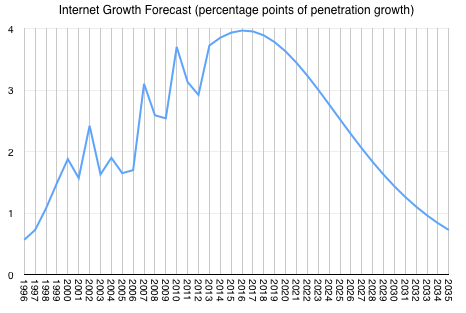
    If we look at growth, ((Derivative of logistic curve)) the inflection point comes in 2016. Thereafter internet user growth will slow.

    Screen Shot 2014-01-03 at 1-3-8.33.34 PM

    Overall, the growth pulse of the Internet will be approximately 40 years long. ((More likely 35 years as saturation dynamics will be erratic.)) We are therefore nearly half-way through.

    It might seem an interesting but benign fact, however I must caution that as we've seen with smartphones, once the point of inflection is reached, investors tend to flee the sector. That in itself may not be a bad thing but investment flight has deep effects on "ecosystem" participants.

    Venture investments tend to feed entrants disproportionately and they are remarkably sensitive to the valuations of public companies (and IPOs). These investment might therefore be in danger in two years. Plan accordingly.

  9. The China Mobile iPhone MOQ

    Research · 38 comments

    "BEIJING and CUPERTINO, California—December 22, 2013—Apple® and China Mobile today announced they have entered into a multi-year agreement to bring iPhone® to the world's largest mobile network. As part of the agreement, iPhone 5s and iPhone 5c will be available from China Mobile's expansive network of retail stores as well as Apple retail stores across mainland China beginning on Friday, January 17, 2014.

    China Mobile & Apple Bring iPhone to China Mobile’s 4G & 3G Networks on January 17, 2014 - Yahoo Finance

    January 17 seems to be an auspicious date. ((January 17 is a lucky day in Chinese numerology: 1+7=8 is a multiple of number 8, which is the most auspicious number.  Joe Zou @zzbar via Twitter))

    Precisely a year prior to that date, on January 17, 2013, I wrote The iPhone MOQ.

    Within that post I showed the activation rates for US operators as a percent of total users. Figures ranged from 10% to 19% by year or operators. I further assumed the figures would be toward the high end of that in Japan based on statements by the president of NTT DoCoMo.

    The last phrase I used was:

    "The MOQ figure as percent of subs for China Mobile would also be an interesting point of debate."

    My assumption would be that CM would start at a base significantly lower than the US or Japan. I would not be surprised to see an MOQ of 4% of user base for 2014. In the press release above China Mobile states that they serve 760 million customers. That implies a minimum order of about 30 million iPhones.

    In the absence of any other data it's best to be conservative.

  10. How many Americans will be using an iPhone when the US smartphone market saturates?

    Research · 200 comments

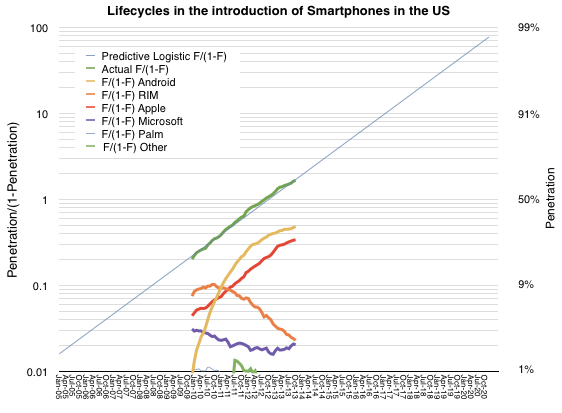
    As previously noted, the US smartphone market has followed an almost perfectly logistic growth. The measured data (via comScore, in green below) follows a predictive logistic function (thin blue whose formula is discussed here).

    Screen Shot 2013-12-13 at 12-13-11.30.54 AM

    The other notable market observation is how closely the iPhone follows the same pattern as the market. The red line representing the iPhone above is almost perfectly parallel to the green and blue lines which represent the overall market. The reason for this seems to be that consumers are absorbing the product in similar way to how they are absorbing the technology. ((Note that this pattern of adoption has happened even though the product has been at least partially unavailable to the entire market until quite recently.)) The "learning model" which underpins logistic models could offer clues as to the cause. It suggests that there is a direct communication that happens between the product and the consumer.

    Incidentally, the reason other platforms do not follow this pattern is that they are not communicating value with the consumer but with manufacturers or distributors of the product. These alternative communications could create faster or slower growth than the overall market as they are not subject to the same large population imitation/learning models.

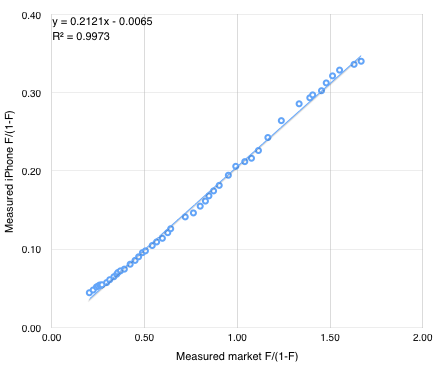
    If we believe that the iPhone can be modeled behaviorally then it may be possible to forecast its growth. One can simply draw a line extending the existing red segment above and read the F/(1-F) figure at any point in time. Solving for F results in a measure of penetration and hence number of users (if population is known.)

    An alternative is to use the following formula derived from the linear interpolation of the two measured market shares. iPhone market share is y/(1+y) where y=0.21x and x = F/(1-F) and F is the expected market penetration of smartphones.

    Screen Shot 2013-12-13 at 12-13-11.29.59 AM

    So if F = 91%, x = 10, y = 2.11 and therefore the iPhone market share =  68%.

    We also know from the plot of the market that F = .91 is reached around February 2017. So we can suggest that at 90% penetration (approximately saturation) the iPhone will have 68% market share of users in the US. Forecasting the addressable market (US population aged older than 13) at about 266 million that implies 180 million US users of the iPhone by early 2017.