Asymco

Asymmetric Intelligence

Market

  1. An interview about Microsoft's Surface

    Research · 15 comments

    This interview was conducted with Bruno Ferrari Editor of Exame magazine in Brazil.

    First, do you have forecasts for tablet market share including Microsoft for next years? (Apple, Android, Amazon etc)?

    I have some guesses but I don't think it's something that is defensible. Too many things can change. Fundamentally I believe Microsoft sees the tablet as a PC and intends to migrate a substantial portion of would-be PC customers to tablet forms. If they are successful then they preserve the existing PC user base and allow it to grow a bit.

    In contrast Apple sees the iPad as a new type of device that is used for things not directly related to PC style computing. In that sense the iPad competes with PC non-consumption. It means people may own both a PC and an iPad and some will own only an iPad. The iPad will expand the market while taking share from the PC. Windows tablets will try to hold the Windows share steady.

     How do you analyze Microsoft’s strategy with Microsoft Surface? Don’t you think they’re admitting themselves that Apple was right since the beginning?

    We don't know the strategy yet. Without pricing and an idea of how the other OEMs will respond, I have more questions than answers. The fact that they are doing their own PC hardware does indicate that they see the industry architecture changing and that a large number of vendors offering hardware "choice" is not really the basis of competition in PCs. In other words, buyers are not willing to pay a premium for Windows because the hardware it's available on is offered in a wide range of options.

    Do you think MS growth at tablet market will surpass the lost at PC (desktop and notebook) market in the next years?

    This is a crucial question. It's possible that Windows 8 on tablets will create new markets, like the iPad has done and it could take the leading role in expanding computing in a post-PC era. However, to do this, Windows 8 and its successors need to be optimized to solve the new jobs people may have for mobile devices. They have to do this even though they need to sustain the old use cases and business models. To succeed Microsoft needs to "fork" the business model and create new ways of profiting from hardware and software. The rumors that Windows 8 RT devices will be sold at a loss is perhaps a hint that this is the plan.

    Did you see the rumor of a 199 dollars Surface? If it’s true, do you think is a good strategy?

    It all depends on what will be the alternate source of revenue. I assume there will be some sort of subscription service, taking a page from the telecom industry. Perhaps a mixture of Windows Live services (media, documents in the cloud and software updates). We have to see whether subscription computing makes sense for consumers.

    How do you see the problem that MS is creating with its OEM by turning itself on a tablet maker?

    There is a problem, of course. However here again the question is whether they are moving to an "ecosystem subscription" model and whether they want to offer revenue share to OEMs. If they offer something then Microsoft plays the role of the operator and device makers are paid some up-front subsidy in exchange for keeping their systems locked into the network.

     One more questions: did you already estimate the shipments of Samsung Galaxy Tab since its launch?

    Sorry, I don't have the Galaxy Tab estimate. However, here is what I found:

    A week after its release, Samsung announced that they had sold 600,000 units. On the 4 December, it was reported that the 1 million mark was reached, two months after launch. However, an executive at Lenovo claimed that Samsung had only sold 20,000 out of the 1 million Galaxy Tabs that were shipped. In January 2011 Samsung announced they had shipped 2 million units to stores. In August 2012, actual sales figures were released in the patent infringement court case against Apple showing that a total of 725,000 Galaxy Tabs were sold through Q2 of 2012.

    Source: Wikipedia.

    Note that the figure of 725k is US only.
  2. How many Kindle Fires were sold?

    Research · 70 comments

    Last September I argued against the potential of the Kindle Fire acting as a low end disruption in the tablet market.

    Now that the first version of the product has reached is end of life, it's time to review the discussion.

    The first problem is finding out how well the product did. Amazon just released a statement that the Fire accounted for 22% of tablet sales in the US in the nine months it was available. The challenge becomes knowing how many total tablets were sold in the US during this time frame.

    Fortunately we know the vast bulk of that total based on the Samsung v. Apple trial. Both Apple and Samsung submitted as evidence sales of the iPad and the Tab product lines in the US. The iPad added up to 16.14 million units (Q4'11 through Q2'12) and the Tab was 540k units. That makes the iPad and the Tab add up to about 16.7 million units. Assuming an additional 1 million units for the other (non-Kindle) total yields an estimate of 22.7 million tablet devices sold in the nine months ending June.

    Applying the 22% claim to that total gives a Kindle sales total of 4.987 million. That's awfully close to a round number of 5 million.

    Since Amazon admitted that they ended production prior to launching a replacement (and presumably did so quite early in order to drain inventory,) then we can safely assume that the original production order was 5 million units.

    Five million Kindle Fire units becomes the first reliable estimate of Kindle sales (based on Apple, Samsung and Amazon supplied information rather than guesses from analysts.)

    So the question now is whether this is consistent with the hypothesis that the Fire is disrupting the tablet business.

    Bearing in mind that this 5 million total was reached with prominent placement on Amazon.com and a loss-leading pricing, I would conclude that this is not an auspicious start for a disruptive product.

    As I argued nearly a year ago, the business model for the Kindle is limited to the footprint of the Amazon franchise, which is small internationally. Amazon itself implicitly admitted that the product was a US-only phenomenon. Further worry comes from the way the company approached production. It was not planning it as a maximization of reach into the market. What they did was order a batch production and then wait for it to be sold through.

    Perhaps Amazon is being patient for growth, but I don't see a hunger for profit in this strategy. We know that Kindle probably lost money at the price charged. Perhaps it's on the order of $40 per unit. Five million units would imply a charge against the business of $200 million. Did Amazon earn a profit on content sales of $40 on each of those five million units? The margins on content sold through Amazon are so low that I have a hard time imagining that Fire users are that ravenous in their consumption.

  3. International Tablet of Mystery

    Research · 31 comments

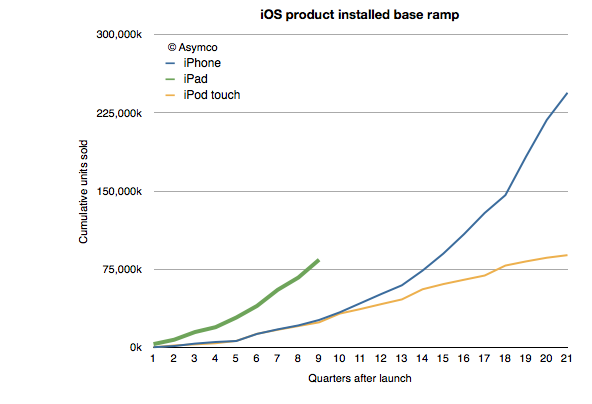
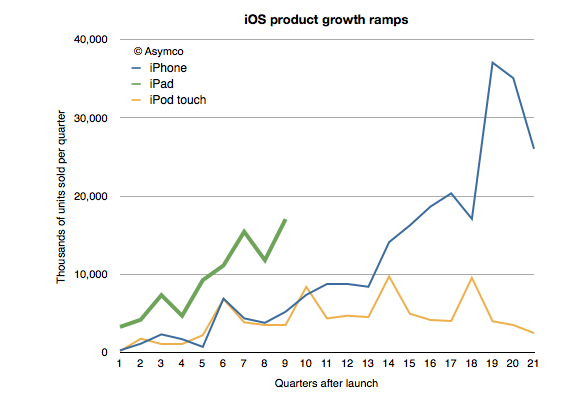
    One of the remarkable patterns associated with the iPad has been its growth rate. Looking at the ramp of the product relative to the iPhone and iPod touch reflects this sense of raised expectations:


    At the same point in time, and adjusting for seasonality the iPad is outselling the iPhone by a factor of 3 and the iPod touch by a factor of about 5. This is also reflected in the installed base of devices, where the 84 million iPads sold through its first nine quarters is more than three times the iPhone base at a similar point in time.

    Of course, the world of 2012 is different than the one from 2009 when 25 million iPhone sold. iPhones are available in far more points of sale and to many more buyers world-wide. But the interesting contrast is between the iPad and the iPod touch.

    I've always maintained that the dynamic difference between the iPad and the iPhone is that it's unrestrained (and unsupported) by the operator channel and all that it implies. The iPad is a pure computing product whose means of communication is unregulated. That means transparency in pricing and transparency in distribution.

    But so is the iPod touch.

    The iPod touch is a "nano iPad" (or as detractors put it, the converse of that.) So shouldn't the iPod touch behave as the iPad?

    We don't know exactly how the iPod touch behaves. We don't have specific figures on its sales. What you see in the charts above are my estimates for the iPod touch based on company statements that "about/above 50%" of iPods are touch versions. That and the cumulative sales totals that are occasionally reported.

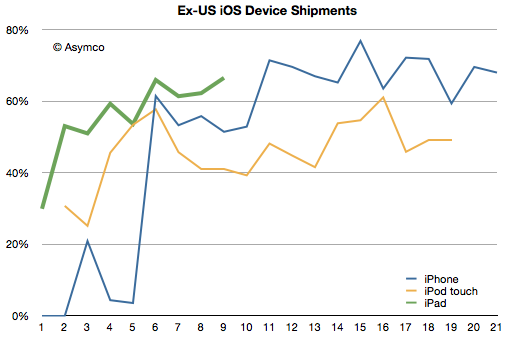
    However, we have received an unexpected morsel of data from the Samsung v. Apple trial that may help characterize the two products: US sales data. Having the US data and knowing/estimating the global data gives us an estimate of the international (ex-US) sales for all three products.

    I indexed the three products to measuring quarters since launch. The pattern here is that the iPad diverges from the iPod touch in its international appeal. Since the iPad expanded internationally even faster than the iPhone, the issue is not only one of rapidity in appeal but also a qualitative difference.  The iPod touch seems to have stabilized at 50% non-US sales while the iPhone is between 60% and 80% outside the US.

    The iPad reached 60% non-US sales in its first year. Its last quarter was 70% outside the US.

    So what's going on?

    The characteristic value of the iPad is in its appeal to "computing non-consumers". Computing has come to mean media consumption, education, communication and entertainment. These jobs to be done are casually done with much more ease on an iPad. The iPod touch can do these jobs as well, but not as comfortably. The iPod touch is "absorbable" by younger consumers and typically they have their hiring done by their parents. Those parents are less likely to indulge where incomes are lower.

    But the universal appeal of the iPad is evident in its global visibility. Like the tasks it performs, the iPad itself is becoming less of a mystery.

  4. American exceptionalism

    Research · 45 comments

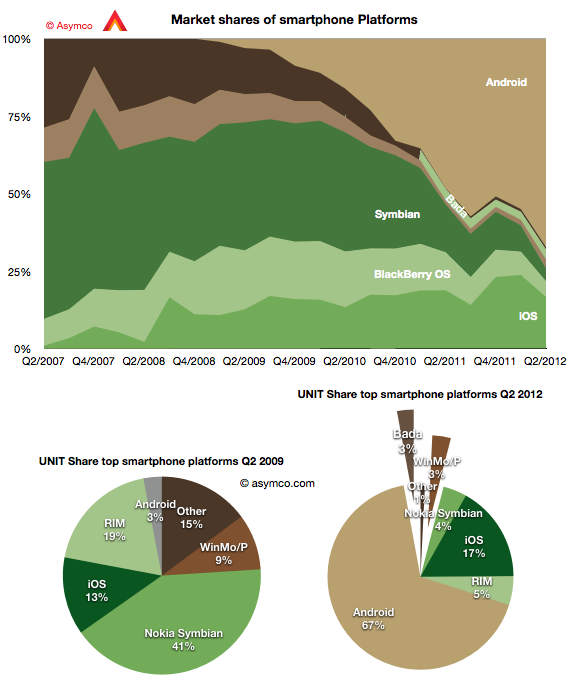
    The second quarter showed continuing growth for Android with 19 points of share growth from a year ago. Only Windows Phone showed a gain y/y in share up 1.6 points to about 3%. In the same time, Bada lost half a point, iOS lost 2.1 points, RIM lost 7.2, Symbian 11.4.

    The result is shown in the graph below:

    I also show a "before-and-after" pair of pie charts which show the difference in smartphone platform market share from the same quarter three years ago. Android went from 3% share to 67% while Symbian went from 41% to 4% and RIM went from 19% to 5%. iOS increased its share from 13% to 17%.

    If this trend continues Android could reach 50% of all phones sold in a few years. That's a run rate of 200 million per quarter. And it's likely that 100 million of those will be shipped by Chinese vendors.

    However, looking at the global picture can also miss some important trends in local markets. Had one looked at the global smartphone business in 2005, the conclusion would have been that Symbian would be the dominant platform in perpetuity.

    What affected the global market was a change in the US: the launch of iOS and thereafter of Android. The US, a smartphone backwater until then, became the most vibrant market and today it's the most penetrated and has the highest ratio of smart to non-smart of any of the major regions.

    The curious thing about this vast market is that it's still not truly open. There are technology and political reasons why some platforms are permitted to sell in one region or not. The iPhone is not available on either the largest Chinese operator or on the largest Japanese one. It's largely absent from India because of distribution (i.e. subsidy) and much of South America. Even in the US, the iPhone is still, after five years, not available on one of the top four operators and has only reached another less than a year ago.

    What intrigues me is what would the market look like if distribution were not an issue. What if there was equal choice to all buyers. We can't test this question directly but we can ask. But there is some pattern we can look at in the US data. Thanks to recent revelations at the Samsung vs. Apple trial we can see the effect of increasing distribution in the US.

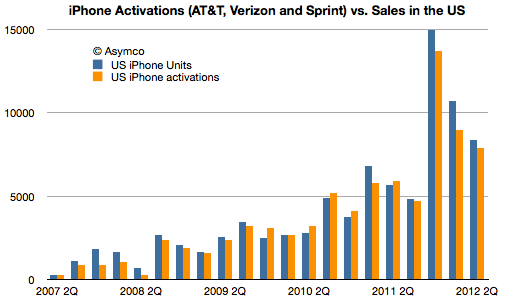
    The data on smartphone market share by carrier can be blended with data from carriers about iPhone activations (which are a proxy for sales, see note below) to give a more precise figure of market share in markets where iPhone participates.

    For example, when the iPhone was only available on AT&T, one could measure iPhone market share vs. the global smartphone market, or the US smartphone market or within AT&T alone. Some assumed that the AT&T share would be reduced once the product would become available on Verizon or other US carriers. However there was no appreciable drop. Share in Q4 2010 was 63% at AT&T and it was 63% a year later after the iPhone was available for four quarters at Verizon.

    So the share of iPhone within those operators which carry it tells a story independent of distribution.

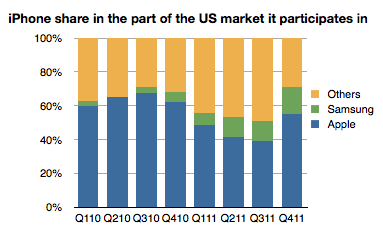
    The following graph shows the share of the iPhone vs. Samsung in the market defined by its availability. (I.e. the volumes of smartphones sold by AT&T throughout the time period, Verizon Q1 2011 to end and Sprint in Q4 '11).

    The share of iPhone thus defined shows a slight decline but it's an overall number that is remarkably resilient as distribution increases and is remarkably high overall. Note that globally, the iPhone gets only about 17% share of smartphones--a value that has not varied greatly since mid 2009.

    So at least in the US, on carriers where it's available, the iPhone is holding on to a significant share. In a global market it's expanding distribution but not yet covering the world. As a consequence it's keeping up with overall market growth and staying between 17% and 20% share.

    The big question is what will happen if and when its availability matches that of Android in terms of points of sale. Or even that of BlackBerry or Symbian. Is America a different market from the rest of the world? It was different in being isolated while Symbian roamed globally. It was different in being a launch platform for BlackBerry and then iOS and then Android. But now that iPhone is beginning to be widely available there, will it be exceptional in how it rewards Apple?

    ---

    Note:

    1. Activations data can be seen next to Apple's testimony of US sales in the following graph. Note that more phones were sold by Apple than were activated in total of the life of the product. 86 million sold and 80 million activated. This implies that an analysis based on activations undercounts the iPhone. 
  5. Measuring iOS as a gaming platform

    Research · 35 comments

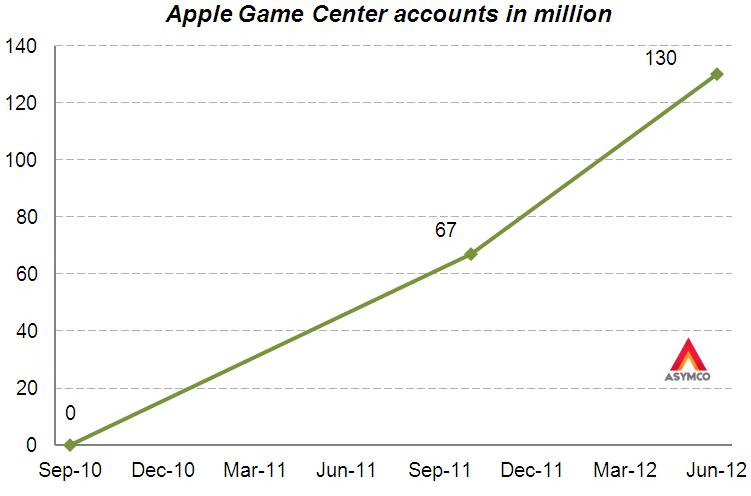
    At this year's WWDC Apple offered an update on Game Center accounts. The data we have so far is shown in the following graph.

    Before being acquired, another network, OpenFeint, announced 180 million iOS accounts in October 2011. Another figure to consider is the 40 million subscribers to Xbox Live (out of 66 million Xbox users). This subscriber base is paying for a service (about $1 billion per year) so it's not the same as the free Game Center model.

    Rather than being a revenue source, Game Center is designed to engage users and to capture usage information. It also lets us gauge gaming "consumption" on iOS devices. That itself allows us to contemplate it as a gaming platform vis-à-vis alternate platforms.

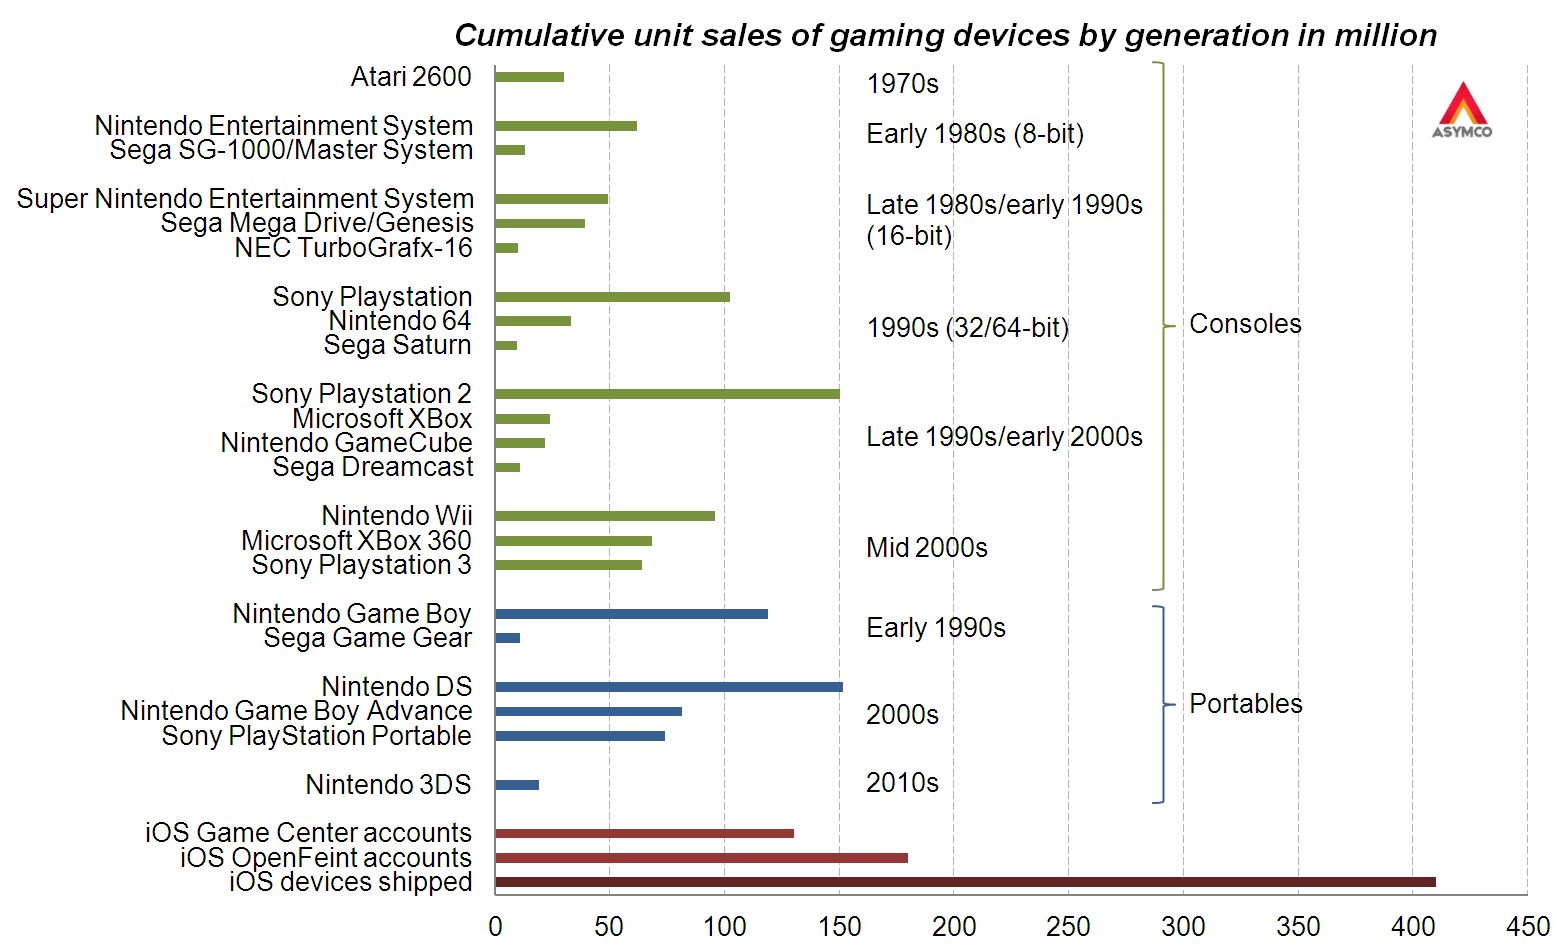
    To consider the figure as a proxy of penetration and engagement, the graphic below shows cumulative sales of gaming devices.[1]

    Here are some observations:

    • There is a pattern of turnover of market participants
    • Each console "generation" had a clear market leader
    • The best-selling gaming device was the Nintendo DS closely followed by the PlayStation 2 [2]
    • Considering the 130 million Game Center accounts, iOS is already the third largest gaming platform
    • Furthermore, considering the OpenFeint iOS figure of 180 million accounts announced in 2011, iOS has already surpassed the cumulative sales figures for the Nintendo DS
    • No gaming device has ever reached the 200 million mark
    • At the current growth rate the number of Game Center accounts will surpass 200 million before the year end

    Apple cites the number of games, downloads and payments to developers as evidence of ecosystem health and growth. The figure of Game Center accounts is yet another indicator. It shows growth in and of itself, but it also has the side effect of offering comparative measurement of performance. That measurement compares favorably with other game platforms.

    The economics are different but they always are when a disruption takes root.

    ---

    Notes:

    1. Based on reported cumulative sales (Wikipedia), excluding gaming devices with less than 10 million cumulative sales (excludes for example PlayStation Vita), excludes also “home computers” due to missing reported figures
    2. This Wikipedia article contradicts the previous.
  6. How many iPhone ``5''s will be sold?

    Research · 77 comments

    Phil Schiller stated (under oath) that when assessing sales for a new model of the iPhone, Apple used an easy shorthand:

    Each new generation sold approximately equal to all previous generations combined.

    That's a helpful gauge. Did it hold and will it continue to hold?

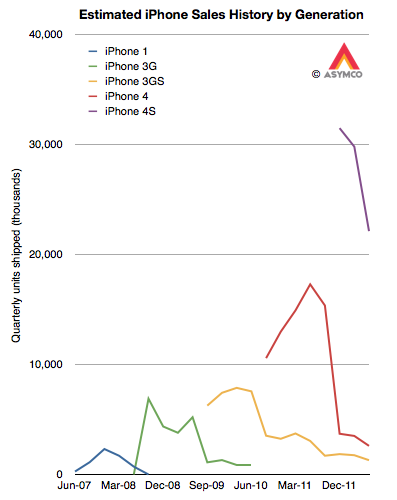
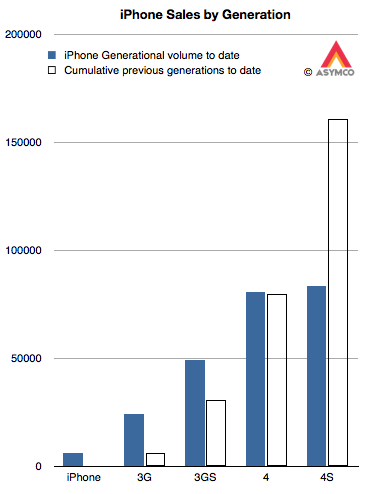
    In order to test this rule of thumb we need to know generational sales. Although we know overall unit sales for a given quarter, since Apple has been selling several versions simultaneously, we need to make some guesses about the ratio of generations in the mix. My guess is about 10% for 3G vs. 90% 3GS and 5% 3GS vs. 10% 4 vs. 85% 4S. That results in the following pattern:

    The cumulative totals for these generations can then be generated and they appear as follows:

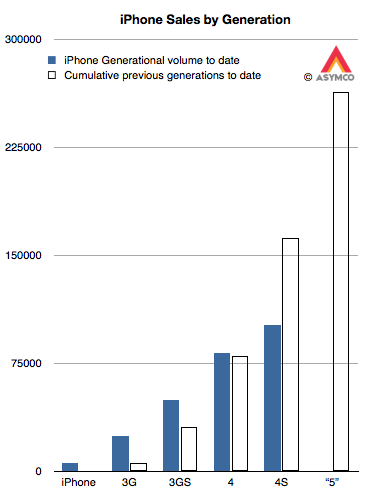
    The solid bars are the shipments for each generation (to date) and the outlined bars are the cumulative shipments of all prior generations. The assumptions show that:

    • The 3G easily outsold the original iPhone. In fact, it sold nearly four times as many.
    • The 3GS also handily beat the 3G+original total by a factor of 1.6
    • The 4 also beat the 3GS+3G+original. As the 4 may continue to sell into the future, the beat will only grow larger.
    • The 4S is only half way through beating  the 4+3GS+3G+original. Assuming the current quarter's sales roughly equal the last quarter's, the total for 4S will reach two thirds of the sum of the previous generations (i.e. 100 million) by the end of September. Bearing in mind that the 4S is likely to remain in production at least one more year means it has a potential to come close to the target of 162 million.

    This leaves us with the question of how many iPhone "5"s will sell. As it stands today, the cumulative total would have to be greater than 263 million units (including assumptions for the current quarter.) That target is shown below:

    Is that a reasonable target?

    Unfortunately, this is a moving target. As the 4S (and maybe 4) remain in production, the target continues to increase with time. However, we can still take a stab at this.

    Recall the analysis of production based on budgeted CapEx spending. It resulted in a best guess of about 165 million iOS units sold in the following two quarters. I further forecast iPhones in isolation to be about 102 million over the same period. Taking that forecast forward and assuming a 60% growth rate,  I currently have about 200 million iPhones over the next twelve months. If 85% of those are the next generation, that yields about 170 million iPhone "5"s through mid 2013.

    This is well short of a target of 265 million. But that's only over the next four quarters. If the iPhone "5" remains in production for at least as long as the 3GS then it might cross 200 million. There is also the question of whether the "mix" will begin to favor the older generations more. If that's the case, we might see version "5" meet its target.

    Underlying all this is the question of a change in strategy toward more penetration (vs. current skimming.)  That might allow for sustaining the 100% historic growth rate. If so then Apple will easily sell 250 million iPhone "5"s.

  7. Estimating third and fourth quarter iOS shipments

    Research · 42 comments

    In the 2011 Annual Report(10K) published October 26th Apple states:

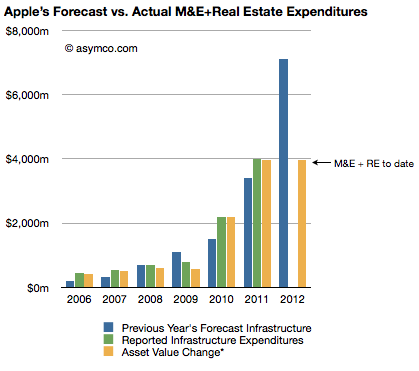
    The Company anticipates utilizing approximately $8.0 billion for capital expenditures during 2012, including approximately $900 million for retail store facilities and approximately $7.1 billion for product tooling and manufacturing process equipment, and corporate facilities and infrastructure, including information systems hardware, software and enhancements.

    The history of these expenditures is shown below (the blue bars are statements from 10K reports including the one above shown as the right-most bar):

    Three 10Q reports so far this fiscal year have given us updates on asset values and the change in these values are shown as the right-most yellow bar. The asset value change suggests $3.9 billion has been spent so far of the $7.1 billion budgeted. Thus we can estimate that about $3.2 billion remains to be spent in the fourth fiscal quarter (thus bringing the yellow bar to parity with the blue bar in the chart above--a parity that was achieved or exceeded for five out of the last six years).

    Assuming $200 million of the fourth fiscal quarter budget will be for land and buildings[1] results in an estimated $3 billion remaining for product tooling and manufacturing process equipment and data centers.

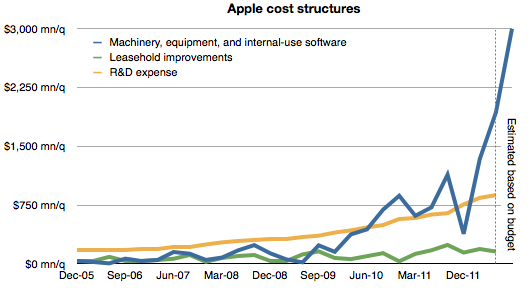
    The history of spending for various cost centers is shown below.[2]

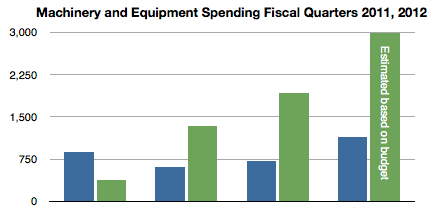
    Note again the forecast for the fourth quarter based on budget given last October. Also shown below is the spending on machinery and equipment by quarter for the fiscal years 2011 and 2012 including the estimate for FQ4 2012. (Blue bars represent 2011 quarters and green represent 2012.)

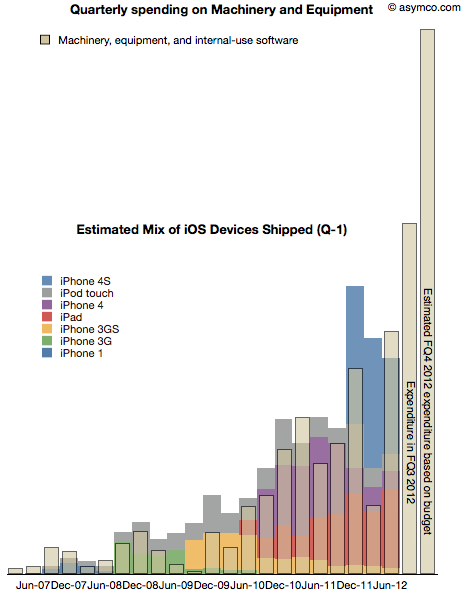
    As discussed previously, spending on machinery and equipment has shown a strong correlation with the output of iOS devices in the following quarters. The following chart shows the superposition of M&E spending in a given quarter and iOS output in the following quarter.

    Note that due to the time-shifting the Expenditure for FQ3 does not have a corresponding output--expected in FQ4--and that FQ4 expenditure is estimated based on budget.

    With this data in place, we can now begin to answer the question of what are the total iOS device shipments expected in the current (ending September)  and the following (ending December) quarters.

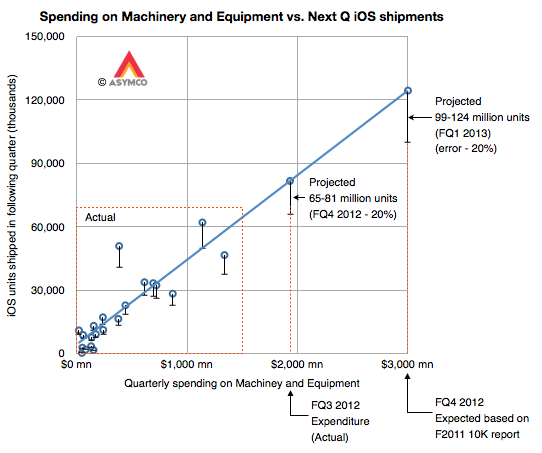
    Our eyes are pretty good at seeing patterns in data so perhaps it would suffice to know the scale to the graph above and thus fill in the colored output bars to match the spending. But to make it a bit more precise, I drew the following chart:

    It shows the same data but as an X-Y scatter plot where the X axis is quarterly spending and the Y axis is iOS unit shipments. Note that the actual data points are in the lower left area delineated with a dashed red rectangle.

    I drew the blue line corresponding to an assumed linear relationship between the two variables to project the iOS output based on additional expenditures for FQ3 and FQ4.

    I used error bars of -20% to show a possible conservative range.[3]

    This yields an iOS output of approximately between 65 and 80 million units in the current quarter and 100 to 125 million in the fourth calendar quarter. The sum of the low ends of this estimate is 165 million units.

    My current forecast is  53 million units in CQ3 and 110 million units in CQ4 which, together, add up 163 million. Close enough.

    Stay tuned for a padcast report with more details on this approach.

    ---

    Notes:

    1. The company spent $31 million, $66 million and $159 million for the first three quarters on Land and buildings. $200 million in the fourth quarter seems reasonable unless there is a pending large land deal closing in the next two months.
    2. I added leasehold improvements as a proxy for store openings and R&D expense as a proxy for overall product development. These are in contrast to expenditures for product production and support which are represented by Machinery and Capital Equipment.
    3. Note the other data points' error bars
  8. How many Lumia phones were sold in the US?

    Research · 156 comments

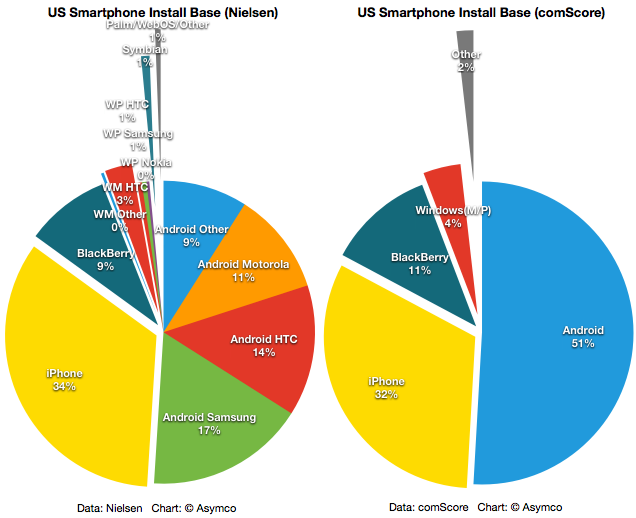
    Nielsen and comScore survey US consumers through different methodologies, however they both try to paint a picture of the smartphone patterns of ownership and consumption.

    I regularly report on comScore's data as it's published on a monthly basis. Nielsen offers updates on a quarterly basis but there is more detail.

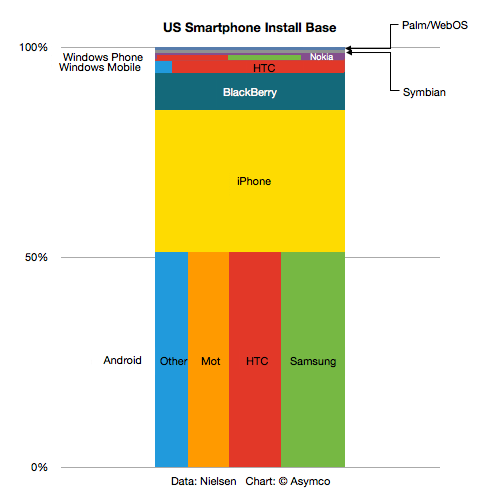
    The latest report (for Q2) shows smartphone shares by both platform and vendor. The following graph is a treemap built with the Nielsen data:


    The same data is also plotted below as a pie chart:

    I also added the latest comScore mobiLens data in the pie chart to the right.

    Note that both surveys agree in the main on the largest platforms. The difference seems to be within a reasonable margin of error. The details available in the Nielsen data are perhaps also interesting. The various Android OEM shares as well as the division between Windows Mobile base and Windows Phone (7) base could provide some insight. Nielsen's total Windows base adds up to 4.5% while comScore reckons on 4%. Within that total, Nielsen breaks out 3.2% for Windows Mobile and 1.3% for Windows Phone. Within the Windows Phone total, HTC and Samsung are shown as having 0.5% and Nokia 0.3%.

    If we then use comScore's figure for total smartphone users (110 million) then the data would suggest that there are 330k Lumias in use in the US. This would have been accummulated over a sales period of about four months.

  9. Why the iPhone matters: 8 questions for Horace Dediu

    Research · 6 comments

    John Cox of Network World:

    We asked him eight questions about the five-year impact of Apple's iPhone, and he replied from his iPad.

    Q: Five years ago, people actually began to get their hands on the Apple iPhone. There were other smartphones; no prior phone products from Apple; there was no App Store, no apps "ecosystem." So what accounted for its initial success with consumers?

    Read my answer and the entire interview here:

    Why the iPhone matters: 8 questions for Horace Dediu

  10. At 50% penetration the US smartphone market is not showing signs of saturation

    Research · 59 comments

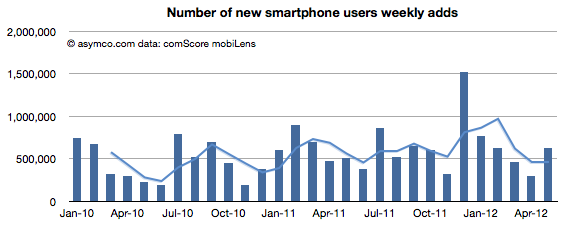
    According to comScore, as of end of May,  the ratio of consumer phone users in the US (aged more than 13) who use smartphones as their primary phone has reached 47%.

    The question is whether this is reaching saturation. My guess has been that saturation will be at levels well above 80%. The data shows that during May the rate of smartphone adoption (first time users) was 630k/week. This number is a good recovery to above the historic mean indicative that saturation is not yet in effect.

    50% penetration will happen this summer. A year ago the predicted "tipping point" date was also the same: August 2012.

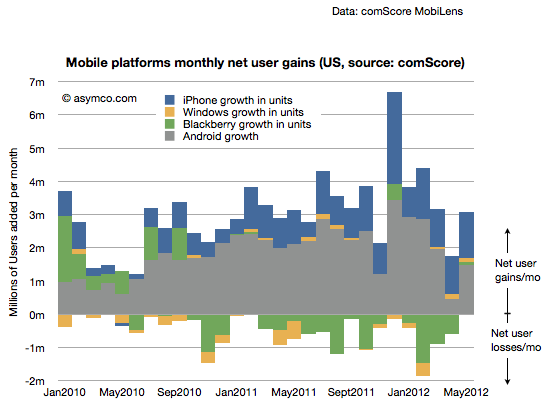
    The platform shares data is also returning to a historic consistency. A month ago I asked if there was "trouble with the robot"  because Android net adds dropped to a level unseen for two years and the decline in net adds had been going on for four months.

    This last report shows a recovery in Android net adds to about 1.5 million new users.

    [Note here too that there is no sign of saturation: The net user gains are far above net user losses. Even BlackBerry showed a gain. In a market where there is saturation, net gains and losses among platforms would balance each other out.]

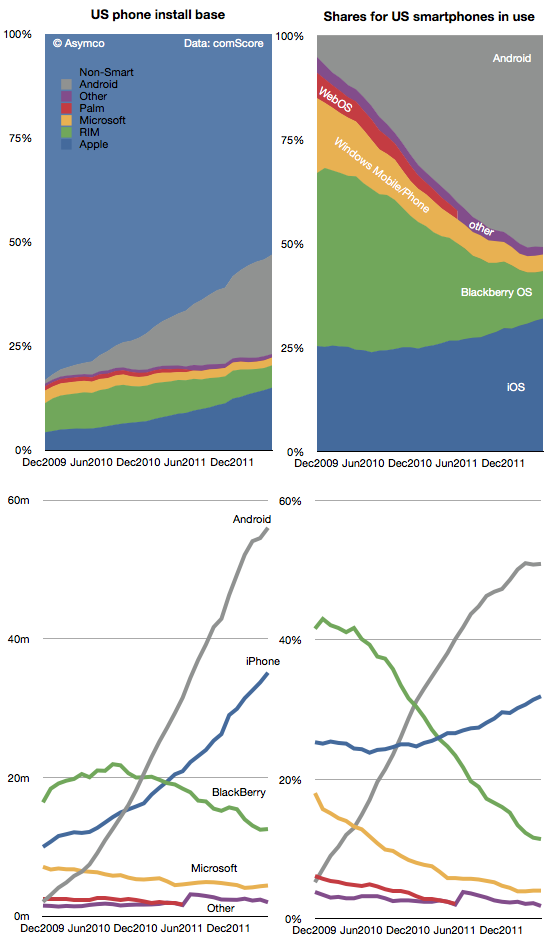
    In terms of share, Android shows two months of no growth. The following charts show the history of platforms in terms of share and actual units in area and line charts.

    I'd say the jury is still out on whether Android has "peaked" in the US. Globally, the rate of additions seems to still be increasing but in the US we might be seeing the effect of upgrades as many first time Android buyers are reaching the end of their contracts. iPhone and Android "purchase rates" are already at parity but the install base might take some time to converge.

    With half the population still not using smartphones, there is still headroom for the platforms, but the inter-platform dynamics are becoming very interesting.

  11. RIM's tailspin

    Research · 63 comments

    The number of BlackBerry phones sold fell 41% year-on-year in the last RIM fiscal quarter. Sequentially the fall was 30%. Though surprisingly poor, I note that Nokia's smartphone business fell even more dramatically last quarter (down 50% y/y and 39% sequentially). LG also saw a 44% decline in unit shipments in Q1.

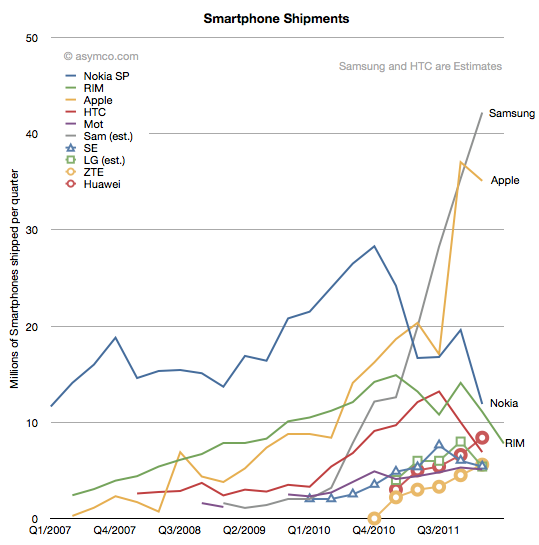
    The history of smartphone shipments for the largest vendors is shown in the following chart:

    From forecasts made by Huawei it's probable that they overtook RIM in the last quarter, dropping RIM to 5th or 6th ranked vendor in smartphone units.

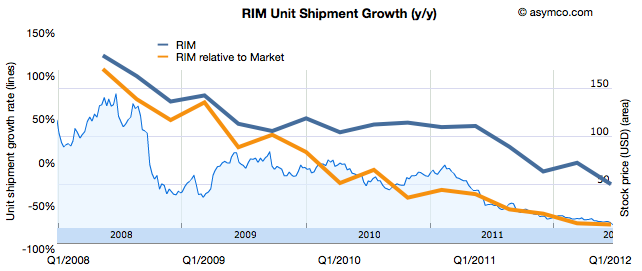
    RIM's 7.8 million units is the same level of sales as it had in early 2009. The total market was only about 250 million units per quarter then. It's around 400 million today. A quick calculation shows that RIM's smartphone market share has fallen from a peak of 22% to about 6%.

    RIM's stock performance reflects this performance relative to the market.

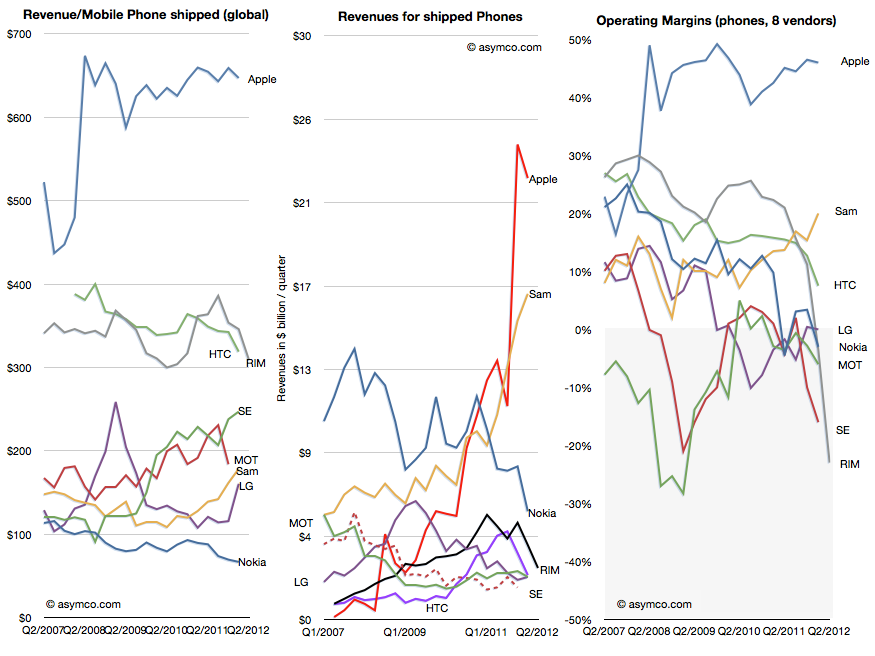
    Hardware revenues were $1.652 billion. Matt Richman calculates the average hardware revenues for the BlackBerry of $203. I include service revenues in my ASP calculations (for Nokia and Apple these are also significant values) yielding $309 per BlackBerry. The history of total revenues, revenues per phone and operating margins are shown below relative to competitors.

    Operating margin tells the most sobering story. As I've often repeated, historically no company has survived dipping into the grey zone.

    To reiterate, the logic of irrevocability in this industry is as follows:

    Success depends on three conditions being met by the vendor's products:

    • consumers trust the platform's promise
    • operator see the product as creating value to their core business
    • developers offer investment to innovate on top of the platform

    If all these factors are present, the vendor enjoys a virtuous cycle of growth. If any of these is lost, the others are also likely to be lost as well creating a vicious cycle of decline.

    Loss of operating margin is an early indicator that at least one condition is not met. Usually, a failure of consumer trust leads to a drop in purchases which leads operators and distributors and retailers to flee and then developers defect.

    It's been impossible to recover from this tailspin so far. There is a procedure which works in theory: accelerate downward by investing in a new platform. The move is counter-intuitive but essential in re-building trust, quality and relationships.

    However, the reason it does not work in practice is that this struggle is not with gravity alone. While spinning downward, the company is also subject to competitive attack. Competitors fill the void and take customers into locked-in ecosystems. There is neither the time nor the ability to defend.

    Cash runs out and customers are divided up between the survivors. Nokia and RIM face this scenario today.