Google reported a new activation rate milestone: 1 million/day.
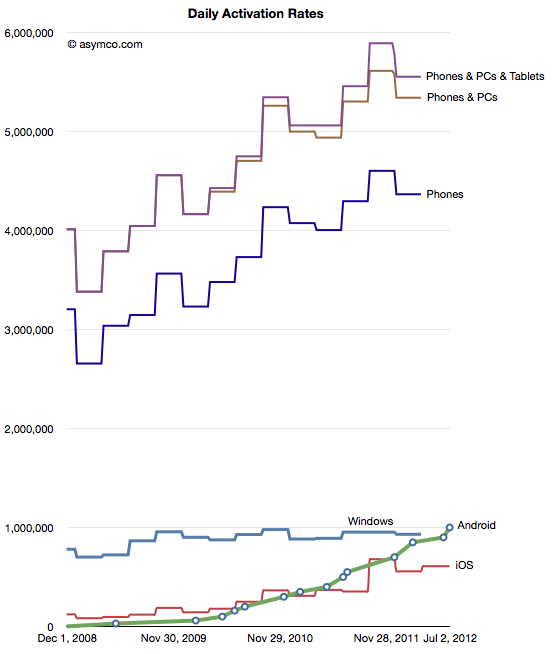
The rate of activations has been increasing steadily which leads to a question: how high can it go?
The answer is easy to determine. It can go no higher than the sales rate of phones and tablets and PCs. So what's that sales rate? The answer is to take sales (shipments actually) per category and cast the data as "activations".
The result is shown in the chart below:
Defined as "activations" device and computers are being adopted at the rate of about 5.6 million units per day.
As a percent of total activations, Android is running at about 15% and iOS is at 10%. Android has already overtaken Windows activations and with the new iPhone, it's likely iOS will do as well this year.
In terms of available headroom this means that iOS and Android are running at a combined share of 25% of available activations. They both should consider that three quarters of the opportunity is left to go.
Will iOS and Android reach a duopoly in terms of activations, topping 5 million per day? Probably not, at least not without some fragmentation or platform diversification (to put it nicely). Nevertheless, 3 to 4 million per day seems an easy target to set.
This week Mr. Dediu was a guest on The Web Ahead (another 5by5 show hosted by Jen Simmons) where he discussed how the forces of disruption apply to the web. It was an interesting discussion as usual, but if you’re pressed for time you should turn your attention to the bit after the sixty-five minute mark, when Horace volunteers some of his thoughts on the web vs. native application platforms.
HD: Apps are like the sauce in a dish. They add flavor and distinguish the dish. Increasingly they also offer nourishment. Some would argue that we can live with plain cooking but spices drove people to do incredible things like risking life to discover new continents. Being the world's best source for spices means the most innovative and brilliant minds will be attracted to innovate on top of Apple's platforms.
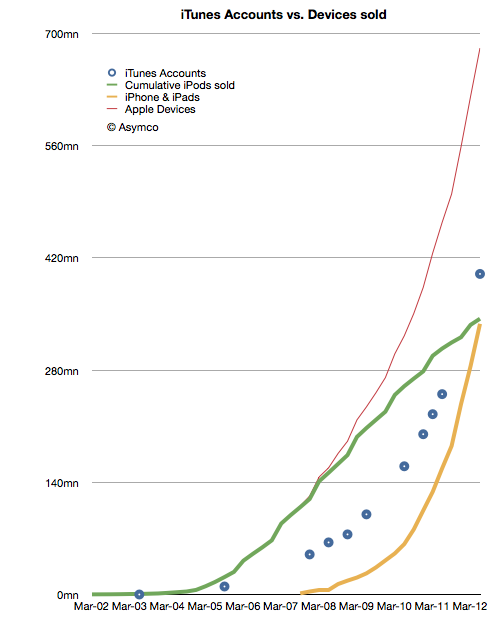
Apple announced that the total number of iTunes account (with credit cards attached) has reached 400 million. This was touted as being the largest collection of credit card accounts for any retailer and I have no reason to doubt it. However, looking beyond the bragging rights, there are more interesting patterns to observe about this asset.
What I plotted was the cumulative number of iPods sold (green), the cumulative number of iPhones and iPads (yellow), the combined devices total (red) and the reported number of iTunes accounts (blue).
The first observation is that the combined total iPhones + iPads have overtaken cumulative total iPods. The iPhone started in Mid '07, more than five years after the first iPod shipped. The acceleration in that product line is still evident while the iPod decelerates gracefully.
The second observation is that the total device count has reached 680 million in the last decade. It's a big number but it is still a number that is dwarfed by the overall device market. Apple is still around 10% of the devices market today. It should give an idea of how many devices could still be sold in the next decade.
The third observation is the ratio between the iTunes accounts and the total devices sold. Since iPods, iPhone and iPads have been dependent on iTunes, the number of iTunes accounts gives a rough indication of active users. Combining active users with total devices sold should give a rough estimate of the number of retired devices. In other words, if we assume that account holders typically use one device then by taking the difference between devices sold to date and accounts at that point in time we should know how many devices have been retired.
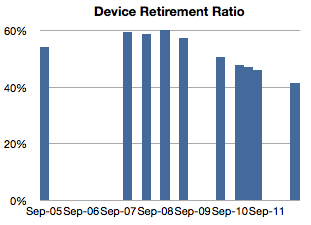
Dividing that number of retired devices by devices in use should give us the retirement rate and that is shown in the following chart:
Note that as the iPod was slowing and the iPhone was still a small part of the total, the retirement ratio was increasing. As the iPhone accelerated, the ratio began decreasing and is still decreasing.
Projecting the retirement rate should give us a way of more precisely estimating the addressable market for developers, accessories makers, and other ecosystem participants. Currently that means that about 60% of all Apple's devices sold are still in use. We can tune that figure upward in the next few quarters and make better estimates as Apple releases their shipment data.
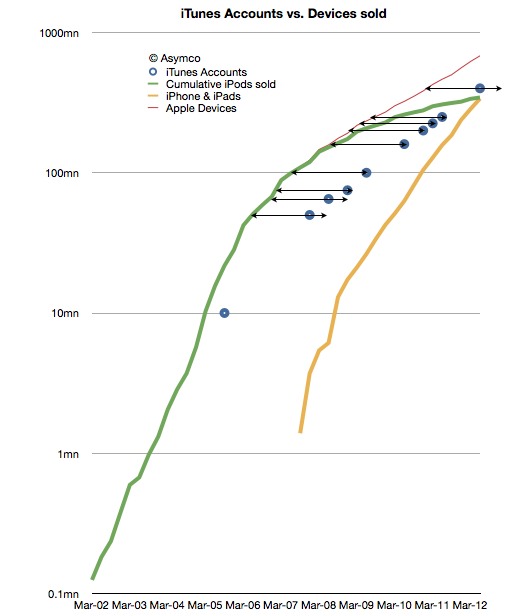
The iTunes account data is not just a way to calibrate addressable markets but also a valuable method for measuring device longevity. The distance between the red line and the blue happens to be nearly a constant 8 quarters as shown in the following chart (note change to log scale for the vertical axis).
Apple has been releasing data about payments to developers with increasing frequency. Last week's $5 billion announcement was the fifth such update and came after about one quarter since the last.
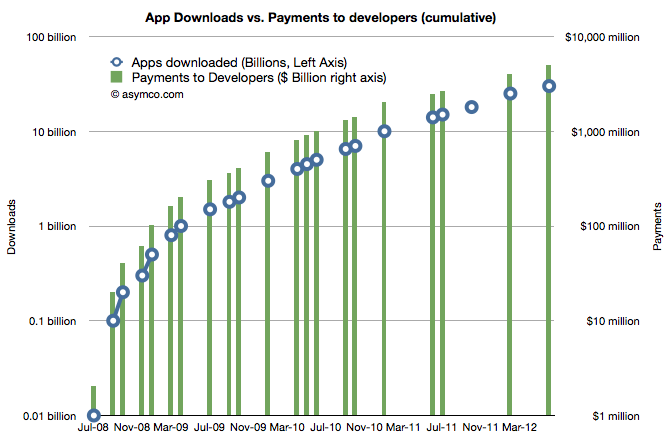
Knowing the payments to developers and the cumulative download count allows us to get a very accurate revenue point for each download. As the frequency increases we can observe growth and seasonality patterns.
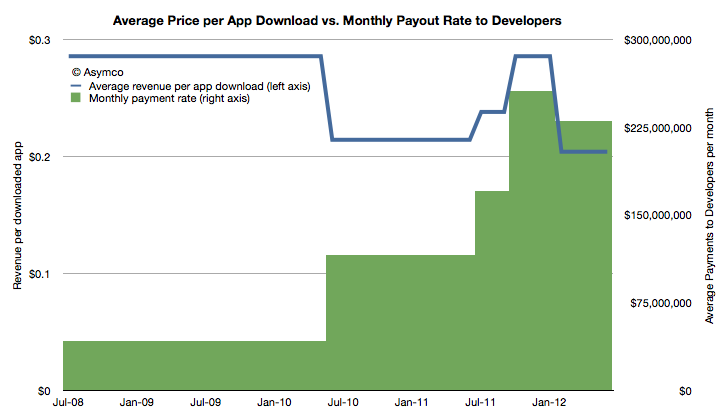
The following chart shows how average revenue per app download and the average payment rate to developers has changed since the iTunes app store opened and given the data points available:
The green area in the chart should add up to $5 billion. The average revenue for all downloads is 24c.
Although there has been a drop in the revenue and payout rate in the last six months, the cause may be due to seasonal effects. We have not been able to see data that might show seasonality in prior years so we can't be sure it exists. However, it makes sense to me that new buyers are likely to engage in a burst of app buying and there are more iPhone purchases in the second half of the year than in the first.
In any case, the current "run rate" of payments to developers is about $7.5 million per day or $230 million per month. Both are up from last year.
Whether revenues are decreasing or not will require some more data. The last period's 20c is not far below the app store lifetime pricing of 24c.
At the 2012 WWDC, Apple released new data concerning its App ecosystem. Namely:
30 billion apps downloaded to date (excluding updates)
$5 billion paid to app developers
400 million iTunes accounts
These three data points allow us to update our picture of the app economy. First, the app download rate.
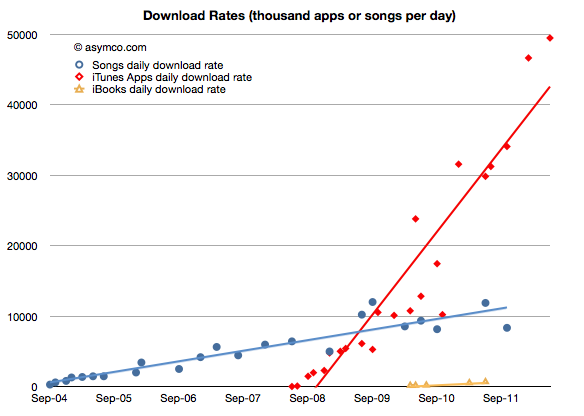
As would be expected from an expanding user base, the app download rate has been increasing. It is now at about 49.5 million apps downloaded every day. The history of this rate is shown in the chart below:
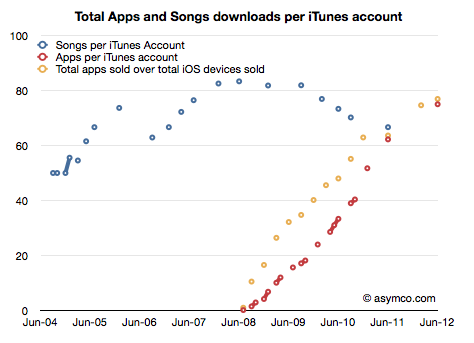
I added the same data for iTunes songs and book downloads for comparison. Note that although music and books are available to the same user base (actually higher due to Macs and iPods which do not run apps,) apps are being downloaded at a far faster rate--at least four times faster.
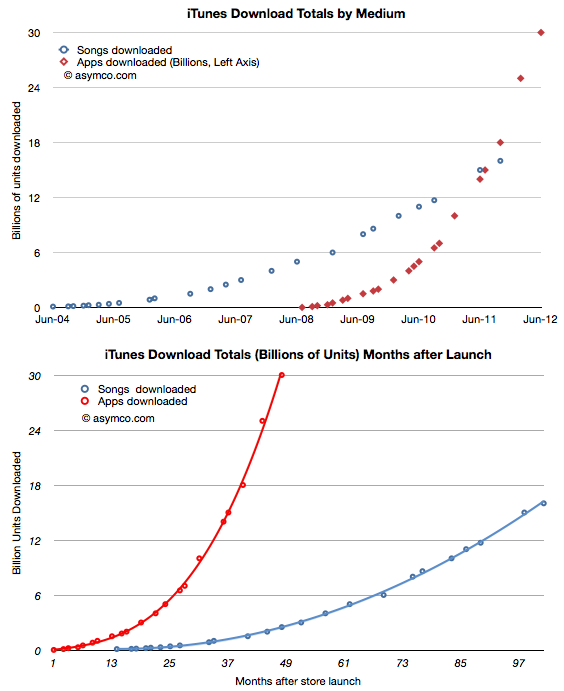
In terms of total, cumulative downloads, the comparison is even more stark:
It won't be long before total app downloads will be double total song downloads. Put another way, in the time it took the App store to reach 30 billion, the song store sold only 3 billion.
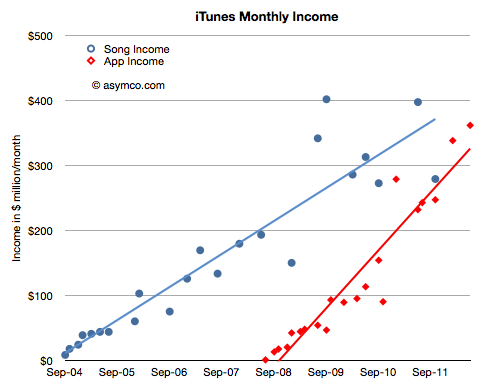
On average, songs are more expensive than apps ($1.29 vs. $0.24). What is the difference in value, not just units?
The data shows that apps have very likely overtaken songs as "gross" income. Apple does not book all app income, only the 30% share they keep, but in terms of transaction value, clearly apps are now a bigger business.
What about consumption? Are individual iTunes account holders buying a constant or variable number of songs or apps?
Here again apps show a distinctive pattern of out-performing songs. As far as digital media is concerned, apps are taking the download business by storm.
What about pricing? Is the expansion of the user base into the hundreds of millions leading to a collapse in app pricing?
No. You can see the price as the ratio between the downloads and the revenue to developers. If downloads scale more rapidly than payments then pricing is decreasing. As it turns out the average price of an app has held steady since approximately 1 billion downloads were recorded. That price is now about 24 cents per app (including free).
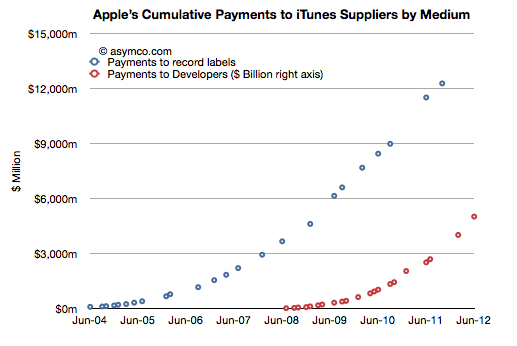
Finally, how about the content owners? Are payments to the owners of the media beginning to favor developers over music publishers/promoters?
Developers still have a long way to go. We can't be sure about how revenues are shared with music labels, but it's probable that they are still receiving bigger checks than developers. However, under some scenarios this will change quite soon.
The bigger story here is that the iOS app economy has reached a run rate of $4.3 billion per year from a standing start four years ago.
How big will the TV app economy be four years from the launch of an Apple smart TV?
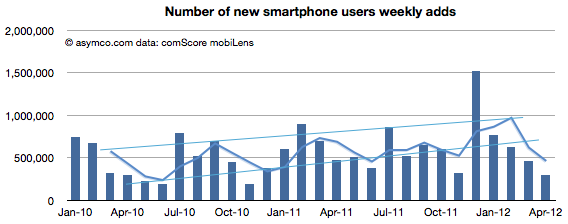
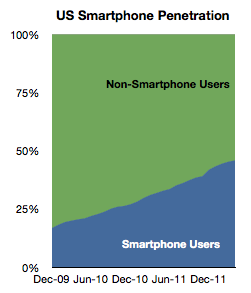
The latest data from comScore showed a few surprises:
New smartphone users dropped to a very low level, below the trend line.
Slightly less than 300k new smartphone users abandoned their feature phones every week during the month. Compared with the 1.5 million per week in November, it's quite a slowdown.
Penetration growth slowed as a result as well. Only 1.3 points of share were gained by smartphones.
It's still likely that the penetration will reach 50% by the end of summer this year (as was predicted in 2010).
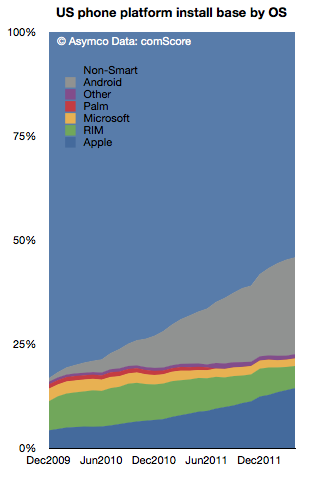
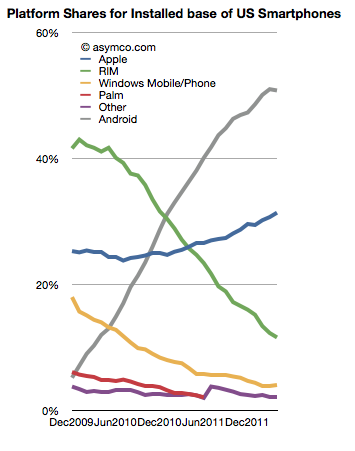
When looking at the picture above broken out by platforms, we see signs that the slowing in smartphone growth seems to be attributable to a slowing in Android adoption:
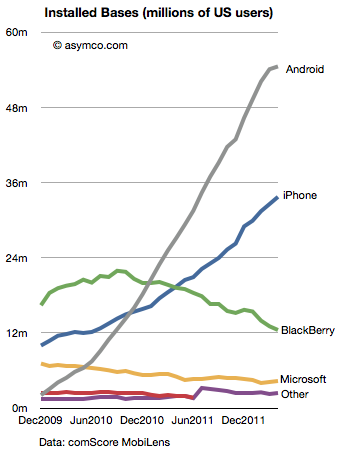
Here are the installed bases in users over time of the different platforms:
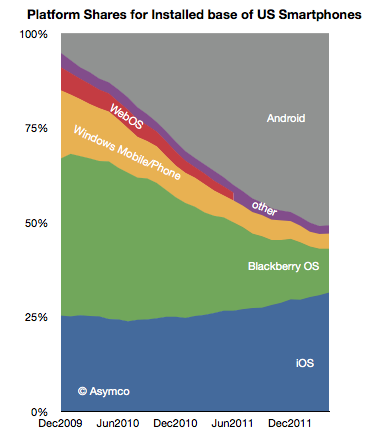
The share of users of the platforms is shown below, first as a stacked area:
And also as a line chart:
This last chart shows the first time when Android share dipped sequentially. It should be watched closely as an indicator of a change in market dynamics. As we reach saturation, the basis of competition will change.
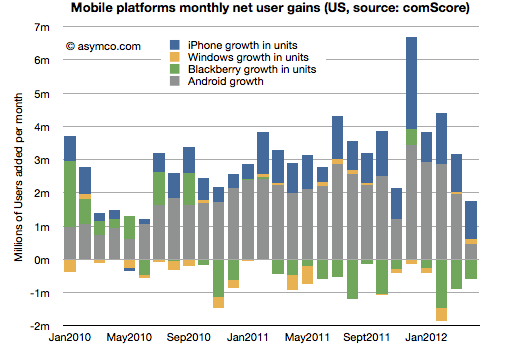
Finally, the last chart shows net user gains for the platforms.
Here again we see the lowest user growth for Android since 2009 (and hence since it reached mainstream distribution.)
It's perhaps too early to suggest that we're seeing a slowdown in the US for Android. Perhaps there will be a return to growth in the fall. The concern has to be that rather than seeing the net adds growing--as they have for two years with only two contiguous months of decline--Android net adds have been falling for four months.
Markets are difficult to measure. Mainly because the information is not easy to obtain and that which is obtained is not made public. Collecting, analyzing and filling in the gaps is big business with many firms involved in selling it.
However, with all the analysts and companies selling and promoting their "numbers" it's important to understand the difference between the methods used. There are for instance at least the following measurements:
Units sold to end users. For example NPD or GfK data of retail transactions. Also Gartner's estimates for phone units sold.
Units sold to the channel. For example units recognized on income statements usually reported by companies. Also IDC's estimates for phone units sold.
Units in use. For example comScore and Nielsen survey data.
Units "activated". The measurement Google uses to describe Android performance.
Intent to buy. For example ChangeWave surveys of early adopters.
Utilization rate. For example browser statistics.
Each measurement tells a different story about the market but the best story is told when all data is analyzed in a combined integrated market review.
Before diving into that it's important to understand the difference between the first and second measurements or the difference between shipped and sold.
What does "Sold" mean?
Let’s say that you sell a phone to another party. What constitutes a sale? The sales agreement? That you shipped it? That he wanted it? That you were paid for it?
What if he changes his mind and returns it? Is it still a sale? What if a manager's bonus depends on these sales? What if the company’s share price depends on these sales? Is there a way to rig the accounting?
As it turns out, yes there are; many ways. Unethical and fraudulent practices happen surprisingly often. A classic instance would be: A customer is shipped ten phones, though he only wants one, and he gets paid to ship the other nine back, after the close of the year.
The sales manager records ten times the sales he actually made, making ten times the commission and the company’s stock price rises. To compound the offense, the manager could also tip his friends to short the stock at the end of the year, leaving investors “holding the bag” when the inevitable correction follows.
There have been so many cases of this kind of accounting fraud that the FASB (GAAP), SEC, and IFRS have placed a very stringent definition on “revenue recognition”. This means that although you can sell all you want, the company can only recognize the proceeds and profit in the financial statements according to strict rules.
In the case of hardware (Sales of Goods), the customer must receive it (“delivery has occurred”), and like it enough to not return it (“amount to be refunded”), and be able to pay for it (“collection is probable”). If some are projected to be returned or unpaid, that percent is subtracted from total revenue. In the case of software (Sales of Services), it is generally accounted for over a time period. And because it is customary to send the customer upgrades, the revenue must be spread out over the time the service is provided. (“upgrade rights … 24 to 48 months.”)
It gets complicated when a piece of hardware has upgradeable software. The rules used to stipulate that the hardware, in its entirety, must be accounted for as a service and have subscription accounting. This is how Apple had to report sales during the first few years of the iPhone. It still defers some revenues for its hardware, mainly on account of iCloud, but the vast bulk of hardware revenue (96%) is now accounted upfront, recognized upon the product's acceptance by customers. 4% is for software upgrades and is accounted for over a specific lifetime of the product (24 months in the case of the iPhone).
What does "Shipped" mean?
The discussion so far implies that if a product that is accounted for as "Sold" on an income statement does not mean that it's in the hands of an end user. These "revenue recognized" products are sold to a distributor, typically for a phone that's an operator.
These sales satisfy the requirements for financial reporting as revenues booked. But they are not in the hands of users. Nor are they "activated" and they don't generate page views that are measured by web analytics companies. Most analysts and companies now use the phrase "Shipped" to describe these revenue-recognized units though it's also common to hear "sold".
When a product sells to end users it's sometimes called "sell-through". It's counterpart is "sell-in" which is sales to the channel distributors.
A big gap between sell-in and sell-through might imply large amounts of in-channel inventory. This is product that is sitting either in stores or in warehouses or on trucks in transit. If sales are steady, the inventory is measured in time as in "weeks of inventory". This means that the excess is expected to be sold within a fixed time frame if shipments were to end. The smaller this amount, the better or "tighter" the operations are. Inventory, as Tim Cooks says, is fundamentally evil. It eats capital and erodes profitability.
Sometimes miscalculation of sell-through could result in vast amounts of inventory that has to be returned by distributors. That inventory is either written off or sold at fire sale prices resulting in a "write-down". This happened recently with both the HP TouchPad and with the RIM PlayBook. This special charge against income is a one-time (usually) incident but it can also affect a firm's reputation with channel partners for a long time. This type of failure is very costly.
Therefore what matters most is to keep the difference between Sell-in and Sell-through as small as possible. However, it can't be too small. Sometimes if Sell-through is too fast, you get stock-outs which means that there is more demand than supply and sales opportunities are missed. This has happened many times with iPhones and iPads. This is also an unwanted situation (unless there was too much inventory in the channel during the previous period and thus it was being drained in the current period.)
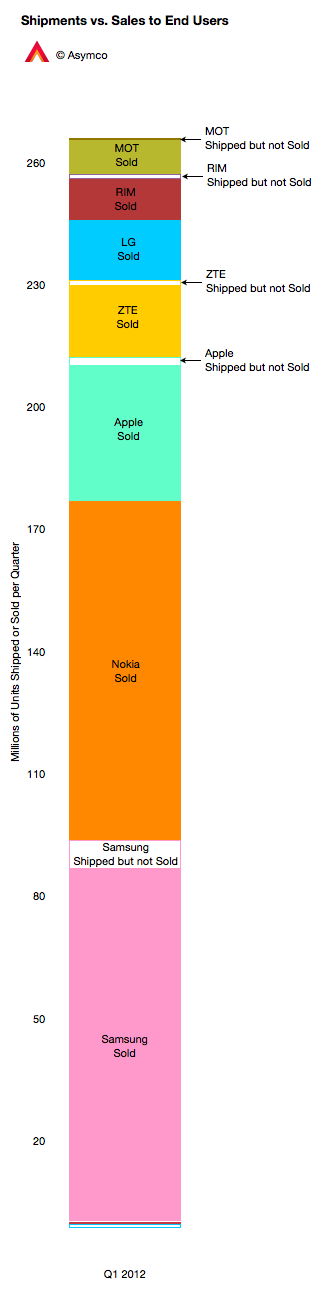
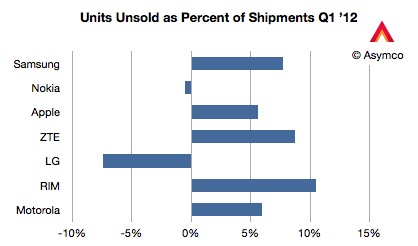
The chart to the left shows how the phone market looked for various vendors last quarter. I compiled the data based on Gartner's "sales to end users" and IDC's "shipments" data. Two vendors had higher sell-through than sell-in (Nokia and LG) probably because they were draining excess inventory. The others had channel inventory of between 5% and 10% of units shipped.
This ratio is shown below in a chart comparing the largest phone vendors.
Management is often rated for performance on this metric, as they should be, since it's a measure of operational skill. However, there are many factors that affect overall performance.
New product launches, windows of opportunity related to seasonal buying patterns, anticipating macroeconomic slowdowns, even natural disasters and legal challenges can affect this metric.
Understanding the overall market requires an appreciation of this distinction but also an understanding of all the other metrics listed above and what stories they tell.
---
Notes: My thanks to Michael Dediu for input on this discussion.
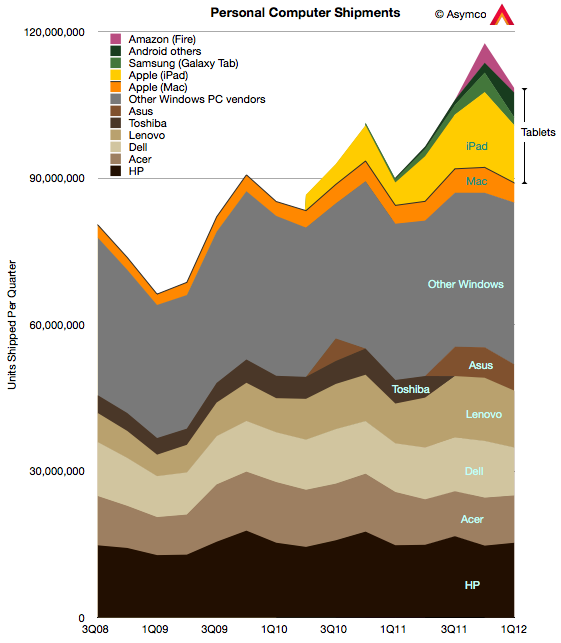
In terms of units Windows-based computers made up 78% of all PCs sold in Q1. That was an increase from the 74% in the previous quarter but a decline from 90% a year ago. OS X based computers were about 3.7%, a decline in share both q/q and y/y, something the company attributed to a transition quarter.
The following chart shows the composition of vendor volumes with tablet and traditional form factor computers included:
iOS computers (i.e iPad) were 11% of the market, declining from 13% last quarter but increasing from Q1 '11's 4.2% share. Apple reported that the iPad was not at supply/demand balance and thus could have sold more units.
Amazon's shipments went down significantly though sell-through was perhaps twice sell-in due to inventory build-up during the previous quarter. Overall, about 5 million Amazon Fire tablets were sold since the product's launch.
The third significant tablet vendor was Samsung, which sold about 1.6 million tablets, down sequentially but up y/y. Other Android tablets may have shipped another 5 million units.
Overall, Apple remained the top vendor with 14.6% share, followed by HP with 14.1% and Lenovo in third at 10.7%. Dell just barely managed to beat Acer with 9% vs. 8.9%.
The impact of the tablet (aka iPad) market is being described in the response to a significant earnings miss by Dell:
Sterne Agee, which admits it probably shouldn't have upgraded DELL from underperform last week, says it's notable that the PC maker acknowledged competition from Apple and Google for the first time as part of Tuesday's dour F1Q report and forecast. Meanwhile, Mizuho calls DELL a "show-me-story for now" in cutting it to neutral and cutting its price target 25% to $15. And ISI snarks "everything is bigger in Texas--including the misses." It adds while the company "is making the right business-model changes...results will remain 'chained' for years (not quarters) to commodity desktops/notebooks, which comprise over half of sales."
- Dow Jones Newswires (Kevin Kingsbury)
And so, two years later, the impact of the iPad is becoming abundantly clear, even to the incumbents. The resistance and denial was profound. Even on this blog, the agitation and anxiety when the subject of the iPad as disruptor came up was palpable.
Perhaps that is the greatest testament to the disruptive potential of a product.
Chris Brennan asked a few important questions regarding potential saturation of the iPhone market.
Is the iPhone anywhere near saturation? Can Apple continue to shift iPhones in ever increasing numbers or is a sales plateau realistically on the horizon?
The market for mobile phones is approximately 5.5 billion connections, perhaps 5 billion users. The iPhone has approximately 300 million installed base. I consider a base of 1 billion users to be a minimum for continuing participation in this market long term. Licensed platforms will reach this in no more than two years. I don't know what Apple's ambitions are but if they don't triple their base I don't see a strong future for the company in mobile phones. In order to triple the base the company will need to sell substantially more than an additional 700 million iPhones. The retirement rate can be as high as 50% of installed base. Apple will need to sell at least 1 billion iPhones in the next few years. Seen another way, Apple has a market share of about 9% on a quarterly basis. This needs a lot of improvement. Chinese vendors are not standing still.
Can the Mac also continue to outperform the rest of the PC market for long?
The PC market is in decline. It will continue to decline as its disruption continues. The PC market will still exist 10 years from now but, similar to the mainframe market, it will be hard to notice. Apple is doing a fine job carving out a large portion of that market for itself but overall it's an increasing portion of a decreasing pie. It would be better to track the share of profits captured or even share of value rather than units. The reason units were important 20 years ago was because platform dynamics determined whether a marginal platform could survive. Would a 5% share be enough to attract developers? That is no longer an interesting discussion. Applications for PCs are not an area of investment for any significant pool of capital. Development has moved almost entirely into mobile or web. Therefore, as the PC is now a commodity product, the best performers are those who can capture a larger margin. Those margins should be subsequently be invested in new platforms. PC vendors who neither capture margin, nor invest in new platforms are strategically insolvent.
Finally, this exponential growth of Apple products has to end some time soon doesn't it? How many high-income buyers for expensive products can there be left for Apple to target?
Trying to calculate the limits to growth is futile. There are limits but they are not calculable and inaccurate estimates don't offer any useful information.
In 1939 a total of 921 military aircraft were built in the United States. Five years later, in 1944, annual production was 96,318. A question could have been asked by an aviation analyst in 1939 about whether the American aircraft industry could grow. Aircraft, especially multi-engined ones used by the military were _extremely_ expensive. The reason an industry grew exponentially making extraordinarily expensive products was not because of organic demand but because the primary buyers engaged in a cataclysmic global war. In other words, there was a will to buy and hence there came a way to build. Therefore the answer to the question of sustainable growth comes not from an analysis of demand but from an analysis of the consequences of not growing. Not growing would have meant the end of many nation states.
Your question was framed by an implied market categorization: that buyers are either high-income or, presumably, low-income. This is a false dichotomy. Buyers are either needful of a job to be done or not. If the job is important enough, money will be found to hire a product. Sellers of products will also find ways to meet the demand through lower prices and increased capacity. Every product Apple makes used to be out of the reach of all consumers. Whether computers (portable or not), music players and professional grade software, voice recognizing personal assistant cellular phones and tablets are all luxuries or necessities is only a question of timing.
Kenney Ho, a staff reporter from Korean newspaper The Chosunilbo (The Chosun Daily) sent me a set of delightful questions.
According to Kenney, The Chosunilbo "has a history of 90 years, has been the most dominant, and influential paper of all time in Korea. It is the No.1 newspaper company in Korea with more than 1.8 million circulation, firmly holding the largest market possession. The paper is recognized Asianwide, where there are many readers in Japan and China."
-You said "All mobile device vendors experiencing losses are not likely to really recover". Even though, it wouldn't mean that the employees, executives of Nokia has completely nothing in hands for recovery. If you are the CEO of Nokia right now, What are your steps to make Nokia recover its deficits?
My statement was based on the historic data which shows that 14 phone vendors have either exited the business or lost their independence during the last decade. No vendor that has reached a period of prolonged loss making has recovered. These are just observations and it's possible that Nokia may be the first to recover. However, going by the patterns of the past, it would be very unlikely. When I thought about the reasons why companies have not been able to recover I came to the second observation about the way phones are sold. Once a brand reaches a point where it's considered "risky" for distributors and operators to range they tend to defer purchases which leads to a spiral of continuing losses and more damage to the brand. The market amplifies "distress" and recovery becomes impossible.
If I were the CEO of Nokia I would set course for turning the company into a new business. I would approach the market asymmetrically and not try to compete directly with the other vendors. I would look toward services, platforms and software solutions and de-emphasize hardware.
-Many experts say that because Nokia dominated phone making industry in the 2000s, they maintained a corporate culture of complacency, which led them to decline. Do you agree with this? If you agree, Can you point out the examples of Nokia's complacency?
Complacency would mean that Nokia would not invest or try new things. This is not quite right. The company invested in software, services and platforms. It tried many new things and had a large R&D budget. It was the leader in mobile software for many years. There was, however, a culture of arrogance about their position. This meant that they did not think the basis of competition would change. They thought they were too big to fail. They did not challenge the core business model of hardware-first and try to find an internal disruptive business.
-Experts note that Nokia should have reacted directly to Apple's iPhone appearance at 2007. What should have Nokia have done at that time?
The iPhone showed that software and experiences matter more than operator relationships. Nokia did a lot of research on user experiences and software but when the decision came to implement the ideas, the constraints of hardware and logistics and operator preferences took precedence and the software was compromised. What Nokia needed to do is build product around software not software around the hardware and the market.
-Since Apple's iPhone appeared in 2007, Samsung took a Fast-follower tactics which made them successful, which Nokia could not. Do you think Fast-follower have advantage over first-mover?
I don't consider first-mover or fast-follower to be accurate descriptions of strategy. Success follows from innovation and only from innovation. There are various forms of innovation: there is new market creation, new business models, low cost or distribution innovation. Nokia tended to create low cost innovations which opened new, low-end markets. Apple created a new market for browser-based devices and for app-based experiences. These were enabled by an ecosystem that benefited from integration.
Samsung implemented a portfolio strategy with a large number of devices and price points which allowed them to find market niches that could be exploited. This was a distribution innovation. Each strategy has advantages and disadvantages and each strategy is usually linked to company core priorities and processes. There are times during a technology cycle when one strategy is better and another is worse. This is why companies find themselves successful and then fail. Their processes don't match the technology adoption cycle.
For example, in the PC market there is little potential for new experiences tied to an integrated device (except for tablets) and hence there is little growth opportunity for an Apple-like approach. The innovation that matters in the PC market is mostly cost reduction. Nokia was doing cost reduction at a time when voice products were commoditizing. Cost reduction does not work when the basis of competition is new experiences and new business models. As smartphone hardware commoditizes, it's unlikely that Samsung will have an advantage unless is goes to a low-cost approach and enters into direct competition with low-end devices.
-Can you predict the 'Big 5' in handset industry 10years from now? Many people think the list will include Apple, Samsung. Who else might be on the lists?
There is no guarantee that Apple or Samsung will be the top vendors 10 years from now. I expect Chinese brands to become dominant in market volumes. I expect online service companies like Amazon, Baidu, Facebook to create new platforms which and have their own devices, perhaps in large volumes. I expect new input methods (like voice) to create new opportunities and perhaps new platforms and ecosystems. I expect Google may make a lot of money. One thing is for sure, being a hardware-oriented company without software and services and platforms and ecosystems is a sure path to becoming disrupted.
-Nokia was the leading company in Finland. What are the reactions of Finland towards Nokia's downfall?
People tend to blame each other for failures and this is the main discussion topic in Finland: who's to blame. The failure of a company is rooted in complex decision processes which usually take years to run their course. It's quite futile to lay blame on persons, especially since the same persons were celebrated for their wisdom at another point of time. At the same time as Nokia is failing however, another Finnish startup is celebrated world-wide and about to go public: Rovio, the maker of Angry Birds. It will be bigger than Nokia. Finland should make sure there are more Rovios to come.