Asymco

Asymmetric Intelligence

Market

  1. What retail is hired to do: Apple vs. IKEA

    Research · 123 comments

    “Within five years after discount retailing pioneer Korvette’s opened its first store in 1957, over a dozen copycat discounters had emerged. In contrast, the giant discount furniture retailer IKEA has never been copied. The company has been slowly rolling its stores out across the world for [close to 50] years; and yet nobody has copied IKEA.

    Why would this be? It’s not trade secrets or patents. Any competitor can walk through its stores, reverse engineer its products and copy its catalog. It can’t be that there is no money to be made: its owner Ingvar Kamprad is the third richest person in the world. And yet nobody has copied IKEA.

    Our sense is that the other furniture retailers have followed the positioning paradigm and defined their business in terms of product and customer categories, which are readily copied. Levitz Furniture, for example, sells low-cost furniture to low income people. Ethan Allen sells colonial furniture to wealthy people.

    IKEA, in contrast, has organized its business around a job to be done: “I need to furnish my apartment (or this room) today.”  When this realization occurs to people anywhere in the developed world, the word IKEA pops into their minds. IKEA is organized and integrated in a completely different way than any other furniture retailer in order to do this job as well as possible.”

    Integrating Around the Job to Be Done (Clayton Christensen, Harvard Business School; Scott Anthony, Innosight LLC, Scott Cook, Intuit; Taddy Hall, Advertising Research Council).

    IKEA is the world's leading furnishing retailer and an amazing success story. As Christensen points out the success is all the more perplexing because it seems perfectly defensible. Nobody has tried to duplicate or undermine IKEA.

    Positioned around a clear job-to-be-done it integrated design, manufacturing and distribution (including warehousing) as well as "big box" retailing as an experience.

    This may sound familiar.

    Apple's entry into retail depended on a clear job-to-be-done, design, carefully selected merchandise and retailing as an experience. Similar to IKEA, Apple also became a dominant player in its segment and even achieved seventeen times better performance than the average US retailer in terms of sales per square foot.

    At first glance they seem to be similar businesses in terms of strategy or "architecture" but how do the actual businesses stack up? Can we find data to support any claim of similarity.

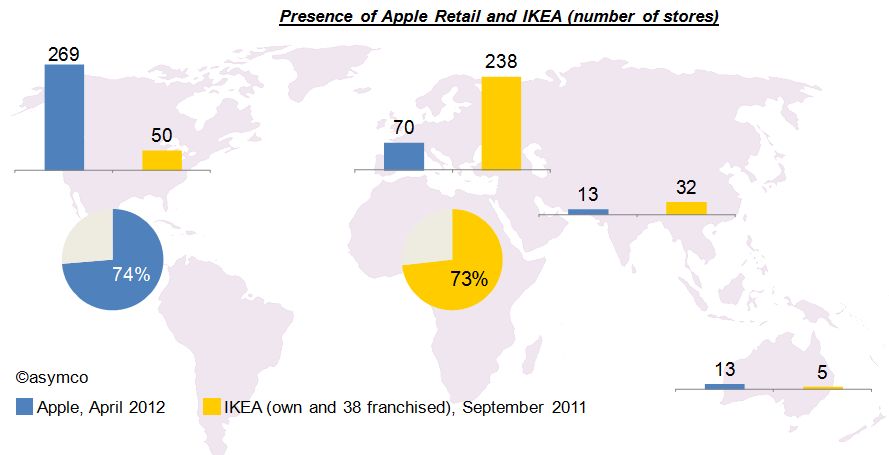
    Let’s first have a look at the geographic focus of both companies. The graphic below shows that Apple’s retail operations are focused on North America with 74% of its 365 stores in the USA and Canada. By contrast, and maybe as much based on its origin, 73% of IKEA's 325 stores are located in Europe[2].
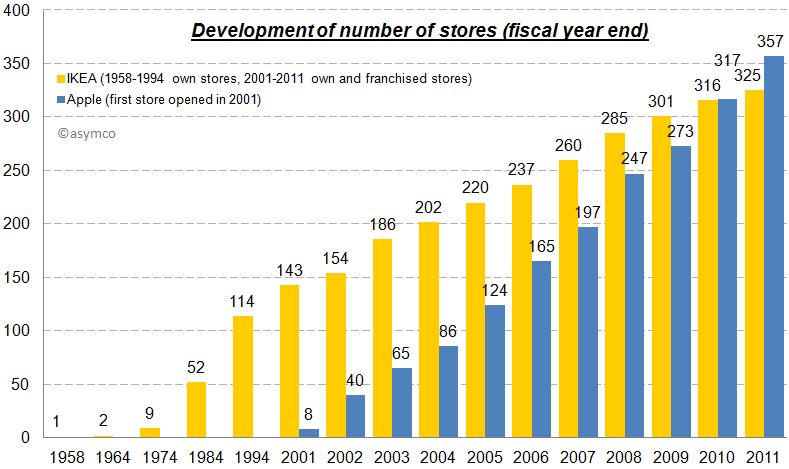
    Unlike Apple however, IKEA has grown much more slowly. IKEA’s first store was opened in 1958 and had 6,700 sqm (72,110 sqf). The first two Apple stores opened in May 2001. Since then the number of Apple stores grew significantly faster (CAGR: 46%) and surpassed the number of IKEA stores in 2010.
    The other difference is in sales growth. In 1954 IKEA’s revenue amounted to approximately $1 million but has grown steadily (note in chart below that first five bars represent decades). In contrast, Apple has grown more rapidly and is also more profitable in terms of margin.
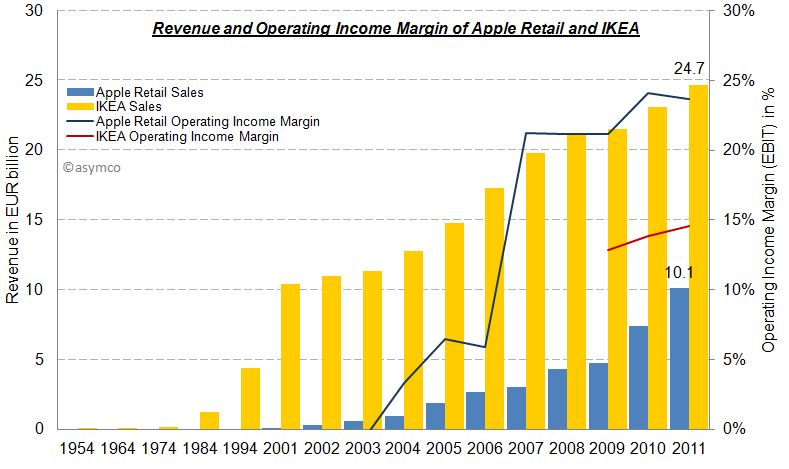
    Part of the difference in growth is that Apple was able to subsidize its entry: Apple’s retail operations were loss making for the first three years while IKEA had to rely on financing from its own cash flows.

    Eventually, Apple retail became self sufficient and is now more profitable than IKEA. The following charts provides an overview of the economics of Apple’s retail operations and IKEA side-by-side:
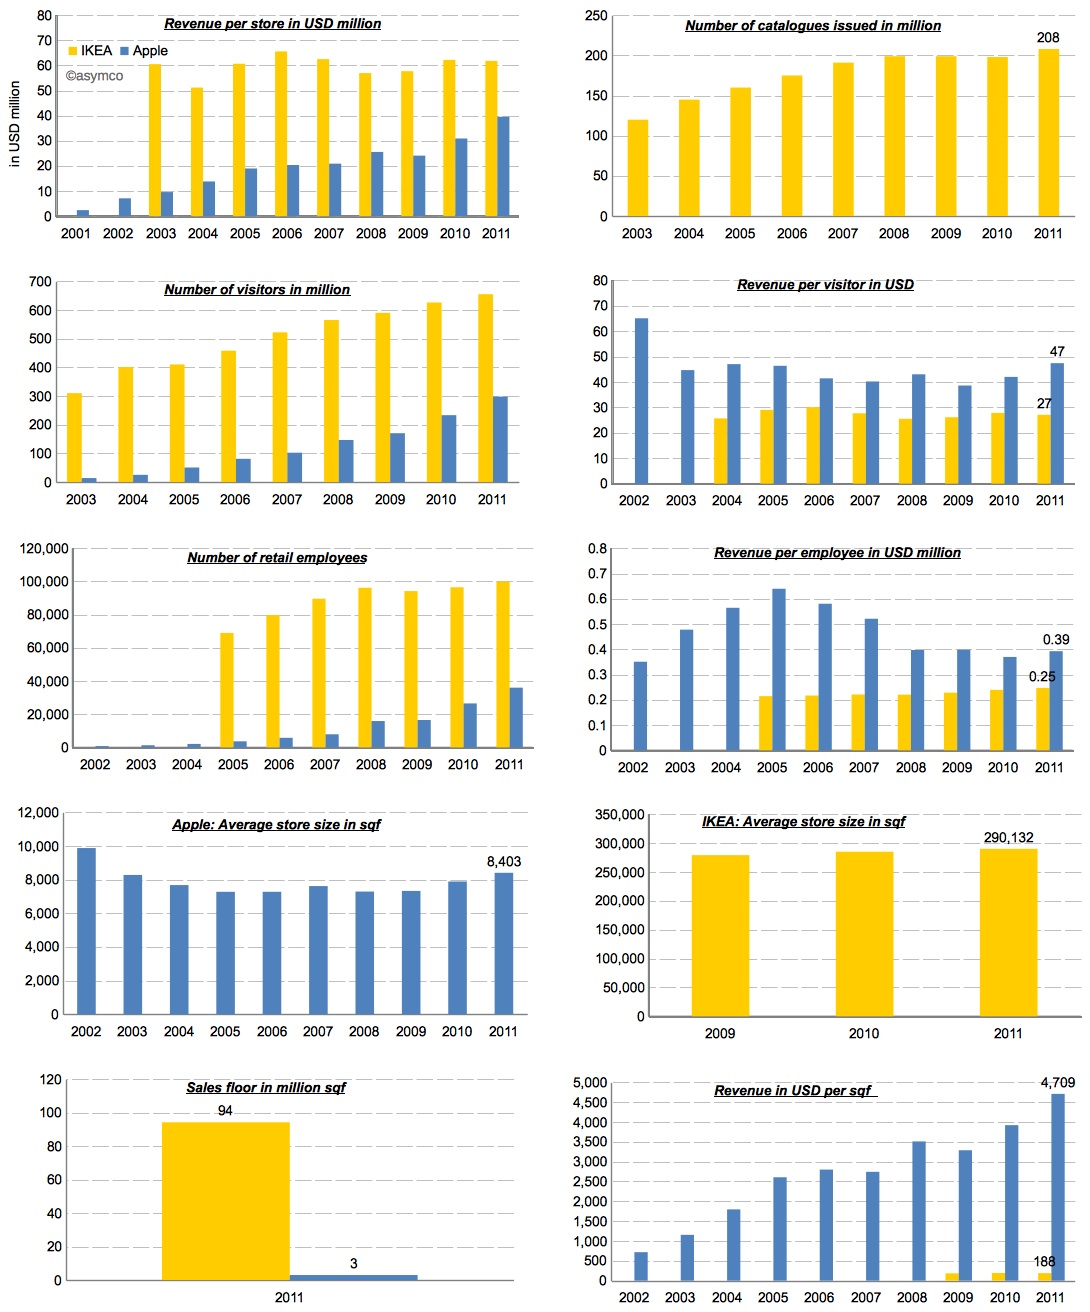
    While Apple’s revenue per store is still growing, IKEA’s business seems more mature and stable. This makes sense because furniture prices are stable and the number of products (SKUs) depends on available area per store which cannot grow. Apple on the other hand is limited only by traffic issues. Its products take little space and can even be stored off-site.

    Speaking of traffic, with 655 million visitors in 2011, IKEA had more than twice as many visitors in its stores compared to Apple. However, each visitor spent about $27, while Apple’s store visitors purchased for almost twice as much.

    The same story applies in employee productivity. IKEA has three times the number of retail employees, but Apple’s revenue per employee are 1.5x bigger than IKEA’s.

    The largest difference is in the efficiency of real estate. In terms of total sales area IKEA’s operations have more than 30 times the sales floor of Apple.

    As much as these numbers tell a story, they don't help us understand the cause of success. The two companies have completely different operations and their metrics seem at odds to one another. What works for one could never be applied to the other.

    The fact is that there is no magic economic formula for disruptive retail. For example, by measure of sales per square foot, IKEA would not even make the top 20 list of US retailers.

    However, there is one major thing they have in common: a clear formula for positioning your retail operations. Both operations are positioned around a job-to-be-done that has a high priority in people’s life. As mentioned in the opening quote, In IKEA’s case it is “I need to furnish my apartment (or this room) today” and in Apple's case Tim Cook said it best:

    “Our retail stores provide the best buying experience and the best customer service anywhere. And while that’s important for a buyer of a Macintosh, in some ways it’s even more important for a buyer of an iPad or an iPhone or another post-PC device because these devices are new to many people. There needs to be a place to discover them, to learn about them before they are purchased, and learn how to get the most out of them after they’re purchased.” Tim Cook, March 2012

    Apple offers a place where people can discover and get answers about technology without the pressure of making a purchase. The job is to simplify that which is complex for a price premium.

    IKEA offers a place where people can get exactly what they need exactly when they need it. The only downside is that "some assembly is required". In a way, their job is to introduce some complexity in exchange for convenience and a discount.

    In the end, they both get the job done and are amply rewarded for it.

    ---

    Notes:

    1. Including 13 in Russia.
    2. The acquisition of UK-based furniture retailer Habitat in 1992 is the only exception.
  2. Apple Stores have seventeen times better performance than the average retailer

    Research · 49 comments

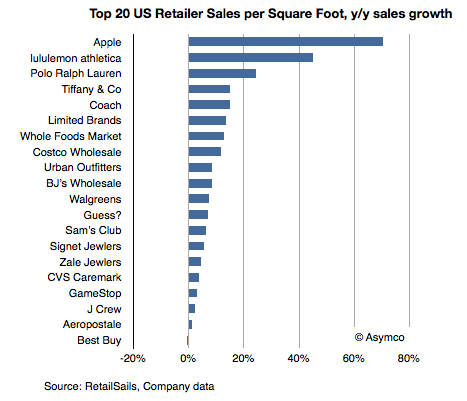
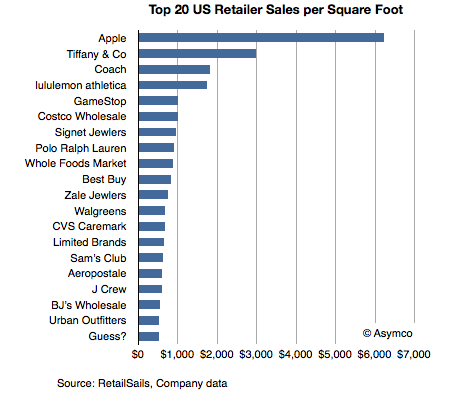
    Thanks to RetailSails we have some data on retailers in the US which can be used to calibrate the performance of Apple retail. RetailSails compiled a table of the top 20 chains by sales per square foot (annual basis). The total sample was 160 American retailers (excluding restaurants) that publicly report results.

    Sales per unit area is a standard and usually the primary measurement of store success. Here are some benchmark figures:

    • Annual store sales in the range of $300 per square foot is considered respectable in the US.
    • The US national average for regional malls is $341.
    • The average for specialty apparel retailers is $400 per square foot.
    • The average for jewelers is in the range of $600 per square foot.
    • The median for the best 20 US retailers is $787/sq. ft.

    The data for the top 20 is shown in the following chart:

    The data shows Apple leading by a significant margin. It's more than twice as efficient as the second place Tiffany and Co. It's also more than seven times the median of the top 20 and seventeen times better than the average mall retail space.

    Note also that this data includes only physical retail and excludes e-commerce, catalog or services revenues. It should only be used to compare physical retail performance.


    The achievement is also remarkable when measuring growth in overall sales.

    Apple leads in absolute performance but also in growth.

    Note also the performance of electronics retailers that might be comparable to Apple. Only Best Buy and GameStop are on the list, but their growth is among the poorest, with Best Buy going in the wrong direction (data was current as of August 2011).

    We'll be getting an update on Apple retail at the next earnings call in a few days. To read more about Apple retail see:

    Apple retail growth data | asymco

    The growth surprise in Apple retail | asymco

  3. Half of US iPhones are repeat purchases

    Research · 46 comments

    Canaccord Genuity analyst Mike Walkley writes in a note to clients today. “In fact, we believe iPhones are outselling all other smartphones combined at Sprint and AT&T and selling at roughly equal volume to all Android smartphones at Verizon.”

    via iPhone Tops Sales Charts at Each of Its U.S. Carriers - John Paczkowski - Mobile - AllThingsD.

    That's useful data. Mainly because we can use it in combination with comScore data that tracks a different market measure. comScore's MobiLens service tracks US mobile installed base. By measuring the difference between their stats one month to the next, one can measure the gain in a particular platform.

    Comparing that gain with the sell-through rate in the same period can yield a figure for the number of units sold as upgrades vs. those sold to new users.

    The latest comScore data (period ending February) shows that Android added 2.87 million users to its base while iPhone added 1.52 million. If we assume that Android sold a minimal number of replacements (due to the limited time in use of bulk of units) and round up to 3 million for February, and if we assume that Apple sells as many iPhones as Android (which is what Walkley suggests) then we can conclude that in the US roughly half the iPhones are bought as replacements for existing iPhones.

    Extrapolating this to global markets may be risky but already we can begin to form a picture of how the iPhone franchise is becoming an annuity-based business.

    Apple likes to point out that "half of Mac buyers are first time buyers." In the case of the iPhone perhaps they could also say "half of iPhone buyers are repeat customers." At this stage in the platform, that's a powerful statement. If the repeat customer rate is high then it suggests strong loyalty but it also may suggest poor competitive position vs. non-consumption or alternate platforms. If the repeat customer rate is very low it may suggest competition vs. non-consumption but it may also suggest low loyalty. It all depends on the overall growth in the market and size of installed base.

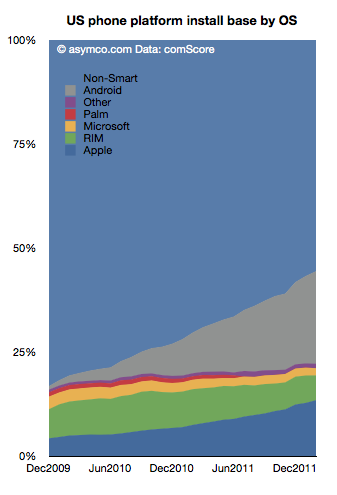
    The following chart shows the overall market growth and the position of the various platforms within that growth.

    Note the time scale is slightly more than two years. This suggests that the vast bulk of Android units in use (grey area) consists of first use units. New purchases are going to first time buyers. In contrast, the shrinking RIM total implies extremely low sales as the age of the base is far older than the time scale. iPhone base is both growing and being upgraded.

    As we reach 50% penetration of smartphones, platform churn will become a significant component of market performance. The loyalty and "stickiness" of Android will begin to be tested. Current surveys show reasonably good satisfaction ratings for Android phones (around 60%) while iPhone's are even higher. But let's keep in mind that RIM's satisfaction and the loyalty of their customers was exceptionally high a few years ago. The rate of evaporation of goodwill toward the brand is breathtaking.

    The longer term test of mobile platform performance will be in the recurring purchase rates. Loyalty must be earned and preserved. I.e. "You come for the product, you stay for the ecosystem."

    So far, the iPhone seems to be getting a passing grade while Android has yet to face the test.

  4. RIM to give up

    Research · 78 comments

    RIM’s CEO, Thorsten Heins was quoted as saying, “We plan to refocus on the enterprise business and capitalize on our leading position in this segment. We believe that BlackBerry cannot succeed if we tried to be everybody’s darling and all things to all people. Therefore, we plan to build on our strength.”

    via RIM to give up most consumer markets | Ubergizmo.

    RIM's latest quarterly results show a continuation of the decline in sales that began in Q1 2011.

    Here are the highlights:

    • Smartphone units declined 26% y/y and 21% sequentially. Over a four year period the company still shows a positive growth of 20% compounded, though that is far below industry average
    • The smartphone revenues were down 29% y/y and 23% sequentially.
    • Including service revenues, the revenue per smartphone dropped to $346, a drop of 4%.
    • I estimate the phone operating margin to be less than 5%. The company swung to a net negative operating margin due to write-downs of tablet inventory but the phone business managed to break even.
    • Operating income from phone operations dropped to the lowest level in five years.
    • The company is still generating cash flow and has a cash reserve of over $2 billion.

    Seen in isolation, the company is clearly struggling but does not seem to be on its last legs. But no company should be seen in isolation. As part of a competitive market, the company is in far worse shape. The following chart shows the AMP index which measures relative performance through a blend of market shares.

    This chart does not include the latest quarterly data but if it did it would be sure to show a continuing decline. The AMP index actually shows RIM peaking in Q1 2009, well before the volumes peaked.

    It's within this context that we need to evaluate the new CEO's strategic shift. In the quote above we have the first significant strategic departure and split from the past. Should it inspire hope or despair?

    The idea of focus has huge benefits. Focus and the art of saying no are keys to greatness. However, you only succeed if you focus on the right thing. "Enterprise" is not the right thing. It's not a valid target. Enterprise support is a feature, not a product. I don't mean that as opinion, but as a point of fact. Focus on a set of customers whose only characteristic is a job description is missing the whole point of focus.

    Focus needs to be positioned on a job a brand needs to be hired to do. The idea should be to solve an open problem which is either too complex or too uneconomical for anyone else to solve. Corporate buyers have problems to solve but the BlackBerry no longer offers unique or defensible solutions. Furthermore, corporate buyers are themselves being dis-intermediated from the computing purchase decision. Sometimes this process is called "consumerization" but it is more plainly explained as "commoditization". The selection of tools for workers by a group that claims to understand their needs better than they do is an archaic concept.

    This was true even in 2005 when RIM began targeting consumers. It was then that they saw the writing on the wall--that their enterprise business was being commoditized. All of RIM's growth since has been in consumer segments. By abandoning that trajectory RIM is effectively giving up on growth. And giving up on growth is simply giving up.

  5. Top-down vs. bottom-up: Which market analysis method is appropriate when disruption is knocking

    Research · 29 comments

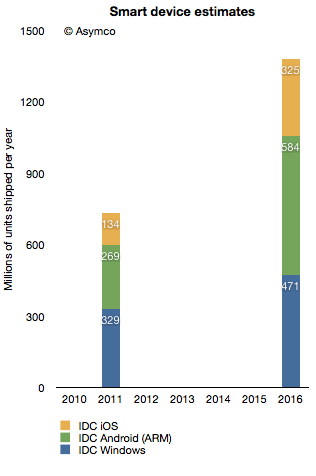
    In terms of platforms, IDC expects a relatively dramatic shift between 2011 and 2016, with the once-dominant Windows on x86 platform, consisting of PCs running the Windows operating system on any x86-compatible CPU, slipping from a leading 35.9% share in 2011 down to 25.1% in 2016. The number of Android-based devices running on ARM CPUs, on the other hand, will grow modestly from 29.4% share in 2011 to a market-leading 31.1% share in 2016. Meanwhile, iOS-based devices will grow from 14.6% share in 2011 to 17.3% in 2016.

    Via: IDC - Press Release - prUS23398412

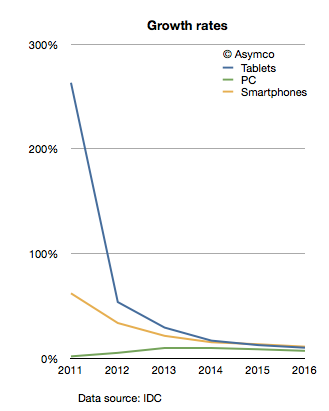
    The company provides a stacked bar chart (follow link above) to illustrate their view of the market. I took the data they included and measured the implied growth rates for the product categories:

    IDC is implying that in four years the tablet market will be growing at 10%, the Smartphone market will grow at 11% and the PC category will grow at 11%. In other words, five years from now the PC market is expected to grow faster than the tablet market and just as fast as the smartphone market!

    What's more remarkable is that this situation is not going to happen in four years. The slowdown in growth is actually expected much sooner. The growth rates two years from now are expected to be: Tablets 17%, Smartphones 15% and PC 10%. IDC is unequivocal: by 2014 the good times will come to an end to the post-PC challengers. These growth rates would be catastrophic for share prices and the value propositions of the new platforms to developers, partners and consumers.

    What's more, these growth rates are striking not only because they predict a collapse in the value of most market challengers but that they also predict a strongly resilient PC market. How can we test this forecast?

    I tried to reconcile this doomsday scenario with what is known about the components making up the data. I.e. what "bottom-up" data is IDC using? In the quote above, IDC offers some insight into this market participant data. Based on the category and share data they published it's possible to infer the following:

    Bearing in mind that neither iOS nor Android existed five years ago, we can observe they are bigger together than the PC market. And yet, IDC predicts a compounded average yearly growth rate of 16.7% in Android, 19.4% in iOS and 7.5% in Windows between today and 2016.

    In aggregate, IDC forecasts that in the next five years Android will not manage to double and that iOS will only increase by a factor of 2.4. Is this believable?

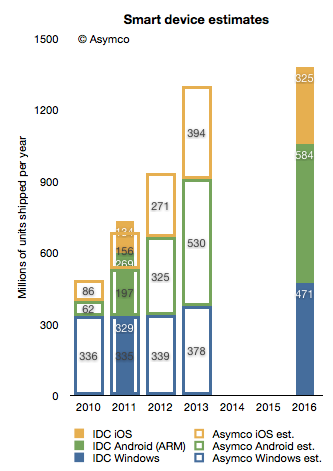
    I try to stay away from long term forecasts, but I do maintain a short term forecast based on recent growth data. My forecasts for this year and next year are shown below.

    I super-imposed my short-term forecast (outline bars) on IDC's long term forecast (solid bars) and a several differences become apparent.

    First, my 2013 forecast is nearly the same as IDC's 2016 forecast. To see why we need to look at each platform separately.

    Perhaps we might (with difficulty) agree on Microsoft's potential. I believe Windows 8 will have a catalyzing effect and that Microsoft will begin to see its platform grow again. However, my expectations are modest. To increase Windows sales rate by 100 million units/yr between 2013 and 2016 is possible but ambitious.

    The real problem is that our Android and iOS forecasts are outside any zone of possible agreement. Maybe there is a difference in what we measure. For a hint, we seem to disagree on the number of Android devices shipped in 2011. I used Google's own reports of activations to work out the yearly shipment estimates. Perhaps IDC is including versions of Android that are not Google sanctioned.

    We also disagree on the 2011 iOS figures. I obtained 156 from Apple's own reports. Again, perhaps the difference is the inclusion of the iPod in my case.

    Nevertheless, the difference in the long term cannot be accounted for only through these categorization differences. I would put the cause of the difference down to the methods used in forecasting. As can be seen from the first chart above, IDC's growth rate reductions are extraordinarily steep. Perhaps the approach used by IDC was to forecast the overall market growth and then assignment of shares to participants. This can be called the "top-down" approach. In contrast, my approach is to forecast growth rates based on recent growth rates and moderating these rates gradually. This can be called the "bottom-up" approach.

    My experience and all the data I've ever collected about historic disruptions tell me that the entrants tend to win these types of paradigm shifts. They win through a vast expansion of consumption and the recruitment of non-consumers. Markets tend to experience vast shifts in composition. If we believe this to be true then the bottom-up approach focused on entrants is likely to be more effective vis-a-vis the top-down approach of projecting steady state markets and the implicit assumption of incumbent share preservation.

  6. The parable of Nintendo

    Research · 100 comments

    With the launch of the Wii console, Nintendo averted disaster. When the Wii launched in late 2006 Nintendo had been facing the simultaneous attack from the "seventh generation" Xbox 360 which launched a year earlier as well as the PlayStation 3, both of which set as their bases of competition 3D graphics at HD resolutions. Many wrote off the company and called the console market a two horse race.

    Then, in what seemed a desperate downward leap, the Wii was launched into a different trajectory. It addressed non-consumers with a new, more intuitive controller and standard resolution rather than competing for hardcore gamers with more power and richer graphics.

    Because the Wii was asymmetric and addressed non-consumption rather than trying to be a "better" console in what was becoming a horsepower race, Nintendo expanded the console market. Its innovation was interesting enough that many hard core gamers used the console in addition to a PS3 or Xbox and many non-gamers bought it as their first console.

    The result is that 95 million Wii's have been sold vs. 66 million Xbox 360's and 62 million PS3's.

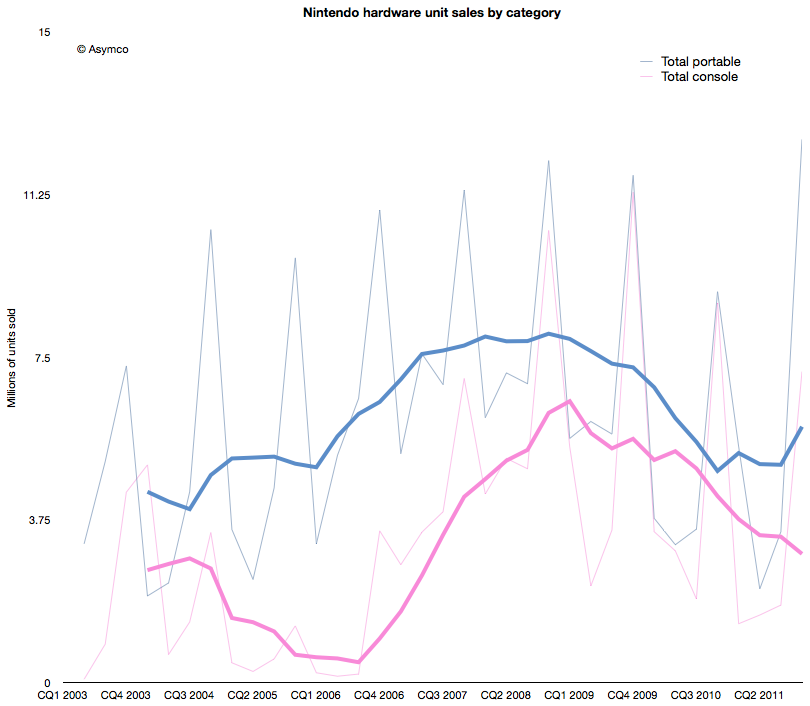
    The effect of the Wii introduction on Nintendo's console unit sales is shown below (pink line).

    The graph above shows that the growth from Wii has stopped. In fact, the console has been in decline since early 2009. Fortunately for Nintendo, the company also developed a mobile strategy. Learning from its Game Boy device, its DS series of portable game consoles allowed the company to diversify its portfolio. The graph also shows the total portable units sold in blue.

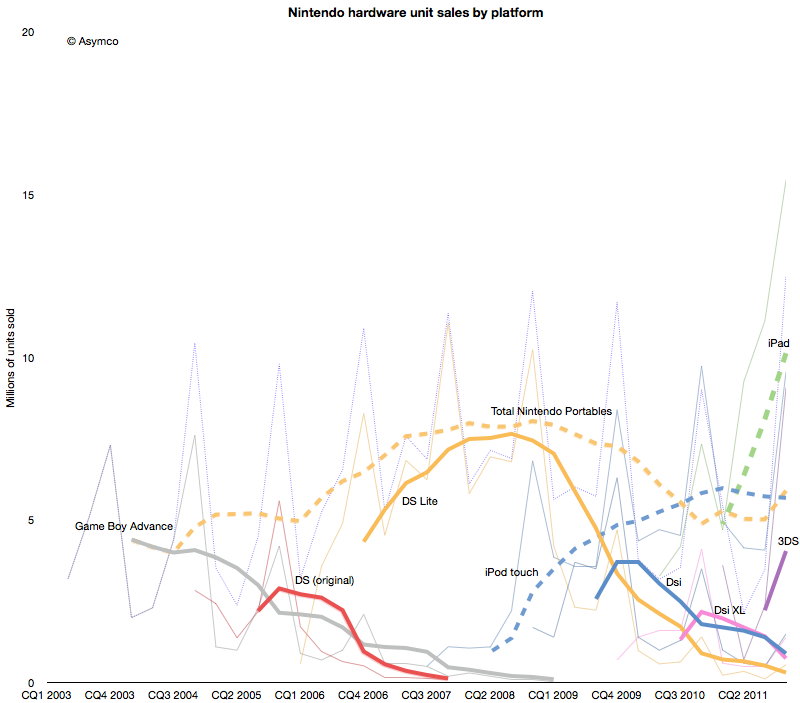
    However, this strategy has not been enough to protect the company from the disruptive effect of mobile computing. As the following chart shows, each new generation of portable from Nintendo has failed to break out of a general pattern of overall decline.


    Contrast the DS product patterns with the iPod touch and iPad--multi-purpose products whose game functionality is "good enough" but whose communications and general-purpose app catalogs are re-defining the basis of competition yet again.

    Nintendo bet on the 3DS to reboot the franchise. The 3DS product does show the characteristic initial spike in adoption but the level it launched at is far lower  than the level of the iPad. Nintendo has a big hill to climb to even recover the volumes it held in 2009. In contrast, the usurper Apple's volumes are doubling each year.

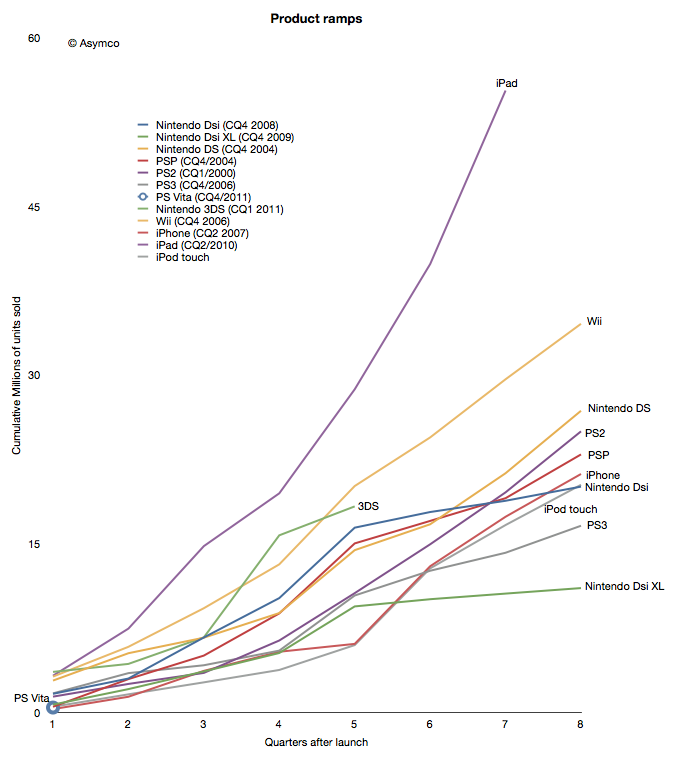
    When products are compared as "ramps" in terms of growth post-launch the story becomes even clearer.

    Although the iPhone and iPod touch ramped in similar ways[1] to the gaming platforms, iPad took an entirely different path. The 3DS benefited temporarily from a price cut but it seems to be returning to a well-worn trajectory.

    The data points a bleak picture for Nintendo. The Wii was a success due to its competitiveness vs. non-consumption of gaming. But another low end disruption took hold in 2007. Good enough games on phones and mobile computers are taking consumption away from dedicated consoles, both fixed and mobile.

    In addition, the rate at which game experiences are improving on iOS imply that they will overtake the "quality" of consoles in the not too distant future. Differences in distribution models also guarantee lower pricing for software for end users and enabling a far larger catalog of titles.[2]

    This may sound like another story of fortune gained and fortune lost. The inevitable "what goes up must come down" aphorism. We become used to this pattern and assume it to be axiomatic. But there are causes for each success and causes for each failure.

    The lesson here is that a company that disrupts does not necessarily survive. Long term survival depends on the ability for serial disruption. Serial disruption is an uncomfortable state for an organization to exist in. As the story above shows, disruptions are usually enabled by "desperate" necessity. Desperation is not something management is trained to aspire for.

    What management strives for is steady state satisfaction and predictability from intelligent planning.

    ---

    Notes:

    1. Though the iPhone ramp matched the consoles, the growth for the iPhone is persisting at 100% y/y five years into the product. This means it is outstripping all console installed bases by at least a factor of 2.
    2. The catalog is not only broad but deep in the sense that there are many new game concepts and experiments being tried. The app store is a vast testbed for game and entertainment ideas.
  7. The unrelenting trends in the US smartphone market

    Research · 27 comments

    The latest comScore US mobile subscriber monthly data is in: comScore Reports January 2012 U.S. Mobile Subscriber Market Share - comScore, Inc.

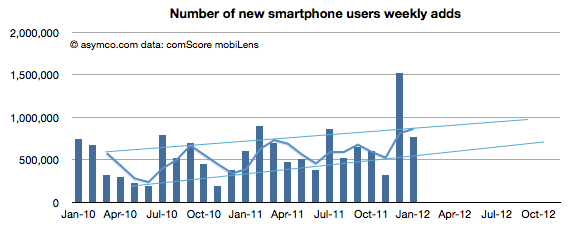
    January saw a return to trend line growth in US smartphone add rates. The 767k/week rate is within the band after November's below- and December's above-the-line outliers. The weekly add rates are shown (with projection of trend) below:

    The pattern shows a likely 1 million new smartphone users per week being added consistently by the fourth quarter of this year.

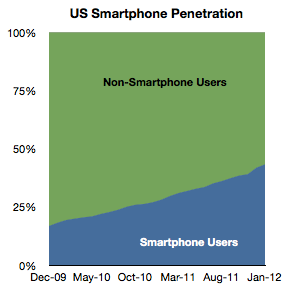
    Overall, penetration of the sampled population (above age of 13, primary phone and excluding business purchases in the US) reached 43.3% in January. The increase was 1.45 points from December.

    A significant 35 million US users  switched to smartphones in the last 12 months, equivalent to 15% of the user population. My current forecast is that 50% of the user base would be smartphone users by June 28th.

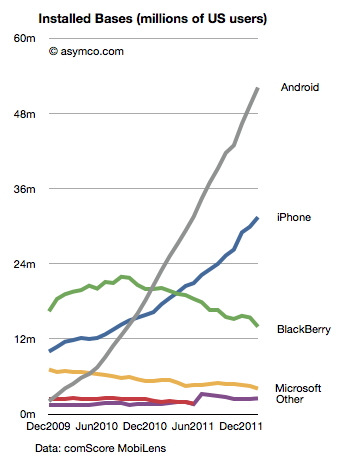
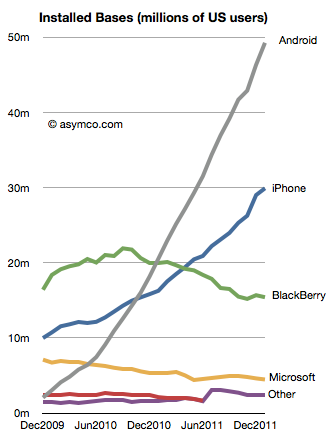
    The platform data shows a continuing pattern. In terms of absolute users Android has reached nearly 50 million users, iPhone 30 million, BlackBerry 15 million and Microsoft (Windows Phone and Windows Mobile combined) 4.5 million.

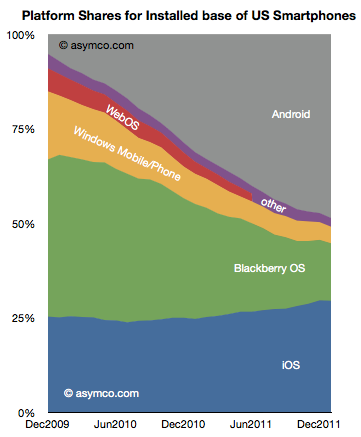
    In terms of market share of the smartphone population, the various platforms stack up as follows:

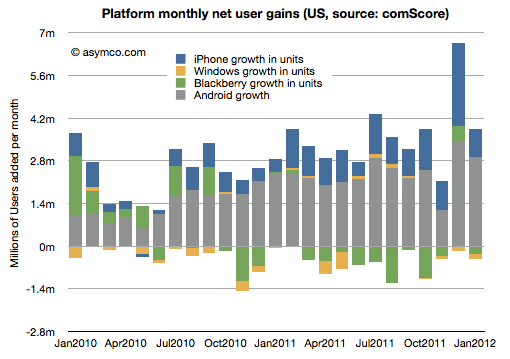
    The net gains for each platform by month are shown in the following diagram:

    RIM and Microsoft have continued to lose users while Google and Apple have continued to gain.

    The two trends that continue are that overall penetration is nearing saturation and that two platforms seem to be increasing their share of that base. The "comeback story" for any of the hopefuls will depend either on switching users away from their current platforms of trying to engage with late adopters. The first option is daunting due to latent network effects related to platforms and the second sounds to be symmetric to existing incumbent strategies.

    Without an asymmetric approach, the challengers are unlikely to succeed.

  8. Segmenting the iPhone opportunity

    Research · 45 comments

    We've been very, very focused on China. China, we've had incredible success with iPhone. Over the past few years, we've gone from a few hundred million dollars of revenue in greater China, to last year $13 billion. So we really've been focused on trying to understand the market there and then taking those learnings to other markets. As it turns out--and not very many people agree with me on this, probably--but what I see is that there's a lot of commonality in what people around the world want.

    Transcript: Apple CEO Tim Cook at Goldman Sachs - Apple 2.0 - Fortune Tech

    People do want the same things globally, but due to various constraints they typically don't get the same things at the same time.

    One of the most important constraints on the purchase of iPhones is the state of 3G (or, more broadly, mobile broadband) networks. An iPhone is a mobile computer whose primary value is derived from high bandwidth data communication. Because this bandwidth is not universally available, the iPhone faces a restricted addressable market.

    The good news is that 3G networks are being adopted very quickly. The International Telecommunications Union reports that 20% of mobile users have "active subscriptions to mobile broadband" (1.2 billion out of 6 billion). That's encouraging but the subscription rate varies widely by country. Ideally we should look at the data on a country-by-country basis.

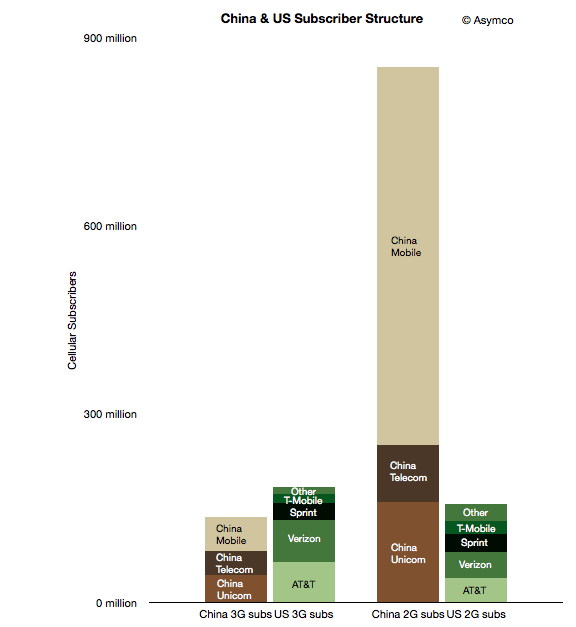
    To start, I took a look at two countries which may form an interesting sample: the US and China. The following chart shows the subscriber structure in the two countries grouped by 2G/3G subscription and by operator.

    The two left-most columns represent nominally addressable iPhone markets. The two right-most columns represent currently unaddressable markets. Note that

    although China is a far bigger market, the lower 3G penetration means that the theoretically "addressable" market for the iPhone is smaller in China than in the US (136 million vs. 183 million respectively).

    However, there are further restrictions. Apple does not have distribution agreements with many (most?) of the world's operators. In these particular countries, China Mobile, T-Mobile and "Other" US operators do not distribute the iPhone. We should subtract those operator customer bases out of the addressable market. But those conditions are variable: operators may sign up for future versions of the phone and 3G subscription rates are increasing. That means we can segment the market as follows:

    1. Currently addressable operators and 3G subscribers
    2. Potentially near term addressable users if all operators agree to distribute the iPhone in these countries
    3. Potentially longer term addressable users if all users switch to 3G and all operators distribute the iPhone.

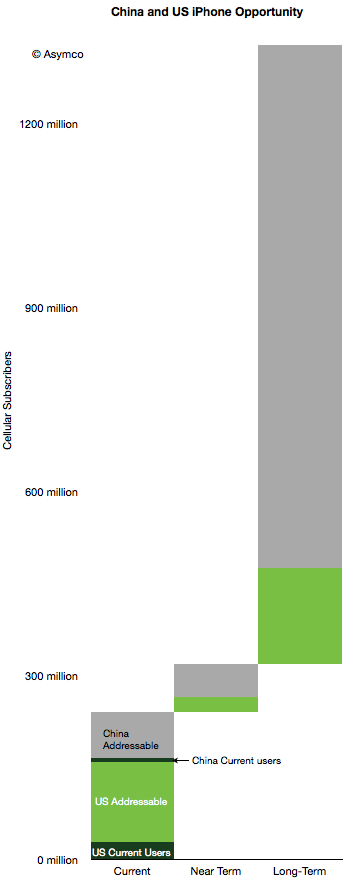
    This segmentation leads to the following diagram.

    I also added the current users given comScore data for the US (29 million) and an estimate of 8 million Chinese users. Here are some observations:

    1. 10% of China's currently addressable market is penetrated while the US penetration is 18%.
    2. If all operators would agree to distribute the iPhone (i.e. including "Near Term" in the addressable total), the Chinese penetration would be 6% and the US 16%.
    3. If we include all users as addressable, China is about 0.8% and the US is at 8.5%.
    4. The penetration of the iPhone in the US and China combined therefore stands at about 3% today.

    The question that comes next is what is a reasonable limit to total penetration? What can we reasonably expect or what could Apple reasonably target?

    I've been using a global share of 20% as a reasonable target to test growth assumptions. Assuming no significant growth in user bases, 20% share in the long term (>5 years) yields a total of about 258 million users. That's equivalent to a 7x increase. Put another way, a 5x increase yields a market share of 14%.

    Note that these are "penetration" figures or share of available users. This is in contrast to share of units sold in a given quarter. Apple has maintained 20% share of smartphones fairly consistently. If share of units sold in any given time period remains at or above 20% and if smartphones and 3G networks become ubiquitous then reasonable men might consider these targets obtainable.

  9. The value of the OS X monopoly

    Research · 39 comments

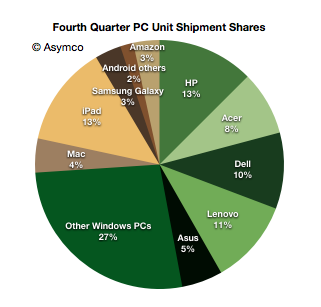
    In January I noted that there were more iPads sold by Apple than PCs from HP, the largest PC vendor in the fourth quarter. Including all tablets, this is the distribution of market shares by units shipped.

    Note the different color palettes for Windows and non-Windows.

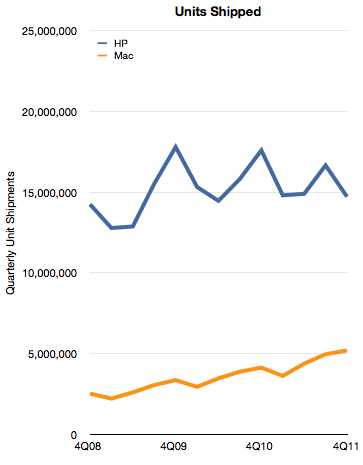
    By the metric of tablets+PC's Apple appears to be the leading vendor. However, if we consider only the Mac, Apple is still well behind. The historic unit volumes of the two is shown below:

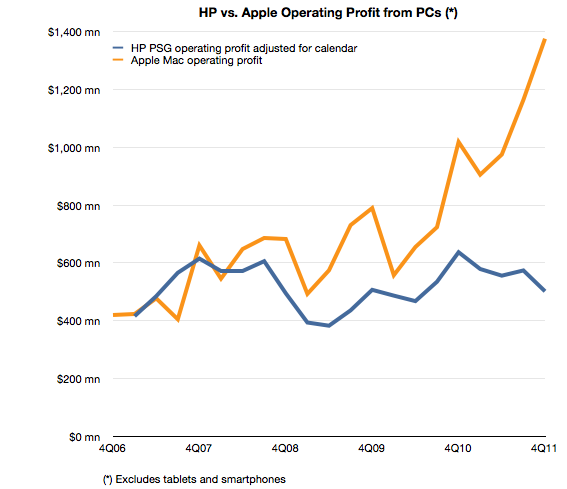
    Although Apple has nearly doubled its shipment volumes since 2008, it's still only one third that of HP. In addition to comparing volumes, we can also measure profitability. In this case HP's PSG (Personal Systems Group) reports operating profits and we can estimate the same from Apple based on a gross margin estimate and an operating expense estimate (as percent of sales).

    The comparison looks like this:

    The operating profit for Apple is 2.7 times higher from a third the units. This gap is a result of a vast difference in profitability. HP's operating margin for PCs is 5% while Apple's is 21%.

    A few days ago I highlighted that Apple's iPhone yields disproportionate profits because of the way it performs the jobs its hired to do by consumers and operators.

    With the Mac the story is that Apple's OS X is primarily responsible for delivering quadruple hardware margins vis-a-vis the most successful PC vendor.

    Both iPhones and Macs are sold as hardware products and the entire econometric analysis of Apple depends on hardware cost structures. This is because hardware lends itself to easy measurement. However, a casual observer would be stumped by a comparison with competitors which cannot come near the profitability Apple enjoys. How can the same bundle of components (admittedly mostly off-the-shelf) be sold at triple the margins?

    It comes down to software. Apple has a monopoly on iOS and OS X and charges for it through its hardware. That's a very valuable monopoly. It's worth at least $1 billion per quarter.

  10. iPhone sine qua non

    Research · 81 comments

    Last week I made an attempt to measure the iPhone's manufacturing cost given new data points from the Foxconn field trip. The post generated a great amount of new knowledge and the feedback was very valuable.

    The main value to me came from stepping back and looking at the entire cost and value structure for the iPhone. Putting costs into perspective is as valuable as knowing what they are.

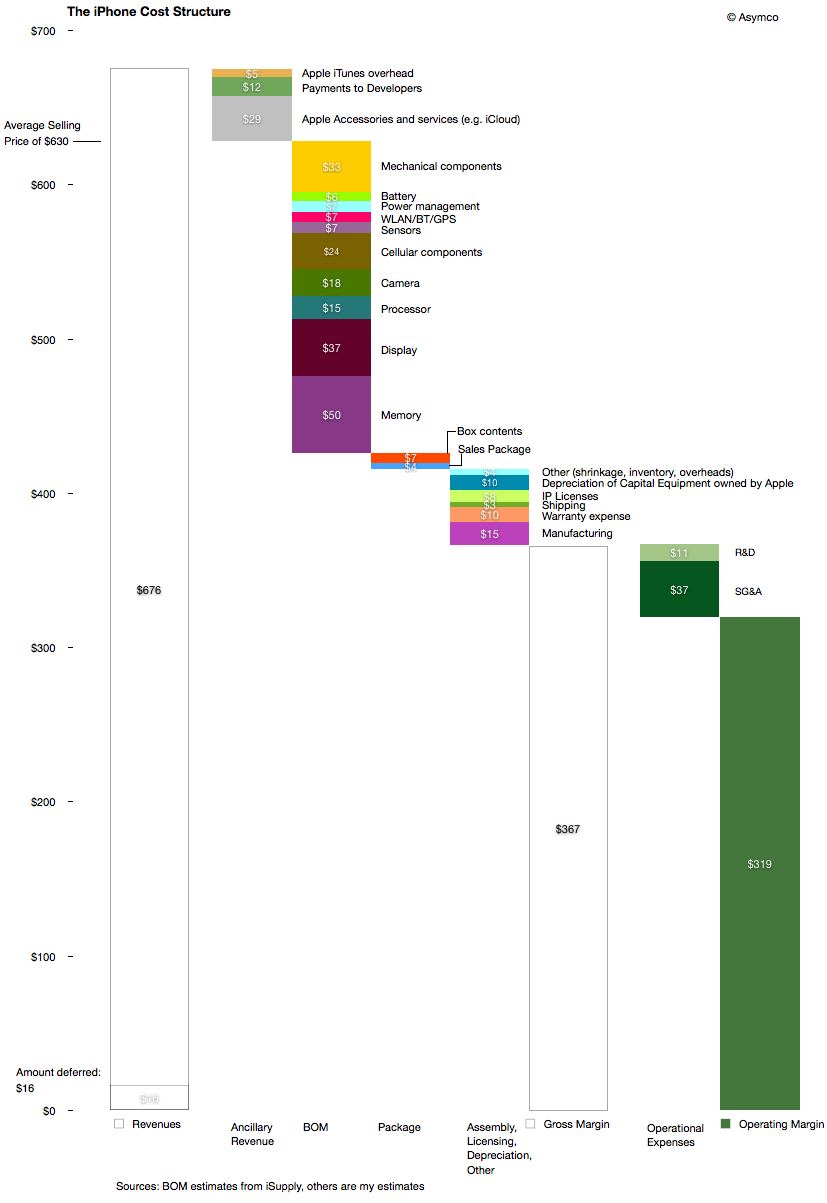
    The following diagram shows my estimates for this cost structure for the fourth quarter given both bill of materials estimates and the other parts of the cost of goods sold and operational expenses and even ancillary sources of revenue.

    Source for BOM estimate: iSupply.

    There are several observations easily made from this view:

    1. The manufacturing cost ($15 may be very generous i.e. high) but it still amounts to a tiny fraction of the device cost and hence value-add. The direct labor part of that cost is tinier still.
    2. Depreciation on capital equipment (Apple owned) amounts to $10 per device, probably higher than the direct labor cost.
    3. External developers as a group receive more app income than the salaries and costs associated with Apple's own developers working on the product.
    4. The gross margin percent is 58%.
    5. The operating margin is estimated at 51%

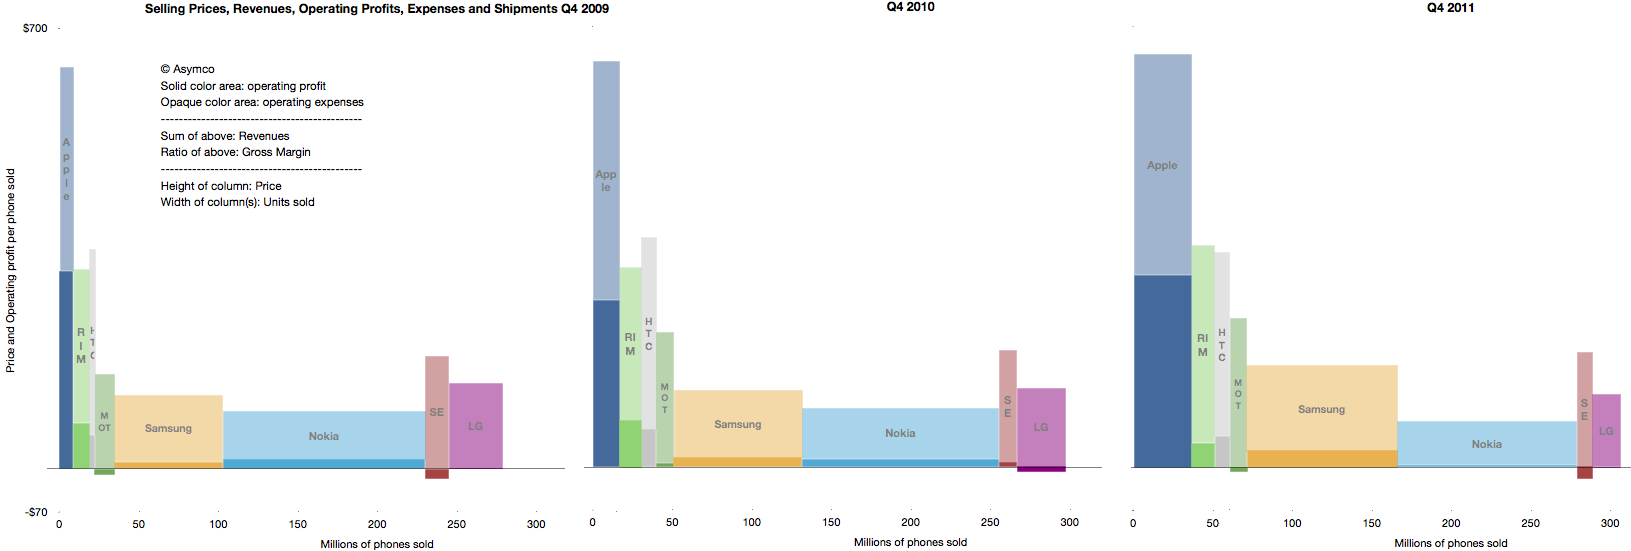
    The high margin that the product generates is even more surprising given the industry average as seen in this summary view of the industry's performance over three years' fourth quarters.

    The operating margin is the ratio of solid colors to the entire bar.

    As someone pointed out on twitter: one of these is not like the others.

    The question should be: How is this possible? What does this product have that gives it such a pricing advantage? Note the the ratio was preserved through the three years shown and has persisted for nearly five years.

    The answer to this paradox is in data that is not visible in any of the diagrams above: The largest revenue attached to the iPhone comes into the mobile network operators. We don't have global averages but the revenue the iPhone generates over its lifetime is probably two to three times the revenues that Apple directly receives. The ARPU iPhones are attached to allows for a substantial subsidy, but more importantly, loyalty (or churn)

    As seen in the small but clearly visible US market, being an operator having  iPhone exclusivity generates above-average growth and being the only operator to be excluded from the product generates above average subscriber losses.

    It quickly becomes obvious that ranging the iPhone has moved from being an advantage to not doing so becoming a serious disadvantage. The product and its high up-front costs are "hygiene factors" for operators. The sine qua non status means that it can still be priced with the extraordinary built-in margin shown above.

  11. The opportunity cost of Windows Phone

    Research · 69 comments

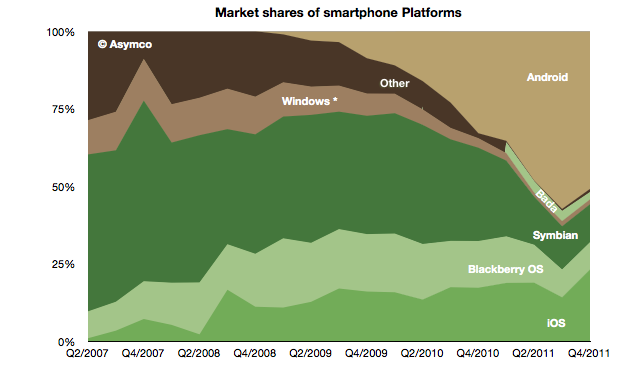
    The global mobile OS market shares for Q4 shows a continuing (but diminished) leading share.

    At the end of last year Android's unit share reached 51% which is down from about 57% during the third quarter. iOS reached 23%, followed by Symbian at 12%, RIM at 9%, Bada at 2.4%, Windows Phone at 1.6% and Other at 1%.

    When seen on a year/year basis Android gained 18 points of share in Q4 while Symbian lost 18 points. iOS gained 6 points of share and RIM lost 6 points. Bada gained 2.5 points and Windows lost 1.5 points.

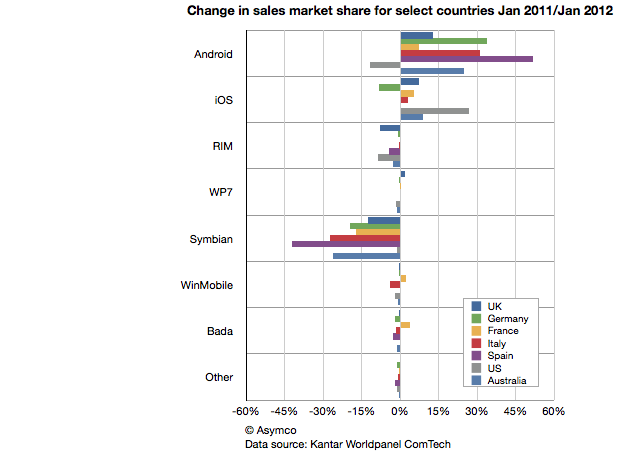
    This symmetry can also be observed in another set of data. Published in The Guardian Kantar Worldpanel ComTech data shows the OS share changes for January on a year/year basis for a select set of countries.

    Android share gains do seem to be mirrored by Symbian share losses on a country-level.

    This should be most interesting to Nokia and Microsoft as both have a lot riding on Windows Phone replacing Symbian sales. If there should be a recovery in the fortunes of these companies, it would seem that their strategies should focus primarily on stemming and then reversing the losses to Android.

    Microsoft's strategy of increasing the cost structure for Android through IP licensing is certainly part of this picture but it's a slow process to turn that disincentive for Android into a large incentive for Windows Phone.

    Indeed, the speed with which Android handsets can be developed seems to be a key value of that operating system and one for which Microsoft does not have a good answer.  Nokia is now one year into its commitment to the Microsoft platform and it has a very limited portfolio to show for it (and limited sales as well.) As a result, Nokia's Symbian business evaporated very rapidly. More rapidly than the company anticipated.

    The dilemma for other vendors may well be how long will it take for them to develop a replacement for their Android portfolio in Windows Phone.

    The opportunity cost of this switch is subtle and insidious but may be the root of why we don't see a stampede toward Microsoft. Conversely, Android contract-free, implement-at-will availability may be its greatest selling point.