Asymco

Asymmetric Intelligence

Market

  1. Smartphone users still prefer branded phones

    Research · 23 comments

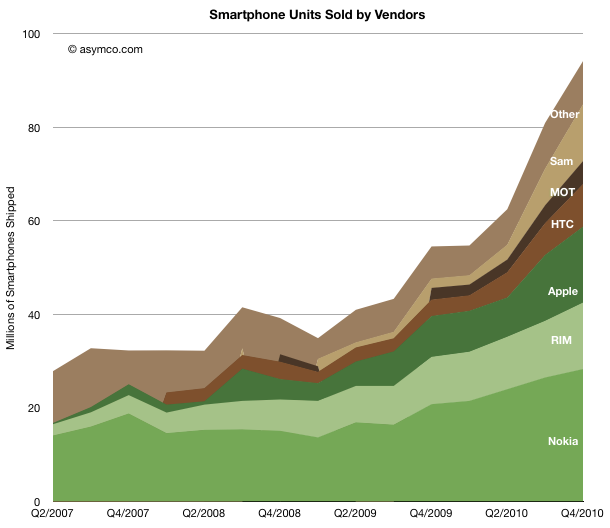
    The smartphone market has grown threefold in the span of three years. However, as noted previously, the share of units running a licensed OS has not grown dramatically. The following chart shows the vendors' shares with the same brown/green dichotomy between licensed and unlicensed OS's.
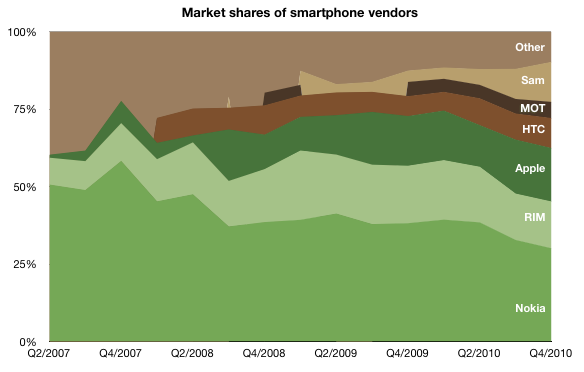
    In order to gain some insight into this licensed OS area (and who the "others" are) we need some visibility into which OSs are being licensed and what their shares are.

    The following chart shows the share of the various licensed platforms[1]. (I blanked out the Integrated vendors.)
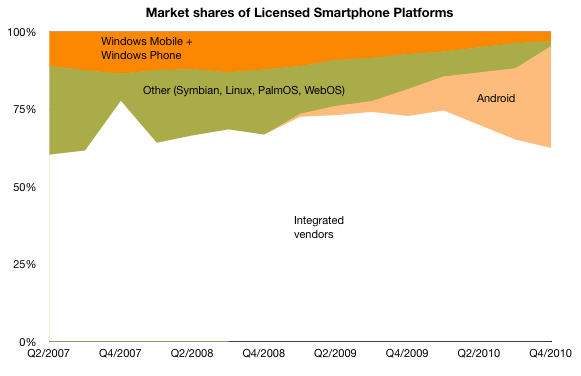
    Before we dive in to understand the effect of Android, we have to understand the licensing of OSs in 2007.

    The chart shows Windows Mobile and "Other" splitting the market. Windows Mobile is rather easy to understand. It was still growing as a platform and Ballmer was famously quoted in 2007 as saying he liked their strategy "a lot".

    But "Other" is something of a mystery. What "Other" actually mostly meant was Symbian[2]. But not only the Symbian that Nokia was shipping and licensing to some vendors. At the time, Symbian also had a version called MOAP "Mobile Oriented Applications Platform" which was in use in Japan (somewhat analogous to the variants of Android now in use in China).

    Fujitsu, Mitsubishi, Sony Ericsson and Sharp developed phones for NTT DoCoMo, using an interface developed specifically for DoCoMo's FOMA "Freedom of Mobile Access" network brand. This UI platform was based on the UI from earlier Fujitsu FOMA models[3]. The user could not install new C++ applications and therefore these were not platform devices, however the industry still included these units as "smartphones" .

    So what we've witnessed in the last two to three years is the replacement of MOAP and Windows Mobile share with Android TAPAS and OMS.[4]

    But, more significantly, when looking at the rise of Samsung and Motorola and HTC we were also witnessing the demise of Palm, Fujitsu, Mitsubishi and Sharp (plus a myriad of Windows Mobile licensees even larger than the Android army).

    The significance here is that "other" in smartphones is still mostly about branded vendors. This is in stark contrast to the low-end of the phone market where “others” are quickly replacing branded vendors.

    So we can conclude that the smartphone market is so far showing a distinct preference for branded vendors. The value of the brand is still evident. But ZTE and Huawei are quickly developing Android competencies. How long will it be before the branded vendors feel the pressure from the upstarts?

    ----

    Notes:

    1. The Other category includes WebOS which was not licensed during this time frame but is not material enough in terms of share.
    2. A few million units running flavors of Linux were also on the market in 2007/2008.
    3. FOMA was also implemented with a Linux OS and the same UI.
    4. It should be noted that except for Windows Mobile, all the licensed mobile OSs including LiMO and Symbian are now open source. Android's success is not therefore due to being the only OS that is "open".
  2. Comparing Share of Growth: Integrated smartphone vendors held their own in Q4

    Research · 24 comments

    The smartphone market grew to about 100 million units last quarter. That's nearly double what it was a year earlier and triple what it was three years earlier, the year the iPhone made its debut.

    Few markets grow this quickly, especially as this tripling happened during one of the worst recessions for a century. 100 million units a quarter is not a small number. The rate at which smartphones are growing makes clear the trajectory of where all phones are going.

    As I've shown in profitability charts, vendors have been benefiting to differing degrees. The overall smartphone market with individual vendors is shown below:

    I've used the color coding of shades of green for vendors which use their own operating systems and shades of brown for vendors which use a licensed operating system (licensees).

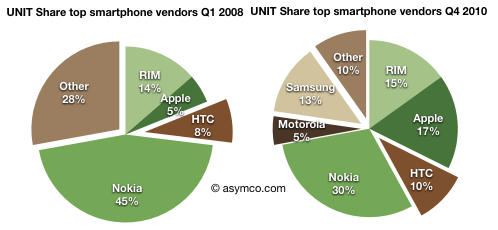
    What remains interesting is how the share of licensed OS products has changed since 2007. I selected two snapshots in time: Q1 2008 and Q4 2010 and compared the shares that licensees were able to obtain.

    The shares of licensees was then 36%, and is now 38%. Not a huge increase, but an increase nevertheless. In the last such analysis in Q3, the share of these vendors (which I also call "Modular") was actually lower than in early 2008.

    RIM has held steady in terms of share. HTC has added a few points of share. Apple seems to have gained a healthy share which Nokia seems to have lost. Samsung and Motorola have certainly made a bigger mark in the last few quarters.

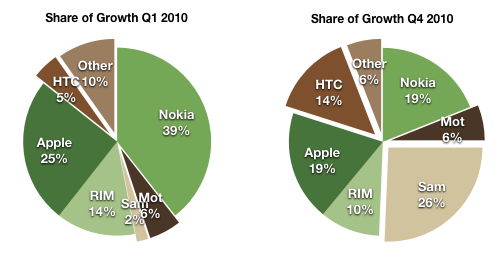
    But I would caution that share comparisons when the market is growing at nearly 100% are not very meaningful. All vendors are increasing their sales, though a different rates. What would be more meaningful would be a "share of growth" measure where each vendor's increase in units is divided by the overall market's increase.

    That analysis gives us the following chart. (I added Q1 2010 for comparison).

    Samsung did very well, but surprisingly perhaps, so did Nokia, tying Apple for second place.

    The licensees (whose pie slices have been exploded) added up to 52% of total growth (y/y) and the integrated vendors had 48%. A pretty even split.

  3. Stephen Elop's ecosystem messages

    Research · 66 comments

    Yesterday I made my predictions on Nokia's new platform strategy. They should  be treated as pure guesswork, but they are informed guesses. I based them on public information.

    That information comes in the form of statements from Nokia's CEO at the earnings call. I made a table of all the statements that dealt with platform decisions and my interpretations of those statements.

    You may do your own interpretation, but to me there is significant evidence here to support my predictions.

    What Elop SaidMy interpretation
    In certain markets where there’s a greater preponderance of competing platform devices, we have some competitiveness problemsWe have problems in the US
    Broadly the conversation about operating system and positioning of relative operating systems in different places is something that we'll reserve for the February 11th meeting,Different markets require different operating systems
    The general comment I’d like to make though is that in today’s world it is the case that given the different price performance characteristics of different chipsets, we get into situations, where the best experiences are not necessarily delivered by systems that are capable of delivering the highest end experiences. We have to be very mindful at what level of the price curve we deliver what type of device with what operating system.Different price points require different operating systems
    When I think about geographies, the area, I've mentioned this indirectly during my comments, but I'll be more precise in answering your question and that is clearly, there is a pattern of disappointments in the United States. A pattern there where efforts have been made, competitiveness, challenges exist and we very much need to address thoseWe have problems in the US. We're going to address these.
    That's why I characterize very clearly in the framework for the decision making ahead, that whatever the strategy is that we outline on February 11th, we very clearly will be ensuring that it gives us the opportunity to reopen doors in markets such as the US and some others where we have not recently been presentWe are going to enter the US with this platform
    With respect to the question of ecosystems and so forth, it's important to note, in my opening comments, I referenced the fact that there are today different ecosystems and different patterns at playDifferent OS for different markets
    If you like the high-end ecosystems where there is particular rate of momentum and share gain taking place. At the same time, the dynamics at the very low end of market which itself is an ecosystem of sorts, is very different with very different demands and expectationsHigh end and low end require different OS
    I'll just offer that observation that today broadly in the world without any specific comment on us or our competitors, there are multiple ecosystem patterns that need to be consideredMore on the need for multiple OS
    I'd also point out that very critical in whatever combination of ecosystem or ecosystems or whatever our strategy outlines, the need to maintain sustainable differentiation between ecosystems and within the ecosystem relative to our competitors in that ecosystem is a top priority. In everything we consider, that’s something that will be very much on our mind.What we chose gives us some degree of differentiation--It's possible concessions were negotiated
    With respect to comparisons to other ecosystem shifts and things like that, the real thing that one must focus on is the quality of products in the market, the momentum that one already hasSymbian is not going to disappear
    As we’ve described the Symbian momentum that we have today; a consideration of shift of ecosystem, certainly you have to consider that potential of market share changesSymbian will lose share
    With respect to the ecosystem comment, without getting into specifics of different options and things like that in detail, what I will say is that the word catalyze is to imply that there is a wide variety of participants in our world, and that includes competitors, it includes operators, other technology firms and so forth who in many respects have a common interest relative to the potential strength of other ecosystems and how they may develop over timePartner is a tech firm that has common interest -- i.e. market entry
    The catalyst of an ecosystem could be considered as making sure the right conditions are formed in the right companies, work in such a way that alternatives emerge in a marketplace that may not exist todayLooking at growing the market for the partner-- Microsoft
    We made a decision to not proceed as people have thought we would proceedThis is not going to be business as usual
    You'll see that pattern of decision making from us in terms of being very crisp about what constitutes great experiences and ensuring that that is what we are delivering to our customers.This is a marketing-led effort. We're going to stay on message and not waffle on about technology
  4. iPhone and iPad: Fine Young Cannibals?

    Research · 35 comments

    The iPad and iPhone came, saw and conquered new markets. But since the products launched the question on every analyst's mind has been on how much have these products "cannibalized" their brethren the iPod and the Mac.

    This notion of "cannibalization" applies when a product is designed to compete and "eat" the share of another product in a company's portfolio. It has some negative connotations since it implies loss but many times the thinking is that it's better to cannibalize oneself rather than have it done by a competitor.

    But have iPhone and iPad taken share from their competitors?

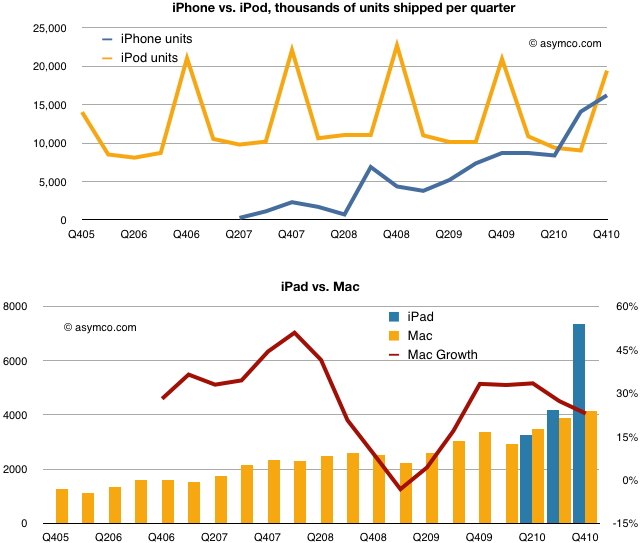
    The following charts compare the total units of iPhones vs. iPods and iPads and iPads vs. Macs.

    The evidence does not show cannibalization.

    Although both iPhone and iPad have crossed over and are selling more units than their internal competitors, the old guard has not faded away.

    Indeed, the Mac shows resilience and the iPod, although not growing in units has maintained sales value. What we don't see is a clear gain for the entrants at the expense of the incumbents.

    We can't be sure how long this happy co-habitation will last, but for now the new products are fine and young but not cannibals.

  5. How does the Mac gain share while increasing its price premium over the Windows PC?

    Research · 54 comments

    Apple set a new record for Mac sales in the fourth quarter. This was not a surprise. The growth was perhaps a bit lower than some expected (including me) but it was still a healthy 23% and 8x the PC growth rate. The Mac has outgrown the PC (and hence has gained share) for 19 quarters straight, nearly five years.

    What's more interesting is where the growth came from. Every region outgrew the market. Asia-Pacific led with a 67% year-over-year increase, almost 10x the market. Japan grew at 56%, which is about 6x the market, and Europe and the United States both grew in double-digits despite both markets contracting overall.

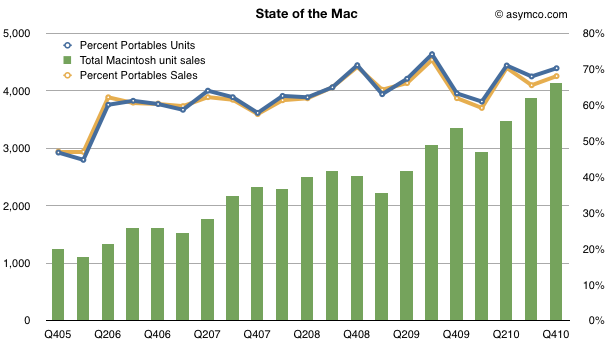
    Looking over a longer time frame, the Mac has nearly quadrupled in volume in five years. In the last quarter of 2005, Apple sold 1.2 million units. In the latest quarter it sold 4.1 million. So the performance has been relatively good.

    One significant reason for the growth has been the shift from desktop to portables. The lines show how the percent of portables went from about 50% to 70% of units and sales in four years.

    [hang1column]

    [/hang1column]

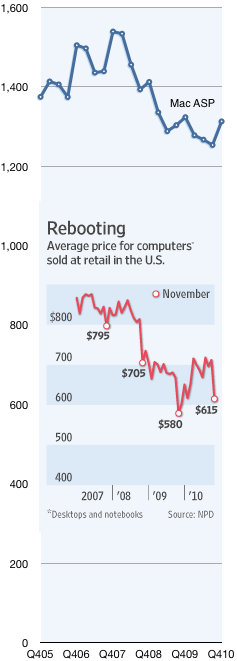
    But what was surprising was that the average selling price increased to $1,313, up from $1,253 and nearly even with last year's $1,324.

    Prices in the PC industry tend to fall. Actually, to be more precise, they tend to collapse. Compare the Mac's price trend with the rest of the industry as seen in the chart to the left[1]. It shows the Mac Average Selling Price which is what Apple books from selling into the channel vs. the retail price of PCs in the US.

    The chart tells a partial story. The PC figures are retail while the Mac figures are wholesale. Furthermore, the PC figures include Mac, so stripping out the Mac would show the PC prices to be even lower. Lastly the Mac figures are global whereas the PC figures are US only.

    But what I want to focus on is not the absolute difference, rather the relative value difference, which is diverging: The average PC went from $795 retail at the end of 2007 to $615 in November 2010. That's a drop of 22%. In the same time frame the Mac went from $1,539 to $1,313 wholesale, a drop of 15%.

    In other words, the Mac price premium at the end of 2007 was at least 93% and it now is at least 114%.

    So here's the real surprise: How does the Mac gain share while increasing its price premium over the PC?

    The only answer I can offer is what I already wrote on the Mac in November:

    ...something changed with PCs when the laptop became “good enough”. With portable computing, the job the PC was hired to do evolved. It was more important that the product be well designed (for aesthetic value, usability and reliability) than just fast and spacious. The microprocessors were plenty fast but what mattered more was low power consumption, a low profile and tighter integration with software.

    In other words, computers became re-integrated. You only need to touch the MacBook Air to understand why.

    ----

    Notes:

    1. The inset chart comes from The Wall Street Journal using data from NPD. The Mac data comes from Apple financial reports.
  6. The end of exclusivity doesn't change the price operators pay for the iPhone

    Research · 55 comments

    AT&T does not pay a higher price for iPhone exclusivity | asymco.

    At the risk of repetition, there are three instances in conference calls that Apple management has stated that the iPhone has a fixed price for all operators and resellers.

    The first was in October 20, 2009:

    “So when you go from exclusive to multiple, you don’t change the charge to the carrier?”

    Cook answered: “Correct.”

    The second was a year later, October 18, 2010:

    Chris Whitmore – Deutsche Bank:  And what is your experience then when you’ve gone non-exclusive from a subsidy and margin standpoint on the phone, have you had to give anything up in the past?

    Tim Cook: We don’t give specific information out on the margins. But I think you can look at our ASPs and see that they’ve generally stayed above $600, and that’s despite opening up several markets from an exclusive market to a non-exclusive market.

    And the third was a few days ago on January 8, 2011:

    Toni Sacconaghi - Bernstein Research:  You've said on previous earnings calls that the move to iPhone non-exclusivity in regions of the world has had no impact on your ASPs. Can you comment on whether that is it still the case today and whether we should expect any impact in the migration away from U.S. exclusivity?

    Timothy Cook: I don't envision the overall iPhone ASP decreasing from the December quarter that we just completed to the March quarter that we're currently in.

    But, as always, we can confirm and validate using the data on pricing we have available.

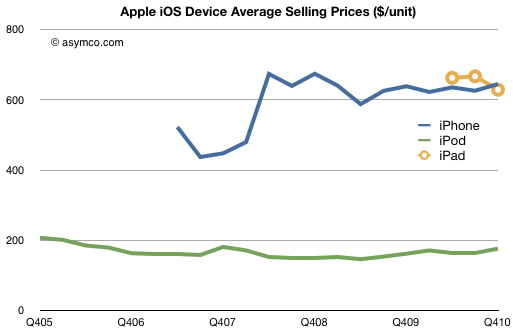
    In this case in the financial reports (take iPhone revenue and divide by units sold):

    You can see that after the first iPhone "2G" which had a peculiar pricing that included revenue sharing with the operator and which showed up differently in the accounting, the iPhone has had a steady price slightly above $600 for over two years[1].

    This is despite having more than 60% sales outside the US and being non-exclusive multi-operator in many countries. Despite being available locked, unlocked and everything in-between.

    We can even confirm what one particular operator paid exactly. In October 2008 AT&T reported that they had paid $900 million for 2.4 million iPhones. That's $375 per phone. Assuming a mix of $199 and $299 3G phones that gives something around $600--below the global ASP for that quarter of about $676. Here exclusivity would imply a discount to average price! The reason for the discount is most likely volume as AT&T was by far the largest buyer of iPhones globally.

    Still unconvinced? Try shopping for an unlocked iPhone at any of various retail locations where it's available unlocked. Accounting for VAT or other taxation, the price is always the same and is a slight mark-up to the operator ASP due to retail margins.

    Judging from comments on this site, the myth that loss of exclusivity in the US will change profit margins for Apple still persists no matter how many times I repeat this story.

    -----

    Notes:

    1. The steadiness of the price should give another huge clue as to the effect of competition on the product.
  7. How exclusivity distorted the US smartphone market

    Research · 69 comments

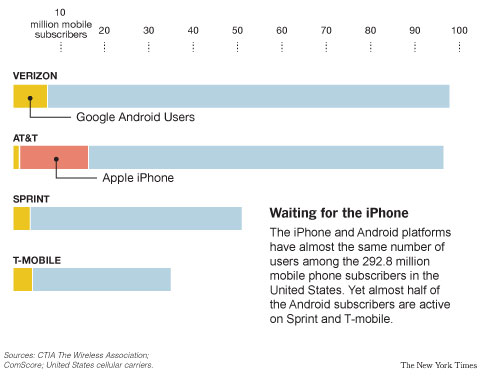
    Here's a wonderful chart from The New York Times:

    Will Apple Put the iPhone on Other Carriers? - NYTimes.com.

    Although the population of Android users is near in size to the population of iPhone users, the concentration in one carrier shows how distribution agreements hamstring platform choice.

    The chart also shows how the iPhone had a huge effect on smartphone adoption at AT&T and how it sucked the oxygen out of the segment for competitors.

    It is possible that we'll see more Android at AT&T and a lot more iPhone everywhere else, but on balance, the chart shows how exclusivity distorted the market.

    It sounded like Tim Cook was really relieved to announce in the earnings conference call that:

    We are not under a contractual exclusivity now in any country in the world. The last one was the United States. We have moved away from those.

    ...

    What I've said before and we have seen this in every case, literally, that we've done, is where we've moved from an exclusive carrier arrangement to a dual- or multi-carrier arrangement, our growth has changed significantly and our market share has increased.

  8. Unforeseeable growth: Analyst failure on iPad as indicator of disruptive change

    Research · 156 comments

    Professional analysts' first year iPad unit forecasts (sourced from TMO Finance Board)

    • Brian Marshall, Broadpoint AmTech   7.0
    • David Bailey, Goldman Sachs           6.2
    • Kathryn Huberty, Morgan Stanley     6.0
    • Shaw Wu, Kauffman Bros.              5.0
    • Mike Abramsky, RBC Capital Markets   5.0
    • Gene Munster, Piper Jaffray           3.5
    • Ben Reitzes, Barclays Capital           2.9
    • Keith Bachman, BMO Capital         2.5
    • Jeff Fidacaro, Susquehanna           2.1
    • Chris Whitmore, Deutsche Bank       2.0
    • Scott Craig, Merrill Lynch               1.2
    • Peter Misek, Canaccord Adams       1.2
    • Doug Reid, Thomas Weisel             1.1
    • Yair Reiner, Oppenheimer             1.1

    Here are the predictions from Tech Bloggers:

    • Clayton Morris: 9
    • John Gruber: 8
    • Horace Dediu: 6
    • Natali Del Conte: 5
    • Ross Rubin: 5
    • Mike Rose: 4.5-5
    • Jason Snell: 3
    • Andy Ihnatko: 3

    Apple sold 14.8 million iPads in 2010.

    I sometimes use the phrase "unforeseeable growth" to describe the kind of growth that not even the most knowledgeable observers of a market can predict. It's usually an indicator that fundamentally transformational change is taking place.

    It's not a sufficient condition, but it's clear that "nobody saw it coming" is a common refrain when disruptions are seen in the rear-view mirror.

    If analysts, to a man, fail, you can be sure that competitors are no wiser. This collective shrug amounts to the greatest competitive advantage any entrant could ever hope to obtain.

  9. iOS users download about 5 apps every month

    Research · 9 comments

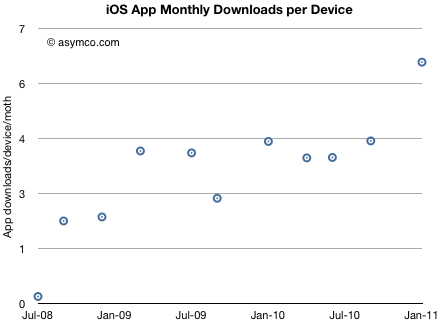
    Thanks to a reader for asking this question: "Wouldn’t it be more telling to look at the monthly rate of downloads / device at any given time?"

    Yes it would.

    Here's what can be derived based on download rates and installed base of devices.

    Please note that I am assuming that the number of devices put out of use is negligible. In defense of this, I would argue that the vast majority of iOS devices sold are still serviceable and are re-sold. However, the estimate should be rounded down.

    The data shows that there's been a slight trend upward in download rate/user but it's been fairly steady.

    The implications are interesting: if you know the number of iOS devices in use, you can determine the app economy turnover with reasonable accuracy. If you also know app ASP, you know sales, and even margin.

    Conversely, if you know the app download rate you can derive the device installed base.

    So in September I looked forward to an iOS user base of 500 million. It could be reached by 2013. Assuming each user downloads 5 apps per month that would mean 2.5 billion downloads per month.

    That's two years away.

  10. How long before apps overtake physical video game content sales?

    Research · 28 comments

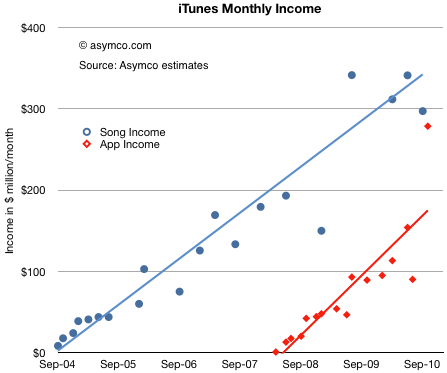
    After reviewing the payments to suppliers, we can look at the store's revenue generation rate. With the same assumptions, we have the following chart:

    We will have to wait for another report to see whether the recent burst of volume from apps is sustained[1], but the trend shows income from apps narrowing the gap to music. In the last few months apps may have been generating $300 million/month[2].

    The blue line above can be interpreted as an arrow aimed at the music industry. We know how that turned out. The red line above can also be interpreted as an arrow aimed at the gaming industry. What are the chances it will play out the same way?

    According to NPD, U.S. retail sales of new physical video game content, which includes portable, console and PC game software, generated revenues of $10.1 billion in 2010. That's $840 million per month. A big number compared to the app business. The trouble is that the figure is going down (-5% from the year before).

    If you look at the red line above and its slope, it would indicate that, given time, the App store will overtake the entire physical media gaming industry. The time when that happens will depend a lot on the growth or decline of the physical game media business, but another four years seems a safe bet.

    Would this cause the same effect to the industry as digital music had when it replaced physical media? I would say yes. The main reason is that physical media has associated with it a different sales cycle and margin. These factors determine the processes and cost structures of incumbents. Such changes are very difficult to absorb and adapt to.

    ----

    Notes:

    1. App sales are highly seasonal as there is a burst of downloads post-holidays.
    2. Apple reports iTunes income in financial reports. In the third quarter it reported $1.2 billion in revenues. This is roughly consistent with the data above given that the analysis excludes iBooks, Movie and TV Show sales and rentals.
  11. iTunes has paid over $2 billion to app developers and $12 billion to record labels

    Research · 13 comments

    The last analysis of the iTunes content store showed amazing acceleration in download rates. Since we know something about the pricing of apps in aggregate, we can make some guesses about the income from apps for both Apple and suppliers.

    The key assumptions are:

    1. Average selling price per app $0.29 (as reported in June 2010 here).
    2. Price per song $.99 increasing to $1.05 over time
    3. Music gross margin 10%
    4. App gross margin 30%

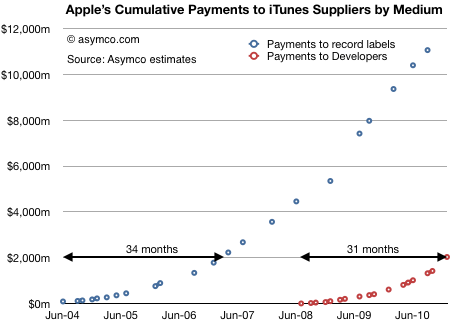
    The first chart shows the accumulated payments made to suppliers of content to the iTunes store over time.

    Although the music suppliers received in aggregate much more than developers, the iTunes store has been open much longer. When comparing sales acceleration, the App store is ramping faster having paid out $2 billion in 31 months vs. 34 months for the first $2 billion paid out for music.

    My guess is that a follow-the-money analysis would show that apps as a medium will absorb talent and capital away from existing mediums and the industries they support.