Asymco

Asymmetric Intelligence

Market

  1. More than 60 apps have been downloaded for every iOS device sold

    Research · 33 comments

    The iTunes App Store is about to reach 10 billion downloads. That makes this a good time to revisit app growth metrics and compare them with the other digital media store that we have data for: the iTunes Music Store.

    First, the download totals as time series[1]:
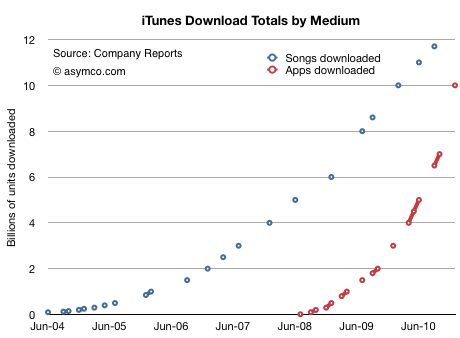
    Assuming that 10 billion will be reached this month, we see how the steepness of the app curve implies that apps will overtake songs within a few months. I suspect by March.

    In September I made the prediction that total apps would overtake total songs sold by the end of 2010. That has not yet happened, but it's close.

    If we measure downloads as a function of the number of months since store launch, we can see that Apps reached 10 billion downloads in less than half the time it took songs (31 vs 67 months.)
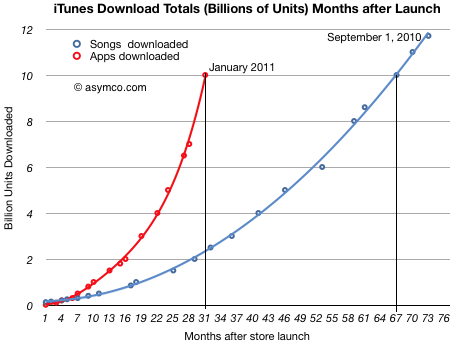
    I used polynomial curve fitting to draw the lines.

    The other way to look at the data is by measuring the daily download rate. The data is more scattered, but the trend is still clear:
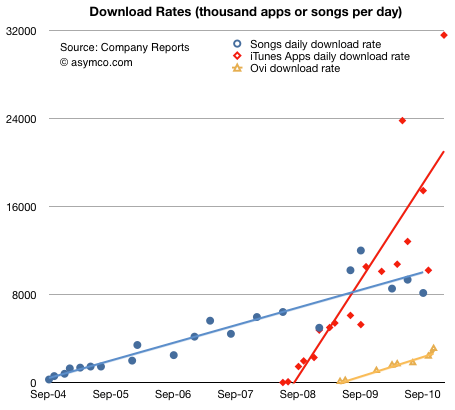
    (The solid lines are linear trendlines. I added the known data from Nokia's Ovi for comparison.)

    The amazing story of this chart is not that apps are running at above 30 million download per day, but that the figure is growing. Growth like this is hard to get one's mind around. Not only are downloads increasing, but the rate of increase is increasing.

    There is one final piece to put in place on this puzzle. Some might argue that the reason these download rates are increasing is because the installed base of devices is increasing at the same rate. In other words, app consumption could be steady on a per user basis.

    To answer this we need to divide the cumulative apps downloaded by the cumulative devices sold. Using a reliable estimate for iPod touch units sold, we can get a pretty clear picture:
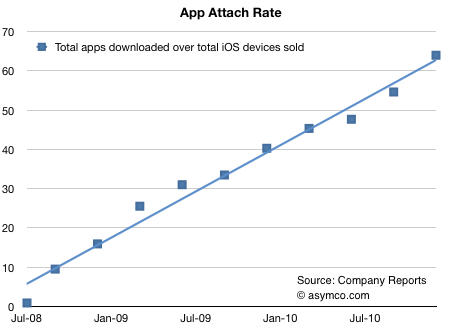
    The number of apps downloaded for iPhone/iPad/iPod touch is running at more than 60[2].

    In the fall of 2008, there were about 10 apps downloaded for every iPhone/iPod touch. Two years later the rate was more than five times higher. There are significant implications for the network effects related to the iOS platform. End user investment in apps is even higher than end user investment in music which created a very tight lock for iPod users.

    I draw three conclusions:

    1. Apps overtaking digital music is a watershed event. Apps are a new medium: they will impact all other media.
    2. As the number of apps attached to any single device continues to increase, apps create increasingly higher switching costs for users.
    3. Apps consumption is increasing at a rate to overtake the PC software market.

    ---

    Notes:

    1. The total apps does not include updates.
    2. The attach rate is actually higher since the figures above assume all devices are still in use.
  2. Is Android more efficient than iOS at generating search revenue?

    Research · 63 comments

    Thanks to David Chu for forwarding the data that made this possible and reader Narajanan for spotting the divergence in platform efficiency.

    iOS and Android are both growing rapidly. According to Gartner, during the first three quarters of 2010, about 44 million iOS devices and 36 million Android devices were put into use. That's 80 million devices. An amazing achievement for two platforms that did not exist 3 years earlier.

    But obviously not all devices are used the same way. Devices which have unused capabilities limit network effects for a platform and for the category of product in general. Question is: how can we measure the "smartness" of a device; how much more likely is a device to be used as a mobile computer vs. being a regular phone?

    The best proxy I can think of is a measurement of browsing use. The smarter the device, the more browsing is a joy and the more it is actually done. Browsing leads to more data load on the network and creates a virtuous circle of revenues for the mobile computing value chain.

    If we could measure the increase in browsing generated by each additional phone, we could compare whether one platform is better (specifically, more efficient) at generating value asymmetric to voice.

    Fortunately we have data from Netmarketshare.com (see sources below) which attempts to track browser consumption and hence allows us to measure this variable. What we need to pair that with is the incremental increase in the installed base of devices.

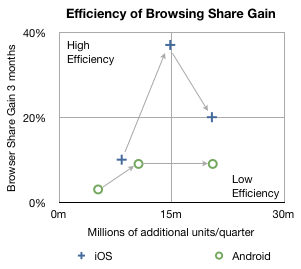
    In the chart below I plotted how much browsing share increased for every phone sold by platform over the first three quarters of 2010.

    The arrows indicate the sequence in time from Q1 to Q3. The vertical axis shows gain in share three months after the corresponding number of units shipped in the previous quarter on the horizontal axis. So, for example, the second circle means that in the second quarter approximately 10 million new Android devices created a gain of about 9% in browsing share. In the same quarter, 14.8 million iOS devices created about 37% gain in browsing share.

    In the third quarter approximately the same number of iOS and Android devices shipped (iOS  including iPads and iPod touch) but the browser gain was 20% for iOS vs. 9% for Android.

    A line drawn diagonally from lower left to upper right (0,0 to 30m,40%) could represent the average gain in share per units sold--the sort of measure we're looking for.

    Measuring that slope tells us that, on average, every million devices sold should generate a gain of 0.75% share[1]. I took the additional step of labeling two quadrants which are orthogonal to the expected trend. If browsing increases dramatically faster than 0.75%/million units then I call those devices sold as creating "highly efficient" browsing gain. If browsing increase lags dramatically below 0.75%/million units then those devices added share with "low efficiency".

    So four data points follow the trendline down the middle of the chart, however, there are two notable outliers. Finding the causes for these outliers gives clues to what's happening with the platforms.

    I believe the explanation for iOS's second quarter's extraordinary efficiency is that was the quarter when the iPad launched. It seems to have yielded a very strong spike and the trajectory of iOS improved even into the next quarter as those iPads continued to be in use. iPad seems to be a very effective way to gain browser share.

    I also believe that the cause for Android's fall in efficiency in the third quarter was that it began to be sold in large quantities in the developing world. The third quarter saw a rapid acceleration of sales without a proportional increase in what was measured as sales in the US (and Europe).

    Interpretation

    If this trend continues, and there is no guarantee that it will, then a question could be raised about Android's value to, of all people, Google.

    The core value of Android to Google is the increased use of browsing and hence search. All the other Google services and in-app ads are tiny opportunities in comparison to the potential of search on mobiles. One could argue that the raison d'être for Android since day one was to create browsing consumption. In that regard it's not as good at doing that as iOS is.

    Perhaps Google can justify the under-performance of consumption of browsing (and hence search) on Android devices as benign since there is no marginal cost added to supplying Android to non-consuming devices.

    But I wonder. There is the problem of opportunity cost: Those iOS devices that create more browsing activity are going to take more share. The more they do that the more Google will have to pay Apple for placement as the default search in mobile Safari.

    It may be a stretch, and perhaps the data is wrong, but that's what this exercise is all about: how much can we learn from fragmentary data? Without a hypothesis there is no discovery.

    -----

    Notes:

    1. Since these platforms have very low shares (less than 2% for iOS and 0.3% for Android by November) almost all the gains can be assumed to be against other browsers (e.g. Internet Explorer) and not against each other.
    2. Update: the original Unit estimates excluded iPad and iPod touch which have since been added.

    Sources:

  3. Big in Denmark: iPhone captures 36% of phone market value

    Research · 35 comments

    Thanks for Rob Marsh for forwarding the following snapshot of data from Denmark:

    Salget af smartphones eksploderer i Danmark.

    According to GfK data in Denmark, during the first quarter of 2010 29% of phones sold were smartphones. In the second quarter, the share grew to 37%. In the third quarter, 51% of units and 71% of sales value was captured by smartphones.

    Looking at September alone, Apple's share of the smartphone market was 34%. In terms of value share, 51% of all the dollars that consumers spent for smartphones, was spent on the iPhone.

    In other words, in September in Denmark, iPhone captured 34%*51% = 17% of all units and 51%*71% = 36% of all mobile phone sales.

    Rob adds:

    iPhone 4 is now available on all (4) major networks in Denmark. iPhone 4 has not been advertised very heavily, whilst Android has received a lot of advertising. My experience travelling on public transport in Greater Copenhagen is that iPhone is everywhere, whilst Android and Blackberry is less prevalent.

    To get a sense of how that compares with the global average, in the third quarter Apple's unit share was only 4.1% while sales share comes to about 17%. Seems like there is plenty of room for growth.

    While Denmark is a small country (population: about 5.5 million) and it's not likely to reflect global patterns, it has been rated the happiest place on Earth.

  4. For every AT&T Android user there are 15 iPhone users: What will be the ratio at Verizon?

    Research · 103 comments

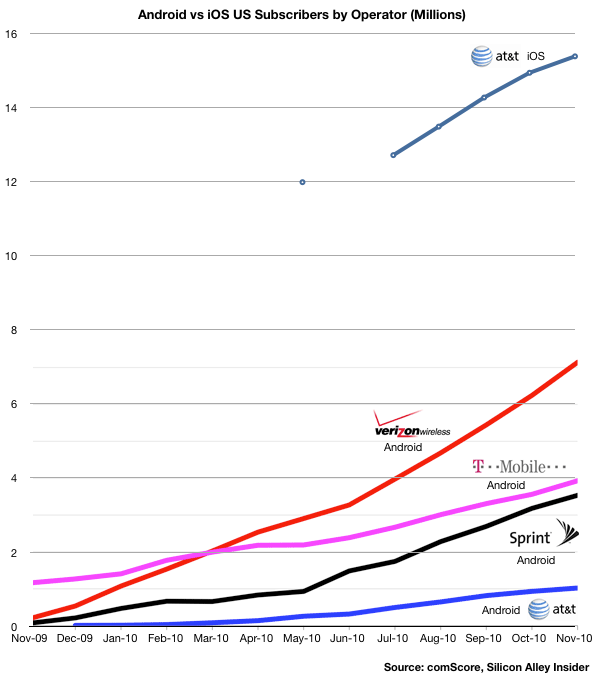
    The following chart uses comScore data to show the relative consumption of Android vs. iOS by the subscribers of the four major US operators. I modified an original chart published by Silicon Alley Insider.

    A few observations:

    • As of November, the ratio of iOS to Android users was more than 15 to 1 at AT&T.
    • iOS at AT&T has twice the users as Android at Verizon
    • Although T-Mobile had the Android franchise to itself for all of 2009, it was overtaken by Verizon within four months
    • T-Mobile Android consumption has also been nearly matched by Sprint within a year

    The rapid eclipse of T-Mobile smartphone penetration makes one wonder how effective Android is as a differentiator for carrier and device vendor alike. It also explains their new pricing model.

    The data also gives clues to how iOS at Verizon will grow.

    Since Verizon and AT&T have nearly the same number of subscribers, excluding RIM ,which is common to both, AT&T has a far larger penetration of smartphones (16.5 million vs. 7 million.) Is the cause iOS itself or the delay with the timing of Android launch at Verizon?

    Other data from comScore shows that much of the gains for Android at Verizon have been at the cost of RIM, so Android has not been entirely additive. Will there be a similar platform switching going on or will iOS be additive to the Android base?

    On one hand, the potential exists for a similar number of touch smartphone users at Verizon as at AT&T (15 million as of November). On the other, Verizon is "half-penetrated" with Android. How many will switch (as they did with RIM) and how many will be new users?

    I'm not going to make any predictions yet but I would not be surprised if Android at Verizon will flatline if not drop while iOS at Verizon will jump quickly to make the sum of both equal to AT&T iOS in about twelve months. That would imply about 10 million new Verizon iOS users by 2012.

    If Verizon users start to switch from Android to iOS, iOS could add as much as 15 million users. It seems that 10 to 13 is a reasonable estimate.

  5. Nearly 75% of iPhones are in use outside the US

    Research · 29 comments

    comScore reported that 15.4 million iPhones were in use in the US as of November. (25% share of 61.5 million total smartphones.)

    We also know that about 75 million iPhones were sold by November since the product launched. With about 17 million units older than two years, and assuming that half of those might still be in use and that all the iPhones less than 2 years old are still in use, we get an upper bound of 66.5 million iPhones in use globally.

    That means 23% of all iPhones are in use in the US and that 77% are in use outside the US.

    Can this be verified?

    The sell-through data we have supports a slightly lower figure.

    October 2010: 63 percent of iPhones were sold outside the US in Q3

    April 2010: Non-US iPhone sales approaching 70% of volumes

    This might indicate that comScore surveys under-represent the iPhone or that device attrition/retirement is significant. However, the data does seem to imply that the US is no more than one third and perhaps as little as one quarter of the iPhone's user base. Perhaps with Verizon, that figure will grow. But at the same time, new international markets (like China) may continue to outgrow the US.

    The 4:1 split could continue. After all, the US represents only 234 million out of about 5 billion mobile phone users globally--a mere 4.7%.

  6. Half of US population to use smartphones by end of 2011: Update

    Research · 10 comments

    Half of US population to use smartphones by end of 2011 | asymco.

    A month ago ComScore reported that in October 2010 25% of Americans above the age of 13 used smartphones. The latest report shows that share to have risen to 26.3%.

    That means there are 24 percentage points of penetration to go until the majority of Americans are smartphone users. In absolute numbers this implies about 56 million additional users (and hence units sold).

    The rate of penetration growth was 1.3 percentage points per month. Assuming no acceleration in this figure and assuming we rely on ComScore (vs. Nielsen which reports higher figures) then majority share is 18 months away, or mid-2012.

    However, assuming some acceleration and a different sampling method, I still believe that we could see this figure by end of this year.

    In either case the tipping point is near.

  7. This is the most exciting CES ever

    Research · 149 comments

    At this year's CES two unthinkable things happened:

    1. The abandonment of Windows exclusivity by practically all of Microsoft's OEM customers.
    2. The abandonment of Intel exclusivity by Microsoft for the next generation of Windows.

    Many of Microsoft's customers chose to use an OS product from Microsoft's arch enemy. Some chose to roll their own. Microsoft, in turn, chose to port its OS to an architecture from Intel's arch enemy.

    These actions confirm the end of the PC era. Although most people would characterize the era as exemplified by a particular form factor or market, for me the definition of that era is the way the value chain was structured and hence how profits were captured.

    That era was marked by the condensation of profits around two companies, Intel and Microsoft, with the simultaneous evaporation of profits from all other participants in the value chain.

    To achieve this, Microsoft maintained a monopoly on the distribution of operating systems and Intel maintained a monopoly as the single supplier of chip architectures for that operating system.

    These monopolies are both over. And they both ended at the same time. And it happened this week.

    Who says CES is boring this year?

  8. [Updated] Samsung's Android Problem

    Research · 53 comments

    [Samsung] said it has sold around 4 million Galaxy S smartphones in North America, 2.5 million in Europe, and around 2 million in South Korea in the past seven months.

    via Samsung Sells 10 Million Galaxy S Android Smartphones - Digital Lifestyle - Macworld UK.

    Samsung's US Android sales are very similarly allocated to Apple's iPhone sales: 40%. But at 20%, South Korea represents a very large portion of their sales (2 million phones sold in 7 months into a country of 48 million). This is understandable given Samsung's distribution power in its home country. However it also implies that Samsung's [high end] Android sales in Asia excluding South Korea are tiny. Only 1.5 million were allocated to outside Europe, US and South Korea--a market that includes the whole of Asia, Africa, Middle East and Latin America.

    If we believe that Android is activated at the rate of 300k units per day, then Samsung represents around 40k of that. (10 million over seven months, linear extrapolation.) So where are those remaining 260k units/day going? Gartner calculated that in Q3 Samsung was the leading Android brand (about one third of all units). The Samsung figures make these share numbers very obsolete because 40k/300k is only 13.3%.

    It's hard to pin down the market because the share shifts are dramatic and the market's growth is not linear. Nevertheless, intuition and guesswork leads to me believe that Android activations are to a large degree (perhaps two thirds) in Asia. This in turn implies that Samsung is not a major participant in that market.

    Since neither LG (who does not have a strong Android portfolio) nor Sony Ericsson or Motorola which have low volumes, (nor obviously Nokia, RIM or Apple) are supplying the Asian Android market, the question is who is? Only HTC remains a contender but it's not big enough to account for the difference and they too are focused on the established Western markets (except for a modest presence in China).

    We are left again with circumstantial evidence that "Other" lower tier vendors are carrying the Android torch in Asia. Pdadb.net shows 277 Android models available. Brands like ZTE, Huawei, Acer, Notion Ink, Linx, TMN, FirsOne, Ziss, Kogan, Highscreen, Saygus, Haier and Forsa are selling Android devices (though not all in Asia).

    Not that there's anything wrong with that

    If there is a worry it is perhaps that Samsung might find it hard to maintain the top spot in supplying Android once the unbranded vendors make it through the distribution obstacle course (as HTC did when it reached 80% of the Windows Mobile share.)

    If one is to argue that Android empowers the desperate incumbents, then one has to also agree that it also empowers the more nimble entrants--inevitably leading to even more desperation.

    [Updated: thanks to reader @UVStaska who noticed on glaring error in the analysis. I had failed to see the "S" in the original quote and been assuming the 10 million figure represented all Samsung Android sales. The Galaxy brand is the Android brand but the "S" model is only one product within the line-up. Samsung Android sales are likely much higher than the 1.5 million I assumed.

    Back to the drawing board with the question of Samsung's strength in Asia. One does still wonder how well they are doing relative to entrants.]

  9. Half of US population to use smartphones by end of 2011

    Research · 35 comments

    60.7 million people in the U.S. owned smartphones during the three months ending in October, up 14 percent from the preceding three month period, representing 1 out of every 4 mobile subscribers.[...] Despite losing share to Android, most smartphone platforms continue to gain subscribers as the smartphone market overall continues to grow.

    via comScore Reports October 2010 U.S. Mobile Subscriber Market Share - comScore, Inc.

    Separately, Nielsen reports on the same market:

    29.7 percent of U.S. mobile subscribers now own smartphones that run full operating systems.

    The most popular smartphones are the Apple iPhone and RIM Blackberry, which are caught in a statistical dead heat with 27 percent of smartphone market share in the U.S. Twenty-two percent of smartphone owners have devices with the Android operating system.

    via U.S. Smartphone Battle Heats Up: Which is the “Most Desired” Operating System? | Nielsen Wire.

    I've been tracking the Nielsen data and using it as a basis for forecasting the penetration of smartphones. While most coverage of this data focuses on splits between current OS platforms, I will look at competition with non-consumption and the impact on operator services.

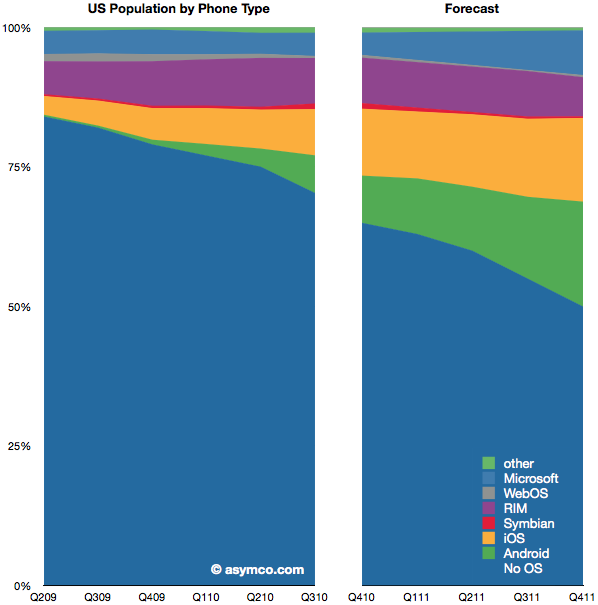
    The chart on the left shows the historic penetration of smartphones since mid-2009 based on Nielsen's reports. The chart on the right is my forecast. This is an update from the last quarter's chart here. My forecast was fairly accurate with respect to platform shares in the last quarter so I've had to make only small adjustments and extended the forecast one quarter further out. [1]

    If my forecast is correct, smartphones will make up 50% of all phones in use by the end of 2011. That's up from nearly 30% today and 18% a year ago.

    One in three of all phones in use will be either iOS or Android. That adds up to about 80 million users; up from 35 million today. Overall, 120 million Americans will be using smartphones.

    Now consider the consequences for how services are delivered by operators. The most popular product operators will be selling will be unlimited data plans. One year hence, by 2012, unlimited data plans may become the largest service revenue generator for mobile operators in the US. Pricing and competition will inevitably be in a state of extreme flux. I leave the consequences to the imagination of the reader.

    ---

    [1] Note that the charts show share of phones in use, not phones sold in a particular point in time. In other words, this is measuring platform consumption, not units sold.

  10. Measuring iPad enterprise use

    Research · 25 comments

    I've noticed that there is a lot of speculation on the prospects for iPad use "in the enterprise". Business users could sure benefit from the device and anecdotal evidence does point to many cases of use in business.

    But anecdotes are not conclusive evidence. How can one make a better guess? Based on reader input, I thought I'd test this hypothesis directly on my own stats.

    As pointed out a recent posting on my stats, the iPad has been a popular device in accessing this site. 102k out of 1.06m views came from iPad users. A statistically interesting number.

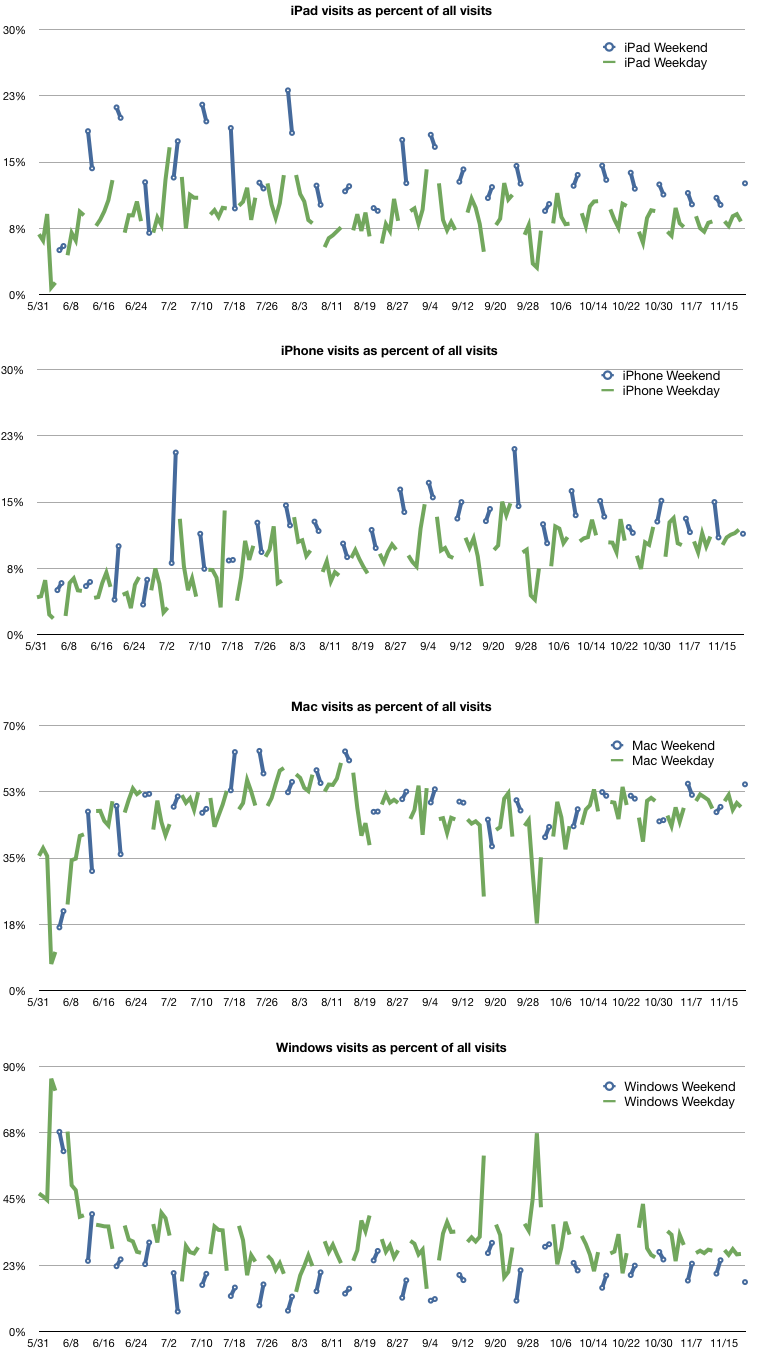
    One way to check enterprise use is to measure the ratio of use of the product during weekends vs. use during weekdays. The logic being that weekend use is almost strictly consumer use and weekday use is mixed. Any normalized significant difference between the two measures should indicate a bias toward consumer use or vice versa.

    The following charts show the percent of each platform's use with weekends separated from weekdays.

    The larger the delta the more likely the more the bias one way or the other. To that end I measured the average percent of visits from iPad (as a total of all visits) for weekends and weekdays and measured the delta between the two. On the weekend the iPad was accounting for 13.3% of visits. On weekdays it was 8.8%. A difference of about 4.5% in favor of weekend use.

    To calibrate that figure I did the same for iPhone, Mac and Windows use.

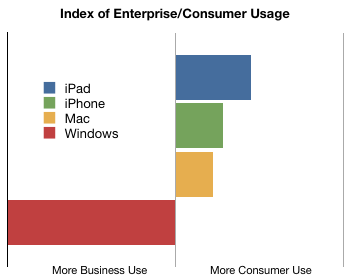
    The following chart shows this ad-hoc index of "enterprise use".

    Essentially the data is inline with assumptions. The iPad is the most likely to be hired by consumers. The iPhone is more than the Mac and they're all far more likely to be consumerized than Windows.

    The average consumption of Asymco.com through Windows was 32% of during weekdays but only 22% during weekends.

    In order to make this measure more meaningful, the evolution over time of these figures should be tracked. If the Blue bar above moves more toward the center then the chances are that iPad will be more adapted by business users, or at least more in use at work.

    Does this seem like a valid method for measuring relative enterprise use?

  11. Did Google Arm Its Own Enemies With Android?

    Research · 42 comments

    James Allworth, a Fellow at the Forum for Growth and Innovation at Harvard Business School writes:

    Baidu,... has taken an even bolder approach. It's reportedly in negotiations with a number of smartphone manufacturers to remove all references to Google, and replace them with Baidu.

    ... Microsoft recently negotiated with Verizon that some of the Android phones that ship to Verizon customers will have Microsoft's Bing, not Google, as the default search engine. And the manufacturers are getting in on the act too: Motorola recently released a new phone, the Citrus, based on Android, but shipping with Bing.

    Yes, it's Google's operating system. In both these instances, it counts as a "win" in the handset volume war against Apple, Microsoft, Nokia and RIM. But Google will not make a cent on this handset, despite having enabled its creation with Android. All the search revenue will flow to Microsoft.

    via Did Google Arm Its Own Enemies With Android? - James Allworth - The Conversation - Harvard Business Review.

    Readers of this blog might find these arguments familiar.

    Since February this year, I wrote four articles under the headline "Google vs. Android" documenting these contradictions in Google's strategy. There have been numerous other opinion pieces that described how Google's approach was not consistent with an innovation-based disruption.

    I've also argued that there is strategic incoherence in building systems software and hardware while selling web services.

    Android is powerful, but as Google is finding out, power can be very dangerous without control.