Asymco

Asymmetric Intelligence

Market

  1. Apple Watch Keeps Top Gift Spot Ahead Of Black Friday

    Research · 1 comment

    The Apple Watch continues to hold the top spot among products that will be hot this holiday season, as predicted by the IBM Trend app.

    Source: Apple Watch Keeps Top Gift Spot Ahead Of Black Friday

    The Apple Watch scored 100 out of 100 on the "IBM Watson Trend Scale". According to various surveys, about 100 million people will shop this Thanksgiving weekend in the US. One wonders how many purchases by 100 million shoppers merit a score of 100/100.

    My estimate for units shipped has been 20 million in the first calendar year. About 7 million have been sold in the first two quarters. That leaves 13 for the holiday and Q1 (which includes Chinese New Year.) I still like these odds.

    To learn more about the reasoning around this estimate and hear additional supporting data, join us at Glance conference.

  2. Why does Apple TV deserve to exist?

    Research · 93 comments

    Since writing Peak Cable six months ago, surveys, research and analysis have contributed to the themes of unbundling the TV package. The data under scrutiny is, as usual, the data that can be gathered. Unfortunately the data that can't be gathered is where the insight into what is happening may lie. For instance, what matters for an entertainer is not how much you're watched but how much you're loved. Measuring love is done poorly with data on payment for subscriptions.

    A better proxy might be time. Liam Boluk makes the point in his post that "focusing on cord cutting or even cord shaving largely misses the point." Don't follow the dollars, he says, follow the time or engagement. "Relevance" is what matters.

    His data shows how linear TV has fallen by roughly 30% among the young (12-34) in the last five years. The trouble for the TV bundle (and advertisers) is that this is the most culturally influential group. They are also the group which will grow into the highest income group over the next decade. And this group does not love TV.

    We have to remember that it was the youth who drove early radio, TV and consumer electronics markets. Those young are now the old which still cling to the old media, served by companies that grew old with them. They are the "high-end" customers with which Nielsen itself has grown. They have the most money to spend and they are the targets for the ads ((no longer the Pepsi generation, they are the Depend and Viagra and pharmaceuticals generation))

    Paying $150/month to watch incontinence and erectile dysfunction ads—at a time not of your choosing—is preposterous for the young. They may like the programs but not the way they are packaged, delivered or interrupted. They are not smarter than their parents. They, like their parents, took to new technology more quickly. What makes the technology new is also what lets its makers separate the content from its delivery. These new technologies allow "modularizing" or unbundling that which was was integrated/bundled and thus allow their developers to focus on the customer's real jobs-to-be-done.

    Unsurprisingly, incumbents have responded by throttling access to original programming–an asset over which they still exert influence as distributors. Netflix and Amazon are taking the path of responding with their own blockbuster productions. Although Silicon Valley has more capital to deploy than Hollywood  this battle of attrition is by no means one that incumbents will win, and generally, it's not going to be pretty.

    Tweaking the nose of the incumbent might not be the way to establish asymmetry. The better tactic may be to help the system survive but offer a "short-term alternative". This is how iTunes took on and won Music. When Napster and file sharing created a clear and present danger to the industry, Apple's approach of a controlled alternative allowed the industry to finally move to a digital download model.

    An observer in 2004 would have said that Apple was bowing to the industry and providing it sustenance against "disruptive" free music. However, as behavior shifted to an overwhelming preference of iTunes downloads over physical media, the music labels found themselves in an untenable negotiating position. They had to concede on DRM, pricing and bundling itself. The music disruption occurred with a tacit acceptance and collaboration by the incumbents.

    Is history repeating? Looking at the situation around TV today, the strategies of the challengers can be summarized in a similar way:

    1. The content low-end: Now, YouTube, Twitch. Then, Napster, Gnutella
    2. The distribution low-end: Now, Netflix, Amazon. Then, incumbent music download sites.
    3. The nominally sustaining: Now Apple TV. Then, iTunes

    Apple cannot play an "ignore me" strategy because as much as investors think the company is irrelevant, everything it does is closely watched by anybody who might be even remotely touched by it. Especially in entertainment.

    In addition, due to brand considerations, the company cannot ship low-quality or no-quality product, including material that sits on its platform.

    They have to do something different. Something more complicated and something that takes much longer.

    What Apple best contributes asymmetrically is a new experience. The experience allows new behavior, new usage models and hence new loyalties to emerge. The loyalties create affinity which shifts the "love interest" for the user. The new Apple TV attempts to provide such a contribution. Not only in terms of the experience but also for becoming, finally, a platform for developers, who will try to make the product itself better in collaboration with Apple. Thus the "new experience" flips when bits which are streamed cohabit a device with bits which expect a consumer response.

    This "appification" becomes an interesting experiment in behavior alteration. Will "couch time" change from pure passivity to partial interaction?

    To the orthodox adherents to the religion of linearity of immersive programming this sounds impossible. But why else should a product deserve to exist? A great product is one which changes the user and for Apple TV to become great it needs to engage us to do something different than we do today. It needs to make us feel we are better for using it.

    Is this new Apple TV up to it? We'll have to wait and see. But then again, if not this one, then another one will. TV will not remain unchanged forever.
  3. Meaningful Contribution

    Research · 37 comments

    What if Apple did make a car? How significant could their products be? What would it take to influence the industry's architecture?

    The global market is forecast to reach 88.6 million vehicles in 2015 and there are many ways to segment it. One could look at geography or at product configurations or the emergence of new powertrain technologies.

    One could also look at the participants.

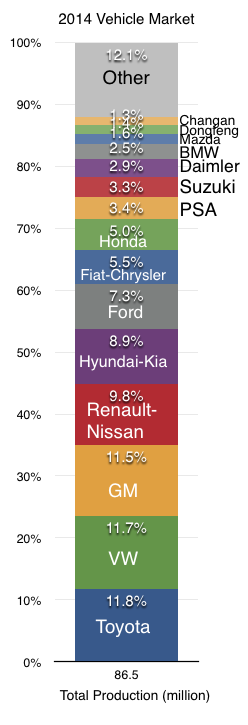
    In 2014 Toyota was the top selling automaker with a total sales volume of 10.23 million vehicles. The following graph shows the leading 15 producers and the percent of total production.

    Screen Shot 2015-09-25 at 9-25-2.19.47 PM


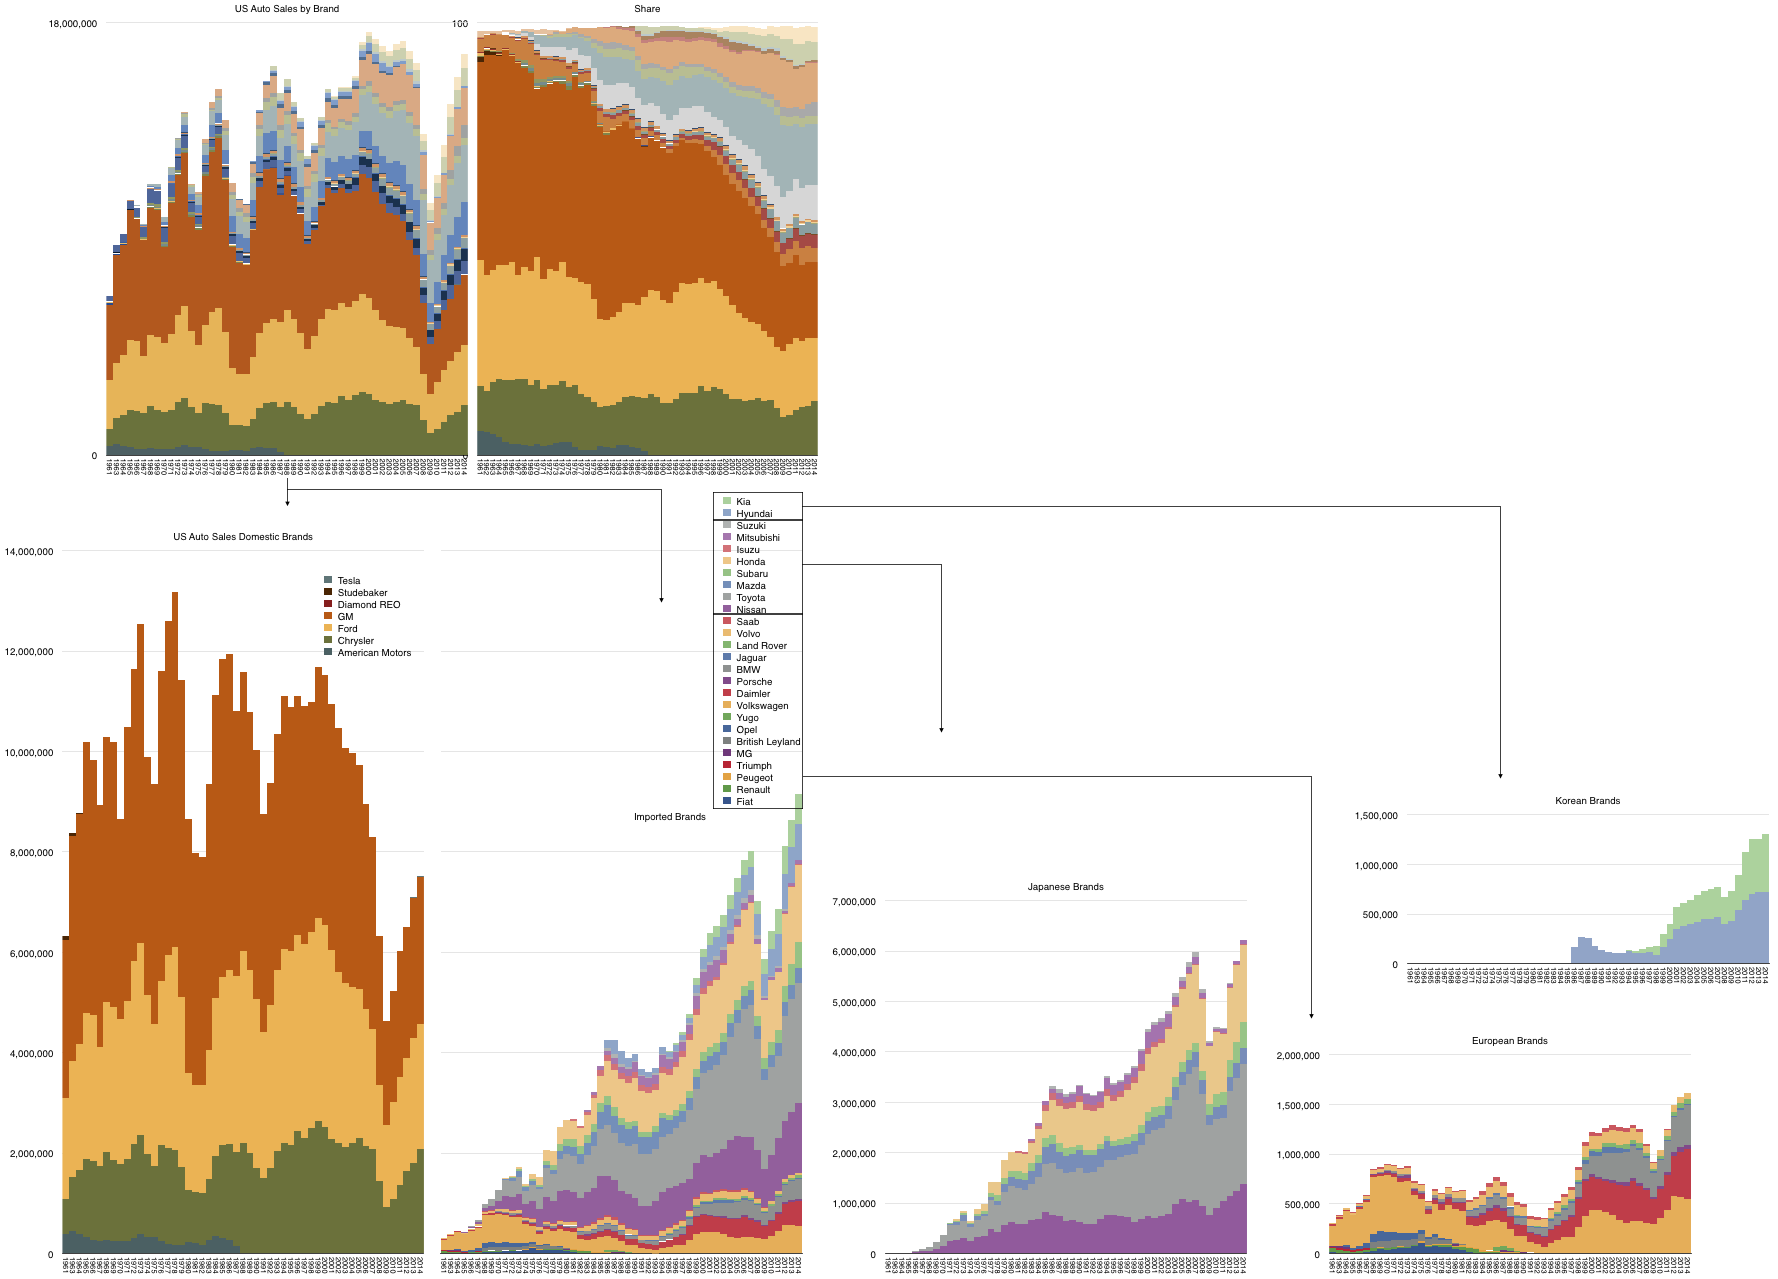
    One thing to note is the relative balance in market share. The top five vendors have volumes in a very similar range (9 to 12 million). Two vendors are at around 5%. Three are at 3%. To preserve this equilibrium the industry undergoes periodic merging and consolidation. Over the last half-century, there has been room for new entrants. Japanese brands entered between the 1960s and 1970s. Korean entries occurred in the 1990s and Chinese in the 2000s.

    Screen Shot 2015-09-25 at 9-25-3.50.46 PM


    Regardless of the entries, the industry has a high degree of centralization. Ownership is often more narrowly controlled through cross-ownership and licensing. French/Japanese, US/Italian/German, Indian/German/UK cross-over ownerships indicate a globalization of financing. Indeed, only a dozen countries account for over 80% of the production (less than 10% of nations produce significant numbers of vehicles).

    This structure is driven by the cost structure of volume production. The production system dictates financing and location and time constraints which underpin all deals. None of the entries (Japan, Korea, China) did much to redefine the core industry architecture (resources, processes or priorities).

    So how could Apple think different?

    First, the model of production could be substituted with a modular approach. This would separate the engine/body/paint/assembly plant into a deeper supplier network where components would be sourced and tooling dependence would be reduced.This speeds up ramps, reduces capital expenditure, increases flexibility, and accelerates the cadence of product evolution. Essentially, the focus would shift away from manufacturing toward design, iteration, customization and experience engineering.

    Second, Apple could change the distribution model. Controlling the relationship with the end user could allow a conversation which will reveal new jobs to be done.

    Third, Apple could affect the vehicle's lifespan and hence the financing/resale and inherent brand promise of car ownership.

    These are fairly obvious business innovations and they are easily foreseen.But are they enough? Would they even "move the needle"?

    To break into the top 10 brands would imply a production volume of at least 2.5 million units (about the same as Daimler ships today.) At 2.65 million and a price of $55k/vehicle Apple's revenues from cars would total about $145 billion. This is roughly the sales value of the iPhone business today. Not bad. Maybe that would satisfy a financial analyst. ((Yeah, right.))

    Even so, would a top 10 rank in shipments change the industry's structure?

    When I first saw the iPhone I knew that nothing would be the same after it and that Apple was poised to dominate the phone business. For the Apple car to do a similar trick in transportation the product itself has to change the perception of what a car is. Today a phone is barely something one speaks into.

    Approaching the operations side of the business with a clean sheet of paper allows a fresh and rational attack on the problem. But to really make a dent in the universe Apple also needs to change the product in ways that re-define what it's good for. And this is supposedly why Apple gets into markets. To make a meaningful contribution.

  4. How quickly will ads disappear from the Internet?

    Research · 32 comments

    I was always bemused by the notion that the Internet was able to exist solely because most users did not know they could install an ad blocker. Like removing Flash, using an Ad blocker was a rebellious act but one which paid off only for early adopters. But like all good ideas, it seemed obvious that this idea would spread.

    What we never know is how quickly diffusion happens. I've observed "no-brainer" technologies or ideas lie unadopted for decades, languishing in perpetual indifference and suddenly, with no apparent cause, flip into ubiquity and inevitability at a vicious rate of adoption.

    Watching this phenomenon for most of my life, I developed a theory of causation. This theory is that for adoption to accelerate there has to be a combination of conformability to the adopter's manifest needs (the pull) combined with a concerted collaboration of producers to promote the solution (the push). Absent either pull or push, adoption of even the brightest and most self-evident ideas drags on.

    Ad blocking offers a real-time example of this phenomenon. On desktop or even laptop computers ads were tolerable and the steps required to naviagate in order to implement effective ((By effective I mean a combination of whitelists and customizations)) blocking were non-trivial. In addition, no platform vendors were keen to promote products which hindered revenues for their most important ecosystem partners.

    Ad blocking as an activity had neither the pull nor the push.

    However—and there's always a however—as browsing moved to mobile devices and as ad networks hijacked the relationships between publisher and consumer, ads became detrimental to the experiences platform vendors depended on to remain competitive. Apple first (and no doubt others soon) chose to enable mobile browsers to load third party content blocking software. This is a hesitant first step. No major promotional effort and only the most obscure setting was enabled (defaulting to off).

    Nevertheless, it's important to see this action as a "push". The bit that flipped was not of the consumer but of the producer. Movement to a new consuming paradigm and the incessant corrosion of the online experience threatened to taint a platform and something had to give.

    Thus the "push" signal was sent and the consumer now has to pick up with a "pull" action. We still have to watch how quickly the pull happens and how network effects of users showing one-another the results will accelerate adoption and whether the push intensifies as the solutions improve.

    But from this first enablement, the ecosystem, network effects, distribution and value chain leverage could cause gates to open and ad blocking reach majority followed by universal adoption. Measuring the ease of switching, the independence of the solution from other frictions and basing the estimate on historic rates, I could imagine internet ads will become largely invisible in less than five years.

    Alternatives will emerge; the written word will find its business model, yet again. But the current model, contemptuous of the reader and disrespecting of the art will not long last.

  5. The new switchers

    Research · 66 comments

    During the last quarterly earnings call, Tim Cook said that Apple has seen the highest switching rate from Android ever. That there is switching isn't surprising. We've seen many surveys which show higher loyalty with iOS than with Android. But it's been very hard to spot the evidence in the data which is visible publicly. Both iOS and Android are adding users and sales for both platforms are still increasing.

    The switching effect is easier to discern when the market is not growing overall. In that situation one platform's growth has to be at the expense of another. However, some markets do show evidence of "churn" in users.

    Screen Shot 2015-08-10 at 8-10-12.52.52 PM

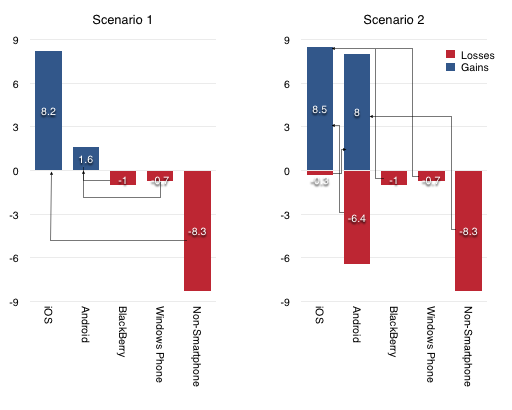
    Consider the ComScore data on US platform users (above). If we look at the last six months' data ((these data are actually three month averages)) we can count that there are about 8.2 million more Americans using iPhones than there were six months ago. At the same time, there are 1.6 million Android users. One million users left the BlackBerry platform and about 700,000 left Windows Mobile. The data also suggests that the total number of first-time smartphone users is about 8.3 million.

    Now, we could say that Android recruited all the Windows and BlackBerry users that switched (1.6 gained equivalent to 1.7 million lost) and Apple recruited all the new-to-smartphone users (8.2 million gained by Apple vs. 8.3 million non-consumers).

    Screen Shot 2015-08-10 at 8-10-12.44.31 PM

    But this is not very plausible. It's much more likely that Apple converts existing smartphone users while Android converts first-time users.

    In this scenario, 8 million non-users first started using Android while 1.7 million BlackBerry and Windows users switched to iPhone. But that leaves the question of what happened to the missing 6.3 million that Apple should have gained.

    That's where the switching number comes into the picture. This Scenario 2 is shown in the figure above and suggests that although Android gained 8 million new users, it lost 6.4 million to iPhone for a net gain of 1.6.

    Apple may have also lost a few users to Android but overall gained switchers from other platforms, mainly Android. This is what would support Tim Cook's comments.

    Thinking further ahead, as the markets mature globally, they may well evolve into the way the US market evolves today. Apple's brand promise ensures loyalty while competing platforms slowly "leak" users. If this sounds eerily familiar then you'd be right. This is exactly how the PC market behaves today.

  6. What next for iPad?

    Research · 81 comments

    ComScore suggests that there are 100 million tablet owners in the US. On a per capita basis that implies penetration of about 30%. As a percent of mobile phone subscribers (above age of 13) that implies 40%. As a percent of smartphone users that implies 43%. As a percent of iPhone users that represents 47%. As a percent of households assuming one device per household that implies 85% penetration. By another measure (Pew) household penetration is around 50%.

    Regardless of the difficulty in defining what is the correct "addressable market", the more important question is whether tablets will be an ubiquitous object. Perhaps what we are seeing in the US is something similar to the MP3 player market or video game console markets where penetration saturated at around 50%. Perhaps tablets will reach PC levels which are closer to 80% of population or perhaps they will reach phone levels which are above 90%. The reason we can't answer the question of ubiquity easily is because competing solutions can carve the usage out of a category "disrupting" it with alternatives.

    The idea that jobs are the segments into which products fit and not demographics or product attributes is key to understanding this migration. The reason phones have subsumed more jobs onto themselves is because they have a rapid rate of evolution and because they have larger scale of economy and because they are conformable to our life spaces. As phones get better they take on more jobs and some of those jobs are those of tablets. The MP3 did not become ubiquitous because the phone took its job. Same for the video game and same perhaps for the PC and tablet.

    But tablets are also getting better. At WWDC we saw how the iPad got a lot better for in terms of multi-tasking, data entry and edits. With the addition of more screen space it will get better still. The improvements will mean that it will possibly be hired for jobs that PCs are still uniquely good at.

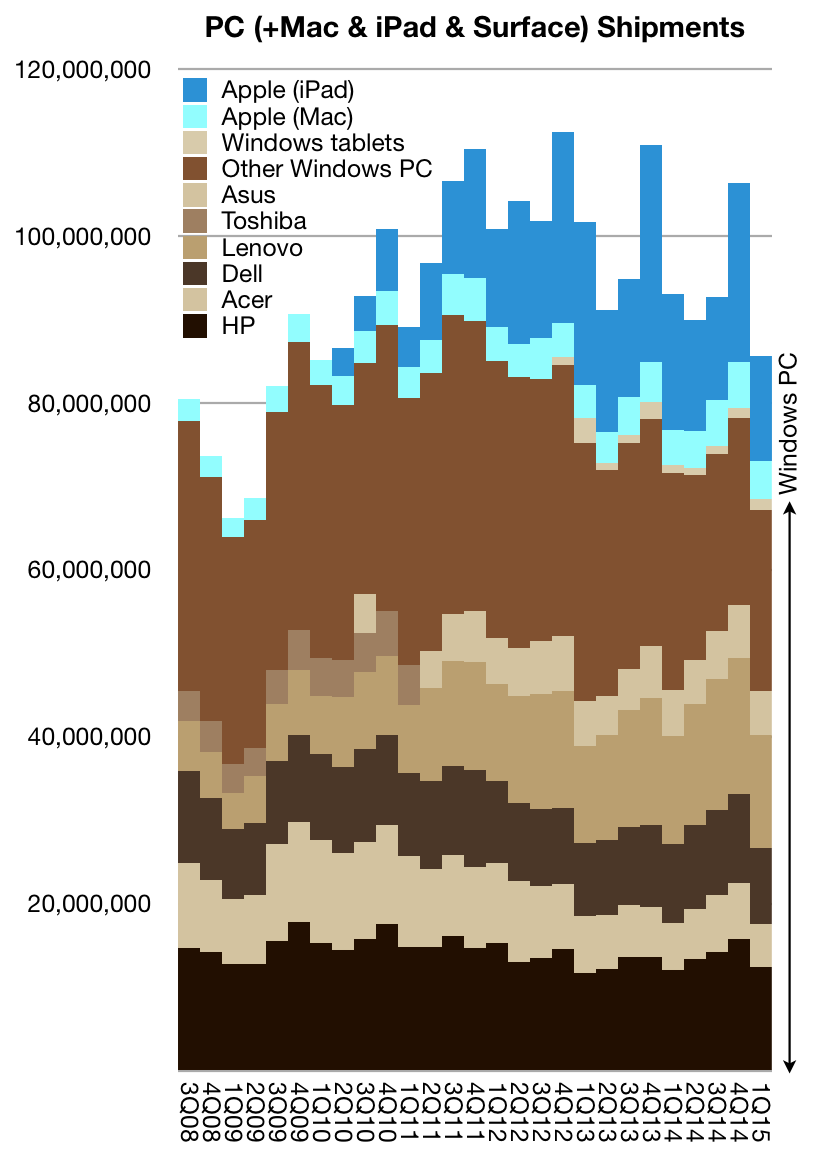
    If so then the tablets can continue disrupting PCs from below. As the graph below shows, iPads have captured a great deal of the growth of the overall "computing" market as defined by the PC.

    Screen Shot 2015-06-16 at 2.41.00 PM

    However even that growth has stalled. The combined PC+Mac+iPad market is declining suggesting that "computing" is inexorably being absorbed by the mobile phone.

    Apple management remains bullish on the future of the iPad as a PC disruption. That is certainly possible to continue, especially as PC usage in enterprises needs to migrate in order to take advantage of mobile productivity. But before we see progress we need to see the iPad get better in meaningful ways.

    The dimension of input and interaction seems to be about to get an upgrade. This is just what the product needs.

  7. Where are Maps going?

    Research · 308 comments

    At the 2015 WWDC Apple stated that it receives 5 billion requests per week for its maps service. It also said that Apple maps is used 3.5 times more frequently than "the next leading maps app."

    These two data points are the total number of data points we have about the global maps market. Neither Google nor Nokia provide usage or share or performance data. Regardless, commentary on the usage, share and performance of Apple Maps has been abundant for the three years since its inception.

    The data presented allows us to make a few estimates for the first time and we can hope that additional data can allow a picture to emerge of where maps are going.

    With these first two data points we can finally make some estimates. But some assumptions are still needed: We need to assume that the "next leading maps app" is Google Maps. Although there are other maps apps on the iOS platform they are probably insignificant and it's a two-horse race between Google and Apple on iOS.

    This means that the 3.5:1 split in usage results in a 78% share for Apple Maps and a 22% share for Google. If we assume that there are about 400 million iOS users of maps ((Note that not all iOS users are maps users. Maps are not used by all users)), it leads to about 90 million Google Maps users on iOS and about 310 million Apple Maps users on iOS.  This includes iPad. ((We are excluding OS X use of Maps.))

    Given that Google also reported 1 billion downloads in 2014 ((though not necessarily all of these downloads lead to active use, obviously)) we can assume between 25% to 33% Apple Maps "market share" of usage.

    At the minimum, 25% share is not insignificant and it's easily sustainable. To understand why, we should note that there is one more data point. In December 2012 I posted an analysis on the the cost of maps. It showed that maintaining maps requires an investment of between $1 billion and $2 billion/yr. With the addition of new features such as 3-D mapping, transit maps and thousands of new cities, the cost is likely to have increased. $2 billion/yr is probably the norm today.

    Apple then could be seen as spending about $6.5/user/yr on maps and Google could be spending about $2/user/yr. To be profitable Google would need to find ad revenues of $2/user/yr and Apple would need to find $6 of profit on each phone/yr. Clearly, each of these targets is achievable.

    In contrast we can see why Nokia's HERE Maps business is now worth a lot less than it was in 2007. The asset has been for sale for some time and the latest bid  has been for $3 billion, making the $5 billion lost in market value and $7 billion of investment since seem like a catastrophe. Without a business model the data is worthless--with only 30 million users the cost per user reaches $66/yr. A buyer needs to find an appropriate model for sustaining a $2 billion/yr burn rate.

    So the question of where maps are going depends on the business model for maps. In a world where maps are sustained by device value, 300 million users makes it sustainable. In a world where maps are sustained by advertising, 1 billion users makes it sustainable. What else is there?

    How about a world where maps are sustained by transportation services?

    Uber's and other auto makers' interest in HERE shows a third business model. Accurate maps are a key to making vehicles autonomous. More so even than the value of the algorithms, precise imaging of roadways enables vehicle autonomy and the value of location gathering systems should grow to meet that future.

    It's highly likely that Google's maps efforts are going to continue because they are fueled by a business model. That is also true for Apple's maps efforts, though they are fueled by an entirely different business model. Each of these business models fuels the improvement of the maps product but also of the maps gathering process. As these processes are expensive and licensing options are few there is little incentive to share the data. As a result the processes remain integral to the businesses.

    This integrated-while-fueled nature means that maps makers will find it compelling to pursue adjacent business models, i.e. transportation services. It's not a matter of whether they will or won't. It's only a matter of when and where.

  8. Schiller's Law

    Research · 9 comments

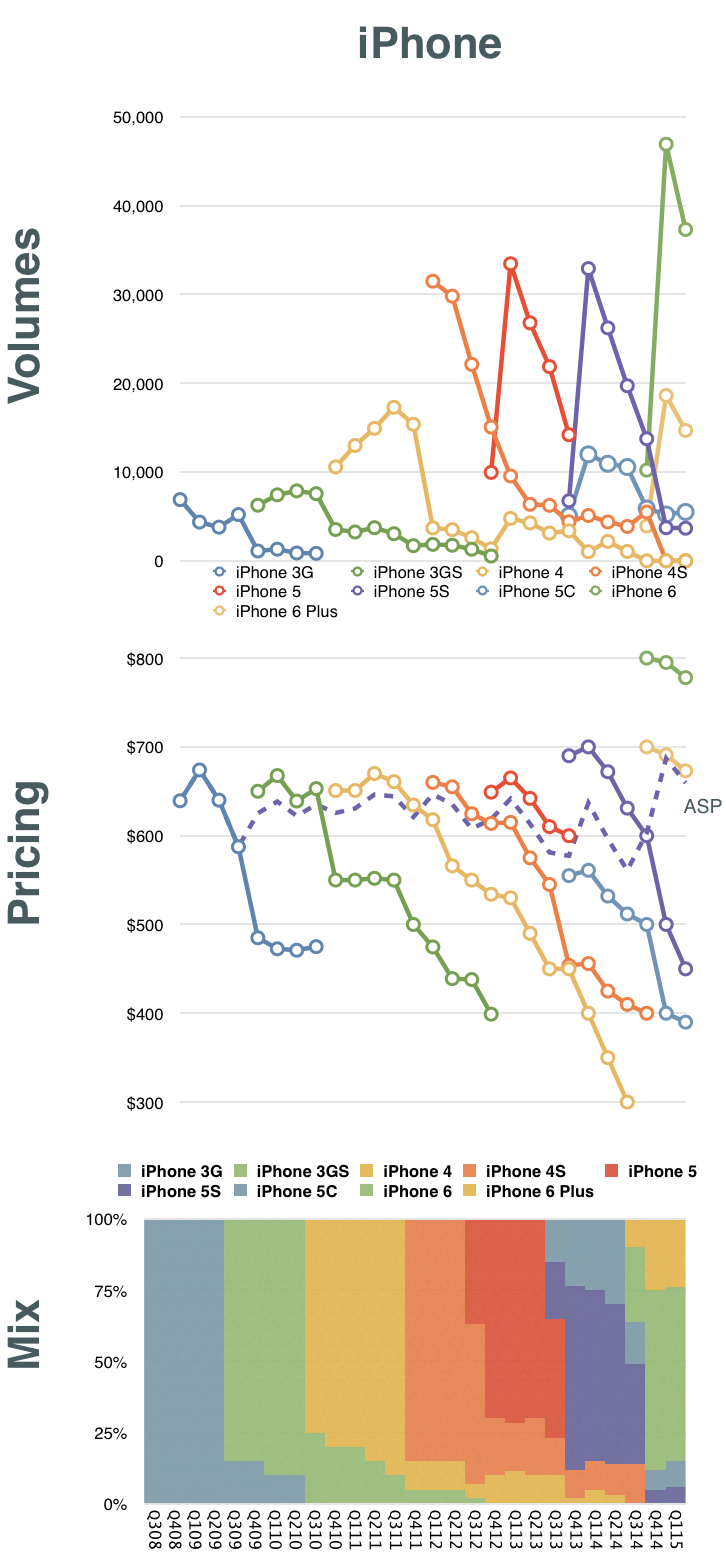
    We know how many iPhones Apple ships but we don't know exactly how many of each model. We can try to come close in such estimates of "mix" by looking also at the market pricing of the phones and the average price Apple obtains ((ASP = Revenue/Units shipped. However, note that there are deferrals in revenue as part of this.))

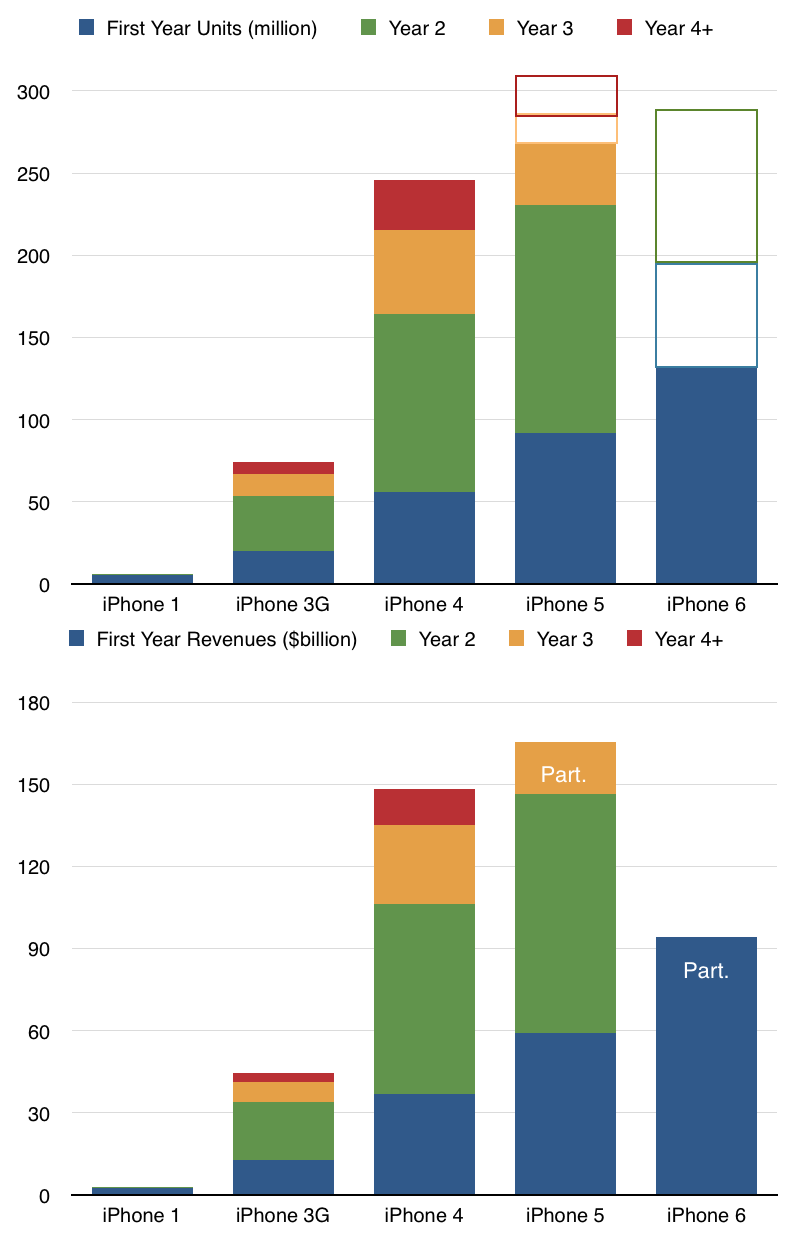
    Combining what we know with some guesses allows some of us to estimate the composition of iPhone models in any given quarter's sales. Here is a graph showing my estimates:


    Screen Shot 2015-05-22 at 2.53.36 PM

    Having this, we can then assess how each generation of iPhones has performed. Remember that although we had a new iPhone for each of the last eight years, there are only 5 generations in total. Starting with the 3G (second generation) the generations were two yearly product cycles long.

    The resulting estimates for generational growth are shown below. 

    Screen Shot 2015-05-21 at 6.41.02 PM

    I included a second graph with revenues. Note that the iPhone 5 and iPhone 6 have not run their course. History suggests at least a five year run for any one generation and the 5 is at less than three years old and the 6 is at less than one.

    The interesting question is therefore not whether each generation sells more than its predecessor but whether it does so by a substantial multiple. I drew in outline a few estimates on future volumes for the 5 through its end of life and for the 6 for the current and next year. Of course these are highly speculative but the question of how much can be expected from these generational leaps is interesting.

    Recall that

    When assessing sales for a new model of the iPhone, Apple used an easy shorthand: "Each new generation sold approximately equal to all previous generations combined."

    Phil Schiller's Testimony in Apple v. Samsung trial

    Such a pattern of growth, which I call "Schiller's Law" is extremely difficult to maintain and probably won't apply in the case of the 5 or 6. However the growth of the overall franchise is very apparent. In particular you can see how first year sales have a very healthy pattern of growth, especially when measured in terms of revenues.

  9. How many iOS devices will Apple Ship in the next six months?

    Research · 11 comments

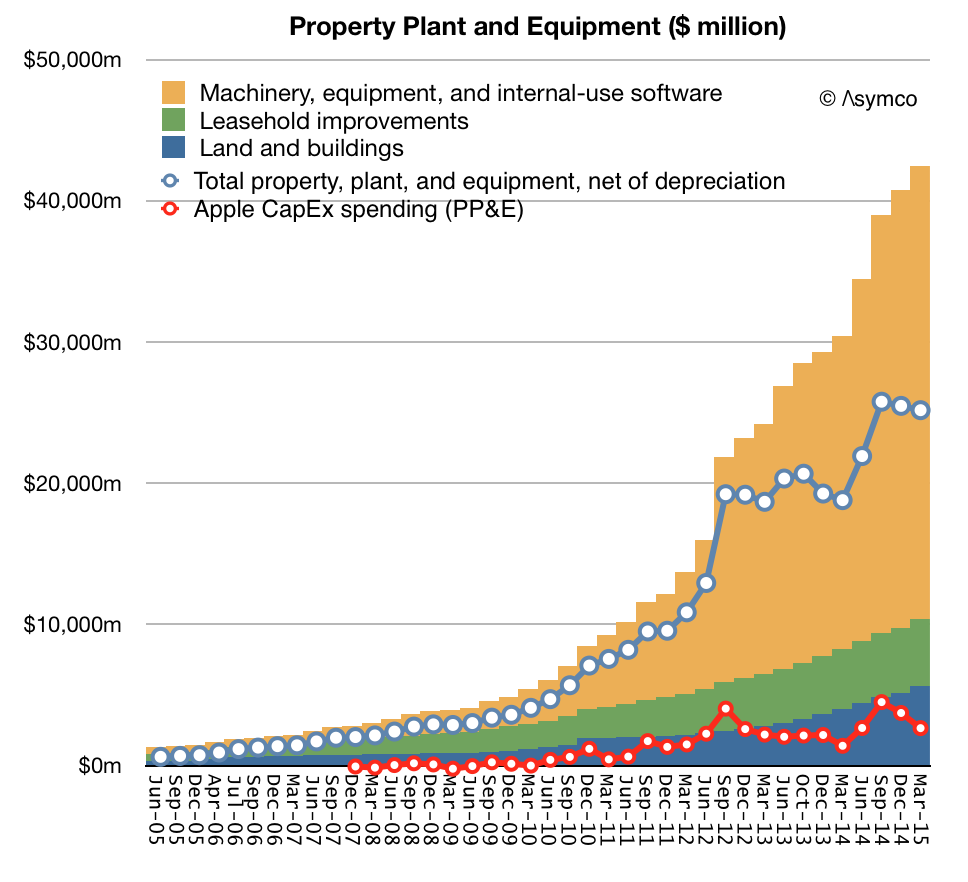
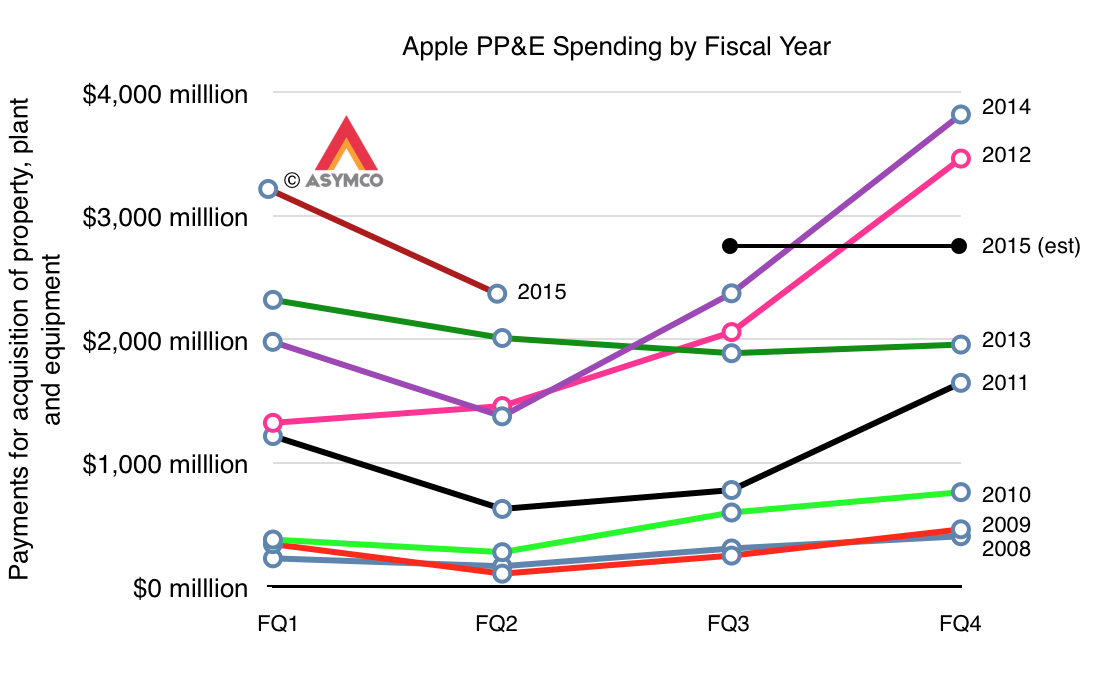
    Of the $42.5 billion Apple spend buying capital assets ((Includes land and buildings $5.6b, Machinery, equipment and internal-use software $32.1b and Leasehold Improvements $4.7b)) more than half was acquired in the last three years. Net of depreciation these assets are currently worth $20.1 billion and the spending rate is about $12 billion per year.

    This strategy of spending on capital assets is primarily in support of its particularly integrated approach to its product strategy. The purchasing of tooling for product manufacturing gives many benefits, including ability to deliver uniquely differentiated hardware, a predictable ramp and availability of parts throughout the product lifecycle.

    Screen Shot 2015-05-05 at 3.02.04 PM

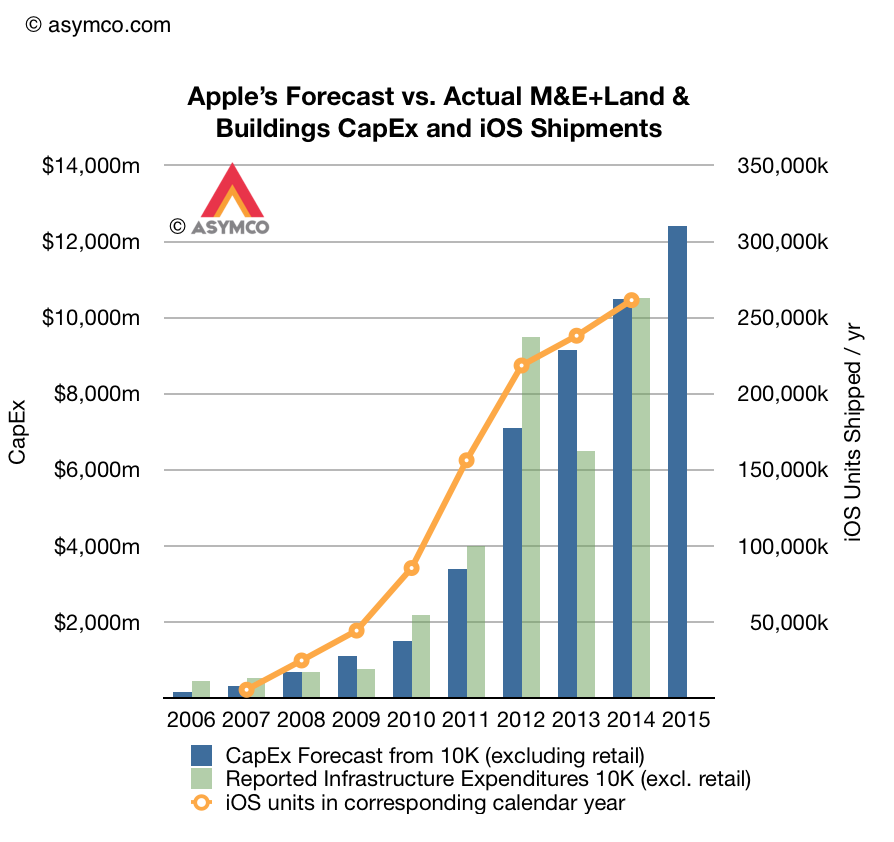
    One additional benefit (for us) is that we get to inspect the allocation of resources prior to production and therefore we can more easily forecast the product's supply. Spending on tooling happens in advance of production and the company also provides full year predictions of its spending.

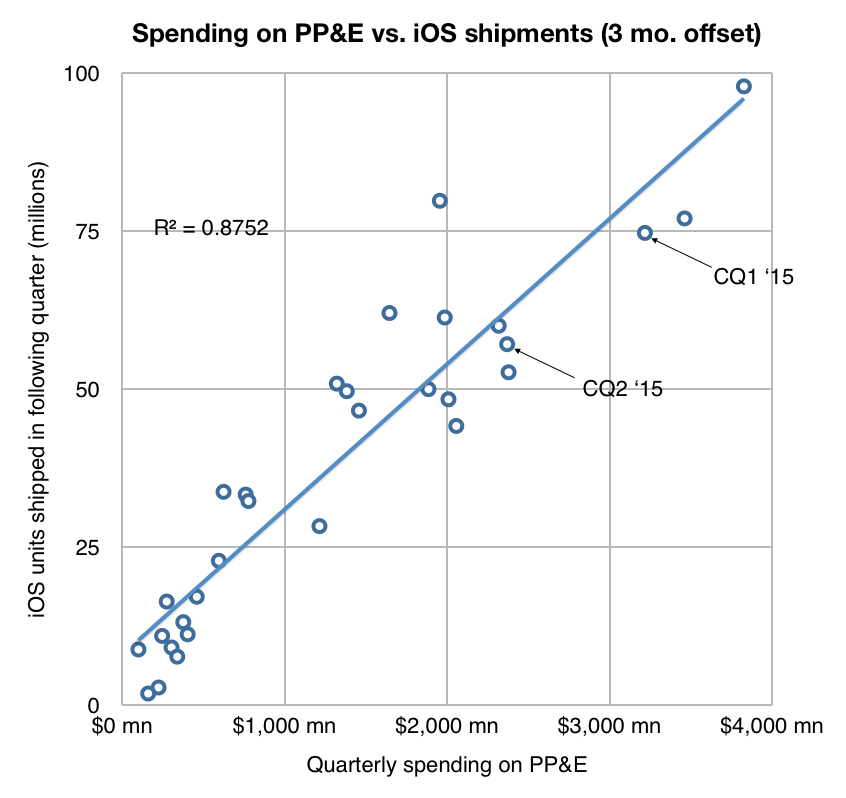
    The fiscal year forecasts relative to actual spending is shown below. Note the correlation with iOS units shipped one quarter after the spending was booked.

    Screen Shot 2015-05-05 at 3.08.24 PM

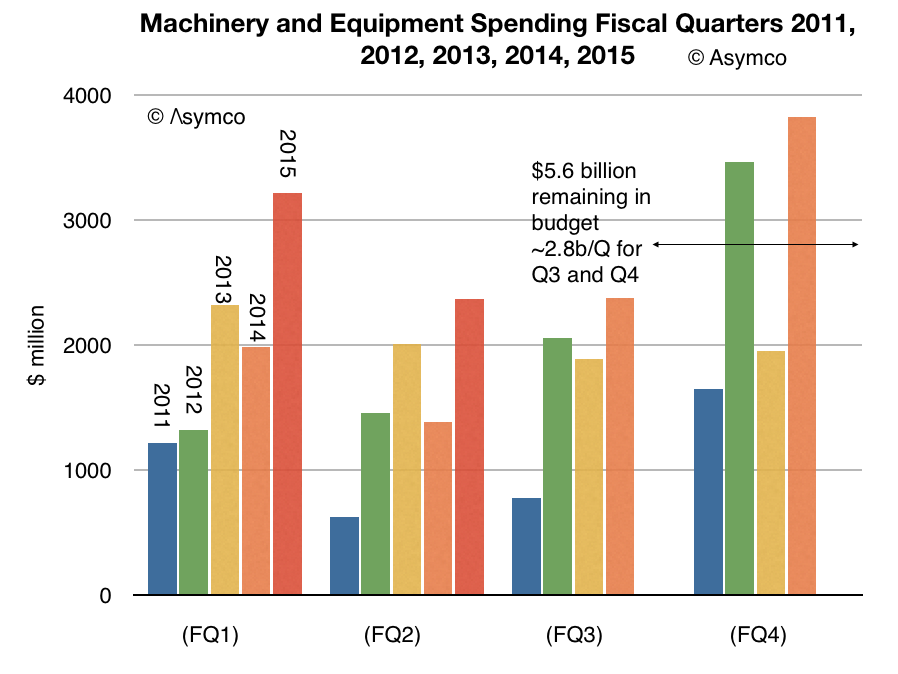
    After reporting its second quarterly earnings, we received an update on what amount to half of the full year's spending giving us only two more quarters of variability. The current projections for the next two quarters imply about $2.8 billion per quarter spending.

    Screen Shot 2015-05-05 at 3.05.29 PM

    The pattern from previous years is shown below for comparison. Note the Even/Odd year patterns.

    Screen Shot 2015-05-05 at 3.05.35 PM


    The company also offered revenue guidance for FQ3 and therefore we can even make an educated guess on the next data point (57 million iOS devices) on the following graph:


    Screen Shot 2015-05-05 at 3.20.52 PM


    The result is likely to be 120 million shipped between April and September.

    It's remarkably predictable.


  10. How will we measure Apple's Watch success?

    Research · 55 comments

    It won't be easy. The company will not be reporting the Watch segment revenues or (presumably) unit sales and therefore we won't have an accurate unadulterated view of the business. In addition, the large number of products in the mix and wide price variance means that it will be difficult for analysts to determine demand and price.

    There is a hidden benefit to not having this data. All data is a creation and it tends to lead thinking in directions led by whatever is being measured (and whoever chose those measures and their motives). And yet without data there is no evidence and no credibility. In other words: You can't manage without measurement but you can't be sure what to measure.

    The analyst is then faced with a requirement to have good taste or at least judgement about what to measure. This judgement is based on experience and good theory. Given that, what could we measure to determine whether the Apple Watch will be a success?

    Here are some suggestions:

    1. Language. Measure whether "Watch" will come to mean "Apple Watch". "Phone" has come to mean not only "smartphone" but also all mobile/cellular phones and not just things used for calling but things used for all manner of information. This is a great test because the theft of semantics can only be accomplished through a degree of ubiquity of influential mindshare. Incidentally, the brand may well have been designed to do just that. ((It leaves open the question as to what watches as currently defined will come to be known as.))
    2. A measurable and significant reduction in the use of the iPhone. The Watch peels off uses from the iPhone and therefore the more it peels off, the less remains. However, that which remains will be more uniquely valuable to the incumbent. This is the process of carving and erosion that the PC experienced vs. mobile devices in general.
    3. An increase in the mix of large-screen iPhones. As iPhones are removed from pockets more rarely, the larger version might be more comfortable to carry and more useful to use for the immersive tasks that are outside the scope of Watch.
    4. An overall increase in iPhone sales beyond the foreseeable trajectory. This would suggest switchers from Android would be drawn to the platform purely for the value of the "accessory". Note that this is not inconsistent with the lower usage and higher spec mix measurements.
    5. Apps uniquely targeting the Watch. It's hard to imagine how this will develop as it involves millions of creative minds, but as smartphones created new economic value through the solving of new jobs to be done, the Watch should do the same. As a side-effect it should lead to new empires (or at least Unicorns) being formed around Watch use.
    6. Iteration. How quickly and deeply will the product be improved? Basic accessories like headphones and Apple TV have a leisurely update cycle. Smarter devices are faster. The cycle time of iteration should indicate how seriously Apple takes the platform and that itself should be fueled by positive consumer sentiment for the product.

    These indicators are vague and the data will be weakly signaled but in many ways it will be more meaningful than any financial performance figures.

  11. Luxurious

    Research · 101 comments

    Apple's new watches are priced in a pattern unlike any of the previous pricing models for Apple products.

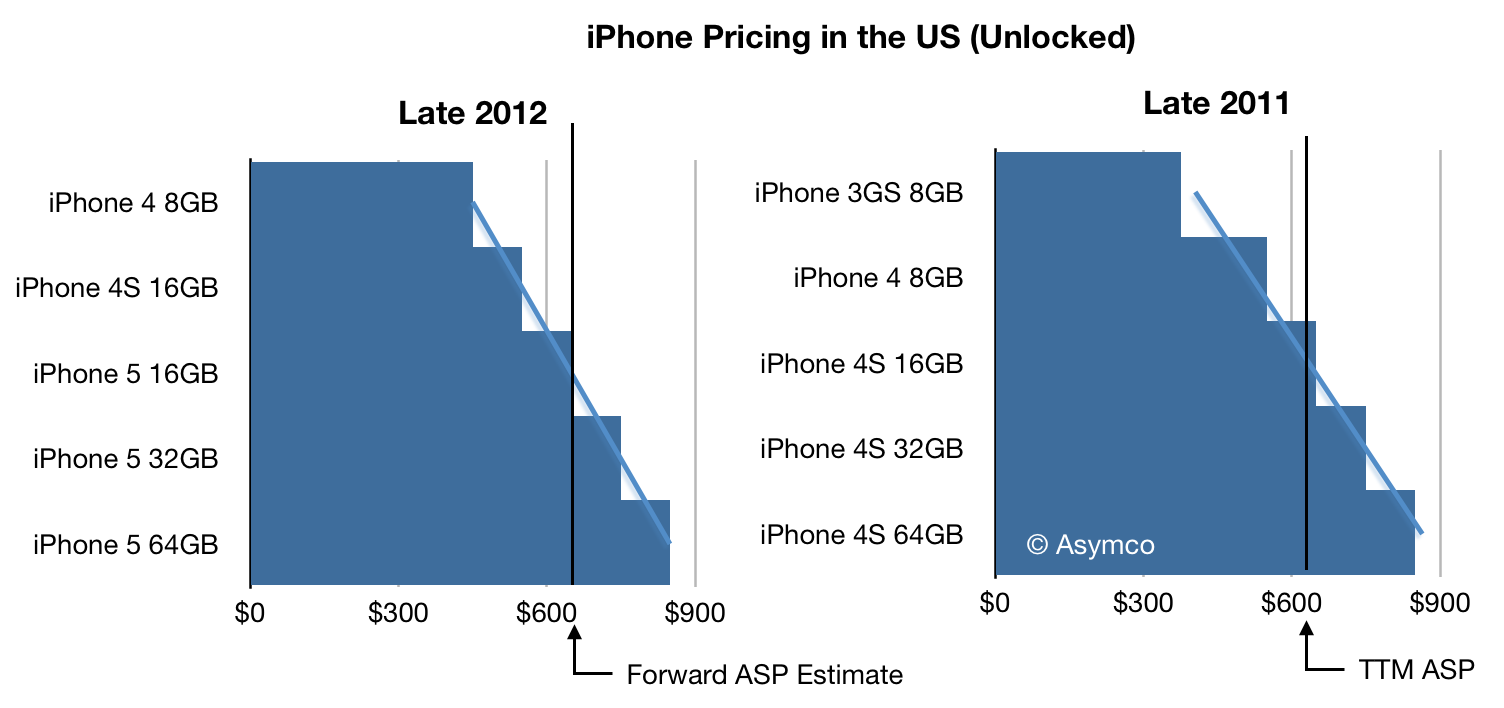
    Previous pricing models for iPhone, iPad, Mac and iPod were typically structured around storage differences. The higher the storage, the higher the price. The Mac had a slight variation where processor and graphics offered some additional configuration options. To illustrate, the graph below shows typical price bands for the iPhone (2011 and 2012)

    Screen Shot 2015-03-30 at 11.51.16 AM

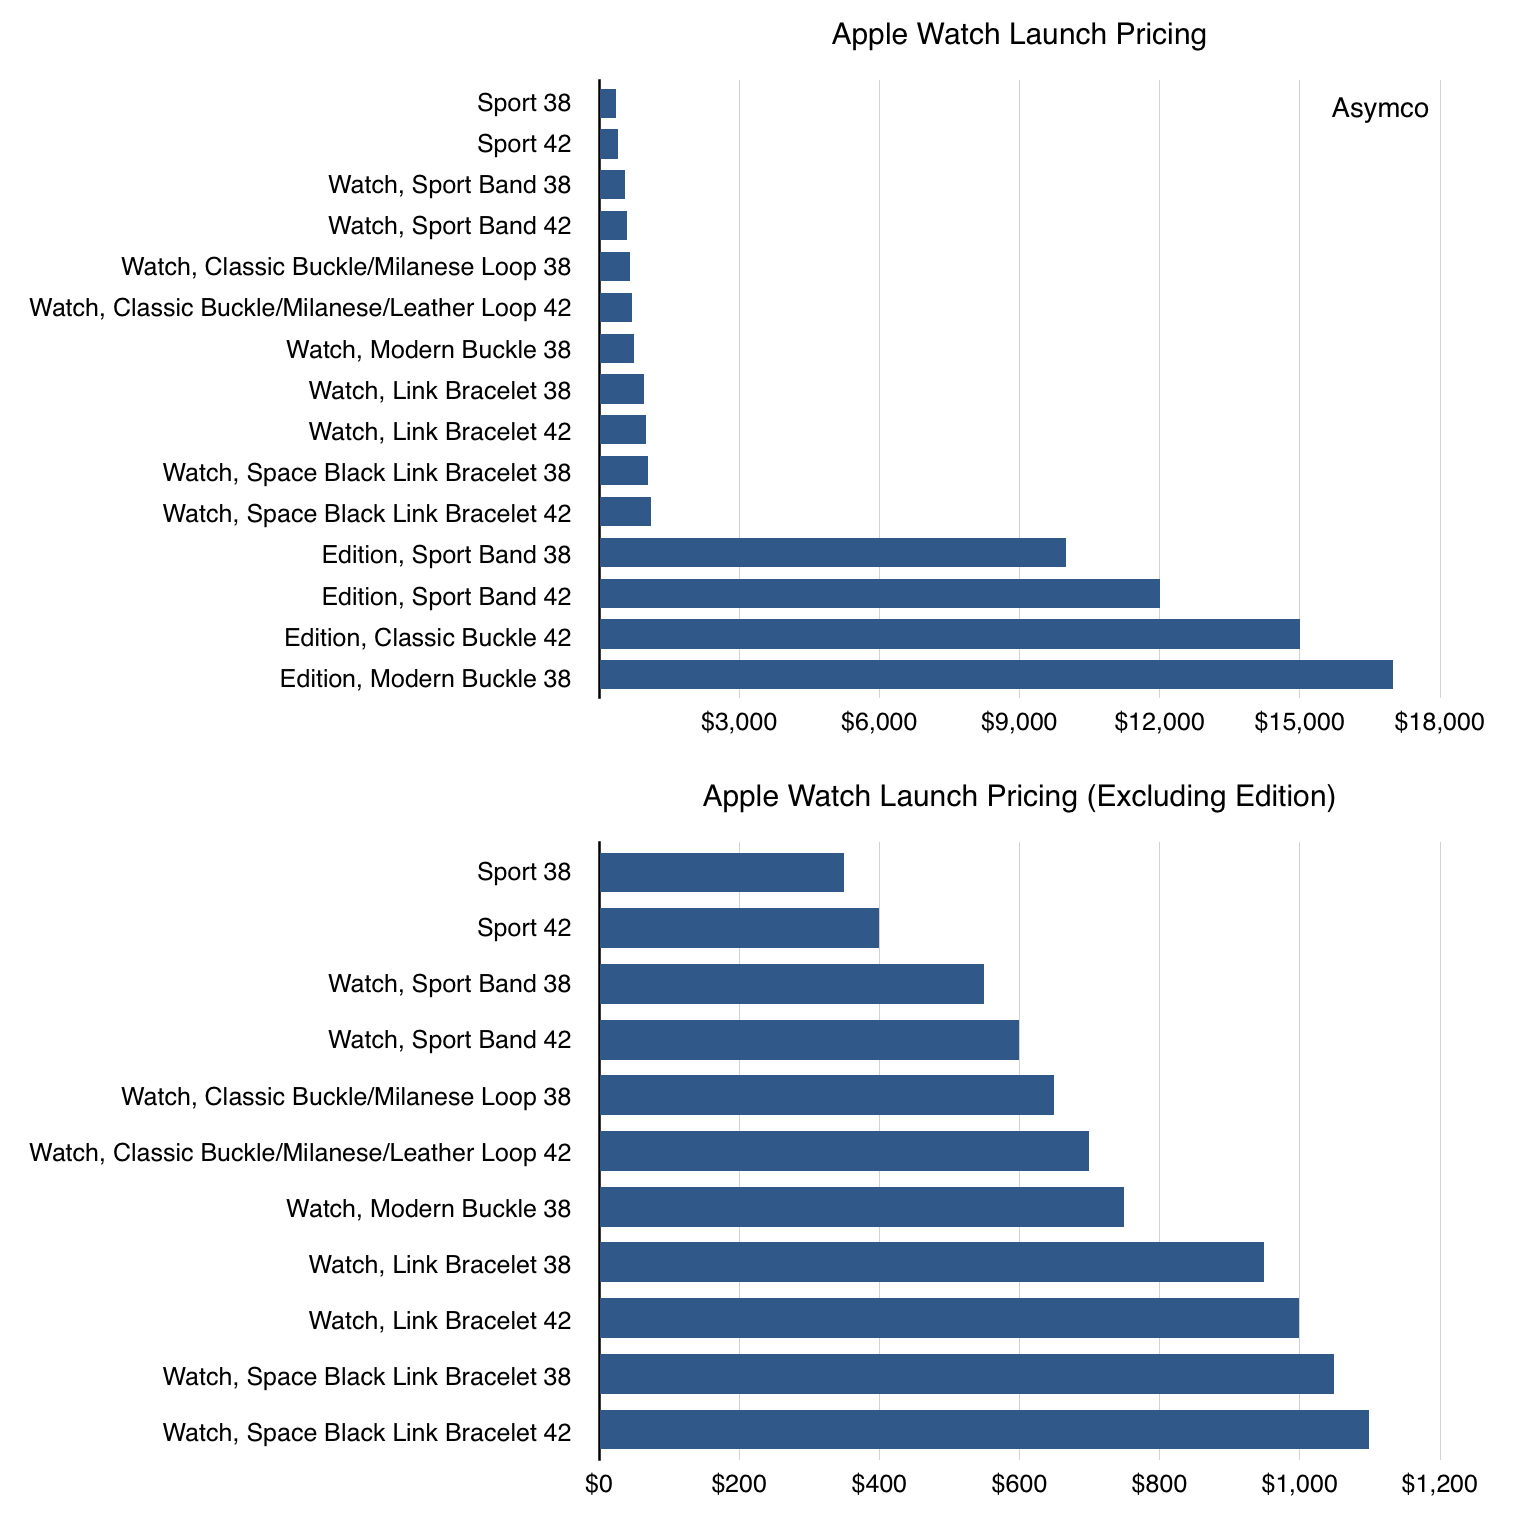
    In contrast, the watches are differentiated by size, materials and bands. There are also a total of 38 watch configurations available at launch (SKUs) and another 38 bands that can be purchased separately.

    The bands come in four price points and the watches in 15. Of these 15 watch prices, four are dramatically different. The pricing of the watches is shown in the two graphs below (with and without the Edition).

    Screen Shot 2015-03-30 at 12.03.19 PM

    This mix of product makes average pricing estimation more challenging, but the more pertinent question is what does this new pricing model signify? Is it something that Apple can "pull off"? Can Apple actually price not on functionality (or options thereon) but on materials?

    It used to be said that Apple's profit engine was fueled by the ability to price memory at a significant mark-up on its cost. The iPod earned the vast bulk of music player profits by offering additional memory increments at significant price increments. Even today, a 64GB iPod Touch is priced $100 higher than a 16GB version. Sounds reasonable, but a quick check shows that 64GB of Flash memory probably costs about $5. This exploitation of pricing/cost differences at the margin allows for great profitability and is rooted in the ways the buyers contemplate value.

    Therefore the difference between memory-based pricing and materials-based pricing is only in the choice of how to attach value in the mind of the buyer. In one case it's having the option on storage, in the other it's having the option, perhaps, of more durability, quality or glamour.

    The tricky part is understanding just how much the market will bear. What is the right differential for pricing of steel vs. aluminum? Or what makes gold worth so much more?

    The cost of these materials (and the processes needed to manufacture them) is not very important. As with memories, the differences are not that significant. It could even be that the Aluminum process is more expensive than the steel process--it depends also on volume.

    What matters most is how to gauge the perception of value.

    This is where one can take cues from the existing market. Gold is costlier than steel but the pricing difference is greater still. Multiplying $1000 (cost) by 10 (to get a price) yields far more profit than multiplying $1 by 20. This perception of gold as being worth it is far beyond its utility--a perception which has taken centuries to build. What Apple is doing with Watch pricing is simply leveraging existing perceptions of value for materials and using them to capture profits for an otherwise purely functional product.

    But that process of using perception to gain pricing advantage for function is how Prestige branding has always worked. The notion that materials, craftsmanship and attention to detail can be priced at huge multiples of cost is possible only with the right brand. That brand, itself built over decades, even generations, gives assurance of quality, perhaps exclusivity and comforts the purchaser in the moment of decision. It also provides assurance after the purchase and preserves the feeling of value well into the future. So-called Luxury brands are those which can impart these qualities on their products and extract the pricing advantage.

    Sounds great, so why doesn't everybody do it? The answer is that it takes time and perseverance, with typically low volumes. This is not something technology brands have been able to do. Mainly because the products are perishable but also because they have not been around for long. With technology, the value is high at purchase on a functional basis but diminishes rapidly afterwards. It's as if, in order to preserve notional brand value, a product needs to be a functional commodity, undifferentiated on what it does but differentiated on the way it does it.

    This is the unique value of Apple's brand: among technological brands it can stretch to cover the perception of value for design, materials, craftsmanship and prestige. At the same time it offers new experiences and introduces new products for new jobs to be done.