Asymco

Asymmetric Intelligence

Market

  1. The Analyst's Guide to Apple Category Entry

    Research · 46 comments

    Understanding Apple’s intentions seems to be a popular parlor game and there are many attempts at divining intention from data and market study. These attempts at market research for answers are futile because Apple does not compete in existing markets but rather it creates new markets. For instance, the market for the Apple II could not have been assessed from research into the computing market of 1974. The intention for Apple to enter into music devices and services could not have been predicted through an analysis of MP3 player market in 2000. The iPhone was also not predicated on the market for “Internet Communicators” in 2006 or 2002 when the iPad was first contemplated. ((The market for phones was large but the iPhone pricing and features made it incompatible with any reasonable segment of it.))

    Instead of measuring the size of pre-existing markets, surveying the functionality of existing products, or weighing toxically financialized ratios like margins and market shares, I recall this ad (Our Signature, first seen at 2013 WWDC):

    This is it
    This is what matters

    The experience of a product
    How it will make someone feel
    Will it make life better?
    Does it deserve to exist?

    We spend a lot of time on a few great things
    Until every idea we touch
    Enhances each life it touches

    You may rarely look at it
    But you will always feel it
    This is our signature
    And it means everything

    My interpretation of these lines, coupled with additional public statements can be used to create a “litmus test” for new product categories:

    1. The experience of a product. Read: They will work on things to which they can make a meaningful contribution. To me this means that they will build things which require an integrated approach. As Apple is "the last integrated company standing” it means they will work on problems where the system is not good enough. This means that they will not work on problems where an individual modular component is not good enough. By system I mean, in the largest sense: production, design, distribution, sales, support and services must work in a seamless way. Systems analysis implies a broad understanding of the causes of insufficient performance along the dimensions of “experience”. The experiences are what differentiate the products (and lead to high margins) and these experiences are possible only through the control of interdependent modules.

    2. Does it deserve to exist? Read: They will work on very few things. They will say no to many things. It’s still true that all of Apple’s products can fit on one table. That may not be true forever, but their product space will not grow as quickly as sales grow. This means that there is no notion of “marginal value” or portfolio theory where products are added because they can be justified as “moving the needle” or balancing demand. Rather, the few things which will be worked on will address non-consumption. Non-consumption of experiences.

    3. Enhance life. Read: The things they release are inevitable even though nobody asked for them. The reason this is possible is that there are unmet and unidentified “jobs to be done” which are powerful sources of demand and whose satisfaction leads to unforeseen rewards. The problems that can be addressed are uncovered through a process of conversation with a few people. They are not uncovered through surveys or large n statistical studies. Without the ability to ask the right questions, big data only leads to big misdirection. In contrast, good taste in questions allows small n to lead to big insight. Apple’s ability for finding the right problem to solve comes from this greatness of taste in questions.

    So given this litmus test, will Apple build a Car?

    I believe the problem of transportation and its proxy, the automobile, provide all the requisite demand for Apple's attention. Technical questions abound and they may still prove unsurmountable before a launch happens, but there are no doubts in my mind that this is a problem Apple would see fit to address.

    Non-consumption of unmet and unarticulated jobs to be done can and should be addressed with systems solutions and new experiences.

    The poetry is pretty clear on the matter.
     

  2. How many iOS devices did/will Apple ship?

    Research · 11 comments

    Last August I wrote:

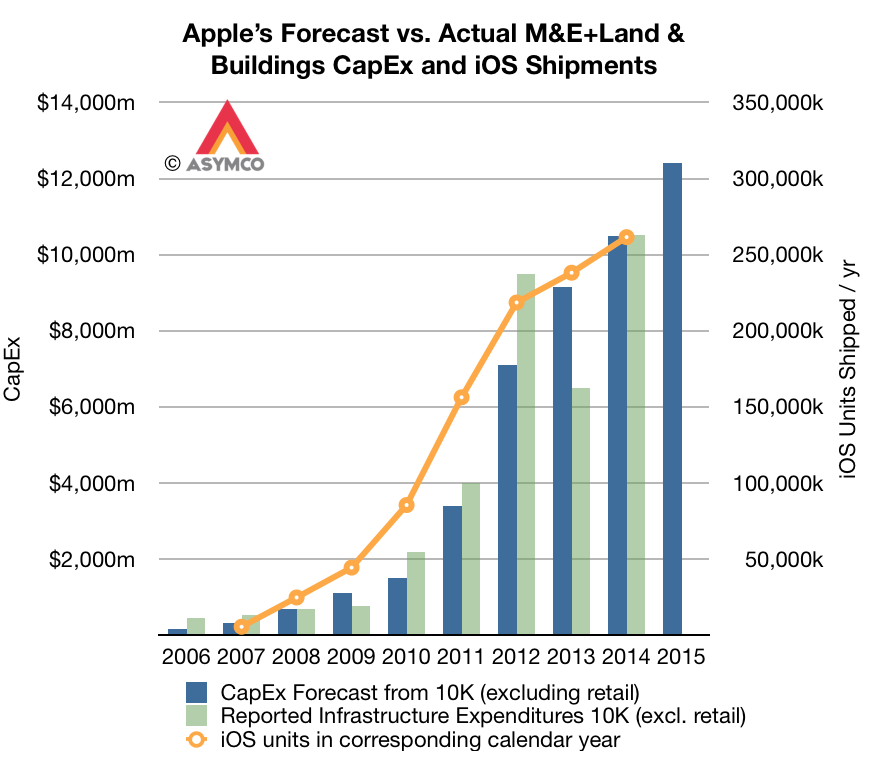
    It’s therefore reasonable to assume that calendar 2014 will see at least 250 million iOS devices sold

    The actual figure was 259.5 million.

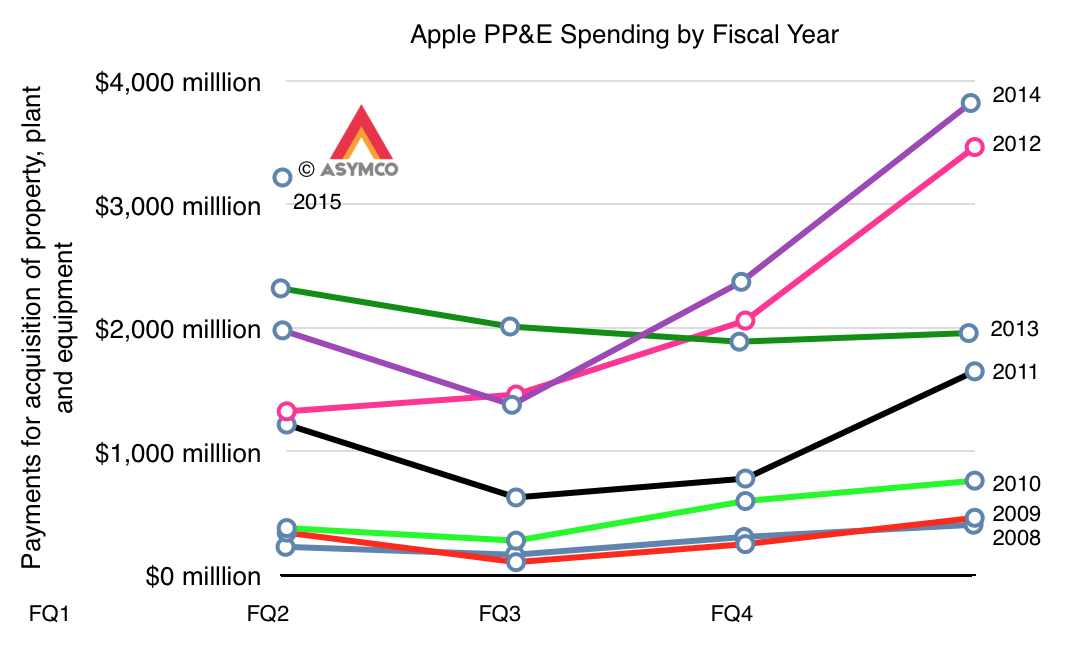
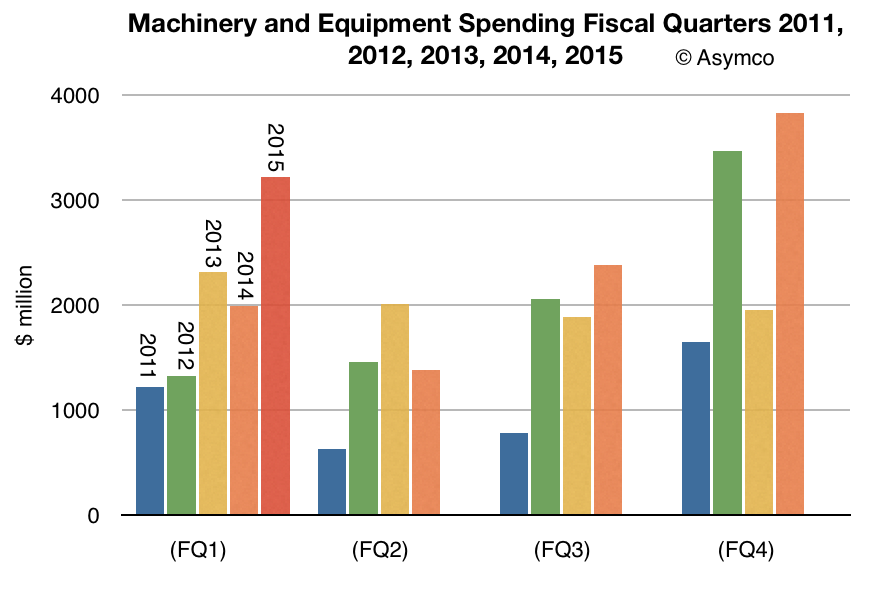
    Looking ahead, the capital spending pattern so far shows a distinct rise heading into Q1.

    Screen Shot 2015-02-08 at 7.33.14 PM

    This could be partly due to the new campus, the new Watch production ramp and perhaps new iPad models.

    Screen Shot 2015-02-08 at 7.33.27 PM

    Nevertheless, I think it's safe to predict that the company is on track to ship 310 to 320 million iOS devices in 2015.

    Screen Shot 2015-02-08 at 7.35.30 PM


  3. Retail in 2020

    Research · 5 comments

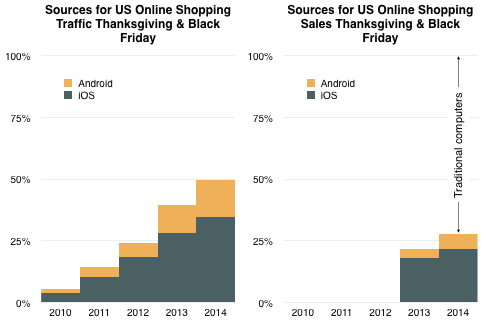
    This year's Thanksgiving and Black Friday data from IBM shows a continuing pattern of growth for mobile devices. As the graph below shows, in the five years since 2010 mobile devices grew from 5% of the online shopping traffic to 50%.  Traditional computing (desktop and laptop) made up the difference.

    Screen Shot 2014-12-01 at 10.34.30 AM

    The graph also shows that sales value via mobile devices crossed over 25% of online spending. The fact that mobile shopping is not equal to mobile spending is due to the convenience factor of mobile. It's more likely that users will spend idle time scanning for bargains or tracking down ideas from friends but wait until they are at home to make the final purchase decisions in front of a computer.

    The transition to spending directly from a device is a slower process, but that process was also one that online had to undertake as buyers became comfortable with online commerce. When it comes to payment, buyers are understandably more cautious.

    This does not change the prediction made last year that "the transition to post-PC consumption will also be practically completed by 2020". That leaves six years for mobile saturation and a total transition time of one decade.

    At that point I expect 90% of browsing and perhaps 75% of spending to be happening on devices. Some of this will undoubtedly be enabled by biometric authentication as shown by Apple Pay. Trust and ease of use in this technology will undoubtedly accelerate the transition making mobile payments more comfortable and secure than on the legacy computer.

    What is less predictable is how much those devices will also be used to transact payments for the physical retail stores. In some scenarios it's possible that by 2020 a majority of all shopping will be enabled by devices. ((There is also the matter of in-store discovery and advertising via NFC and bluetooth i.e. iBeacon)) That would subjugate the retail segment to the power politics of mobile platforms.

    It is interesting therefore to note the mix between the platforms in the graphs above.

  4. How big is iCloud?

    Research · 23 comments

    Apple has declared that what used to be "Other Music Related Products and Services" ((Includes revenue from sales from the iTunes Store, App Store and iBookstore in addition to sales of iPod services and Apple-branded and third-party iPod accessories.)) plus "Software, Service and Other Sales" ((Includes revenue from sales of Apple-branded and third-party Mac software, and services.)) which was formerly known as "iTunes/Software/Services" ((Includes revenue from sales on the iTunes Store, the App Store, the Mac App Store, and the iBooks Store, and revenue from sales of AppleCare, licensing and other services)) is about to become "Services".

    "We'll also have a category that we refer to as services and this will encompass everything we report under the heading of iTunes software and services today including content, apps, licensing and other services and beginning this month it will also include Apple Pay."

    "Services" will therefore encompass a massive amount of revenue. The reported revenues for the fiscal 2014 were $18 billion. Including all billings, the turnover in sales is over $28 billion. For next year, assuming that Apple Pay, which is just getting started, is unlikely to contribute greatly to revenues, Services turnover will top over $35 billion. That figure would make Apple Services alone one of the top 90 companies in the Fortune 500.

    Screen Shot 2014-11-14 at 5.11.47 PM

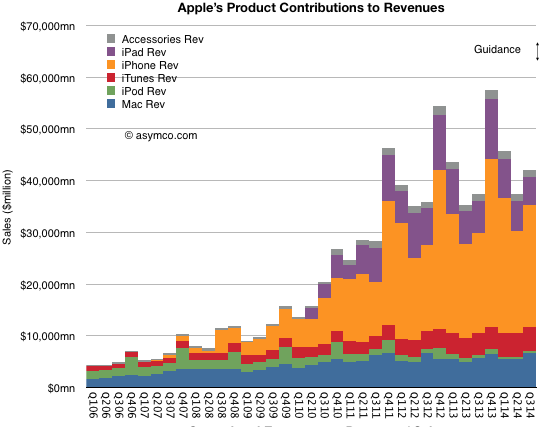
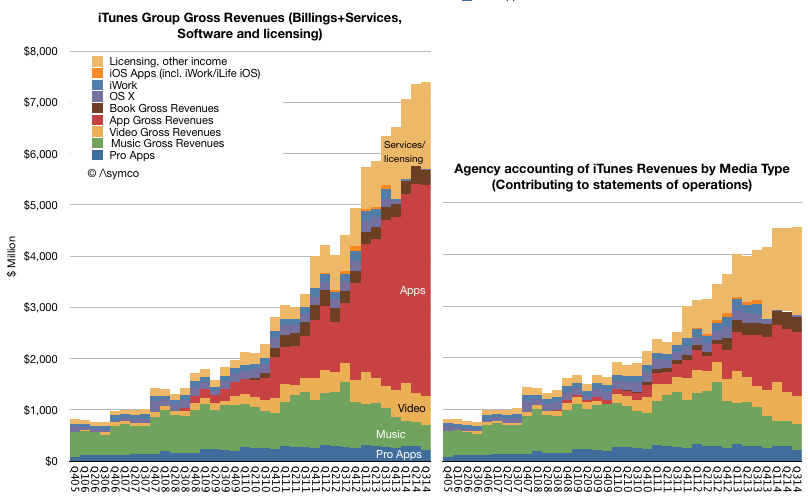
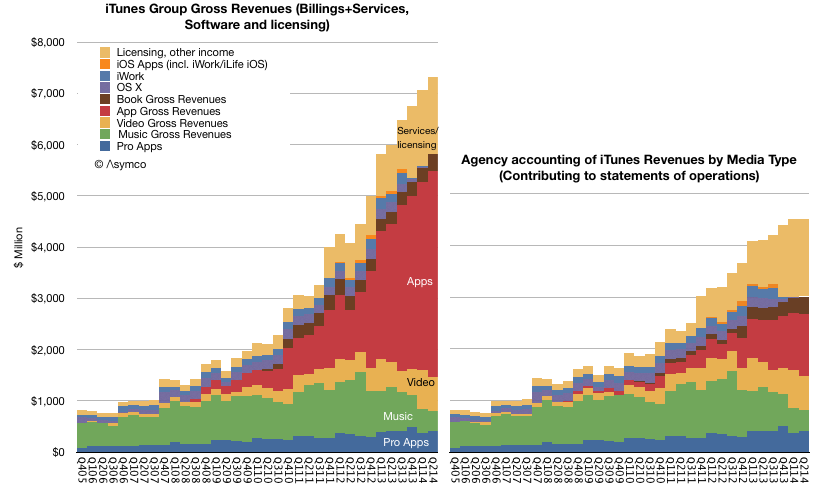
    Regardless, as a component of overall sales, the group formerly known as iTunes/Software/Services (shown in red above) was a modest 7% of total sales in the last quarter. Using all available information regarding downloads, payouts and reported financials, an estimate can be obtained on how this 7% is itself divisible into nine sub-segments:

    Screen Shot 2014-11-14 at 5.15.08 PM
    • Pro Apps
    • Music
    • Video
    • Apps
    • Books
    • OS X
    • iWork
    • iOS Apps
    • Licensing and other income

    These are shown above as either contributing to statement of operations (i.e. as reported, on right) or using billings (or the actual "cash register takings", on left). ((The primary distinction is in Apps billings where the 70% paid to developers is not shown as revenue.))

    What would be ideal in understanding this Services segment would be to break the "Licensing and other income" into its component parts. Namely:

    • Licensing revenues including Google's payments for traffic acquisition (TAC)
    • AppleCare
    • iTunes Match
    • iTunes Radio
    • iAd
    • iCloud
    • (and soon, Apple Pay)

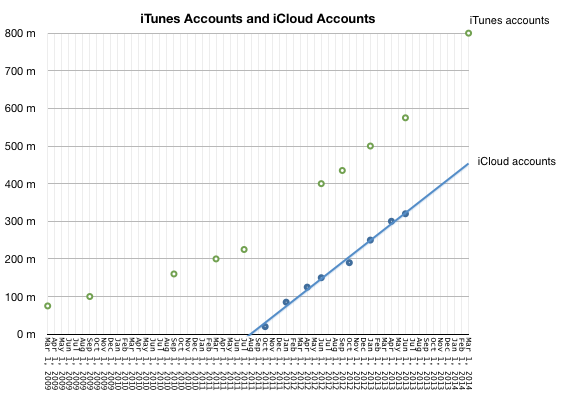
    In particular, it would be very interesting to know exactly how much revenue could be coming from iCloud. We have not heard from Apple on iCloud user numbers since mid-2013 and this was the data at the time:

    Screen Shot 2014-11-14 at 5.30.27 PM

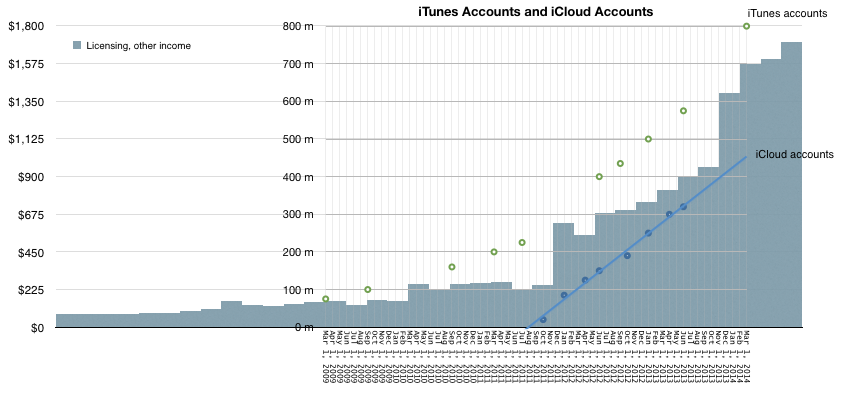
    Couple that to "Licensing and Other Income" as deduced from Services accounting yields the following picture:

    Screen Shot 2014-11-14 at 5.38.30 PM

    It would appear that iCloud accounts are growing in proportion to "Licensing and Other Income". Note that at the point that iCloud accounts were zero, revenues from Licensing were about $225 million/quarter and growing slowly. The real growth kicked in when iCloud accounts started ramping up. Since revenues from iCloud has to be in the "other income" and since no then it is, I believe, reasonable to assume that the iCloud user base growth is a principal driver of growth ((Of course, AppleCare could also be a driver but AppleCare should follow overall device sales patterns and this is not clearly evident in the Licensing/Other curve))

    Also, bursts in the Licensing and other income line occurred after several iCloud-specific marketing events:

    Mobile Me migration started in October 2011 and on September 30, 2013 the complimentary iCloud storage plans expired and were automatically adjusted to the free 5 GB plan (with an offer to upgrade to a paid plan). Correspondingly, Q1 2012 and Q1 2014 showed the largest increases in Licensing and Other Income.

    This is a multiplication of many assumptions, but there is some intuitive logic. The only place iCloud can be found seems to be growing in proportion to iCloud users and plan marketing.

    So how much does iCloud contribute to Apple's sales? My guess would be about $1 billion per quarter. That would be spread over 500 million iCloud accounts and therefore an average revenue per account of $2/user/quarter or $8/user/yr.

    The lowest non-free iCloud pricing is about $12/yr (5GB plan is free). This would imply that two thirds of iCloud users are paying users (and one third are opting for the 5G plan).

    I realize that this attach rate to a paid service is astronomical. Anything over 10% is unheard of. I would say the error in my estimates could be 20% but that still leaves a huge gap to what seems reasonable.

    [Put another way, if the attach rate were only 10% then iCloud revenues would have to be in the $600 million range and thus only about 10% of what Licensing and Other income seems to be. This would force the question of what could be generating the remaining $5.6 billion/yr.]

  5. Measuring the Apple Watch opportunity

    Research · 112 comments

    When the Apple Watch was launched, all eyes turned to the Swiss watch industry. Analysts measured it and asked if it's big enough to be interesting. Industry observers questioned the competitiveness of an entrant vis-à-vis the ancien régime. Marketers weighed in with segmentation hypotheses and how Apple's queer new device might best fit.

    These are all mistakes in analysis.

    The market for Apple Watch is not the Swiss (or Chinese) watch market. The market for Apple Watch is the number of wrists in the world. To the extent that those wrists will be covered with Apple hardware will determine whether it is successful or not.

    Measuring the existing market is a mistake because the existing products are hired for different jobs. Those measurements will yield only an answer to how big that job is.

    Assessing competitiveness vs. incumbents is a mistake because incumbents have perfected solving the problems of wrist-worn timekeeping devices over a century. Apple's watch is not a wrist-worn timekeeping device any more than the iPhone is a phone or the iPad is a pad.

    Segmenting the market by whatever means are convenient today is irrelevant because the segments are currently positioned on the current jobs to be done. It's no more relevant than classifying the iPhone along the segments defined for phones in 2007. ((e.g. keyboard phones, flip phones, and feature phones))

    Some have tried to wedge the Apple Watch among the "fitness tracker" market. This is no more plausible given that fitness tracking is no more interesting than timekeeping is to Watch.

    The best way to measure the opportunity is to quantify the "wrist-space-time" continuum and deciding what is and what isn't addressable. The wrist is an interesting place to put a computer and Apple makes computers. The rest is left as an exercise to the reader.

  6. iPhone Launch Patterns

    Research · 45 comments

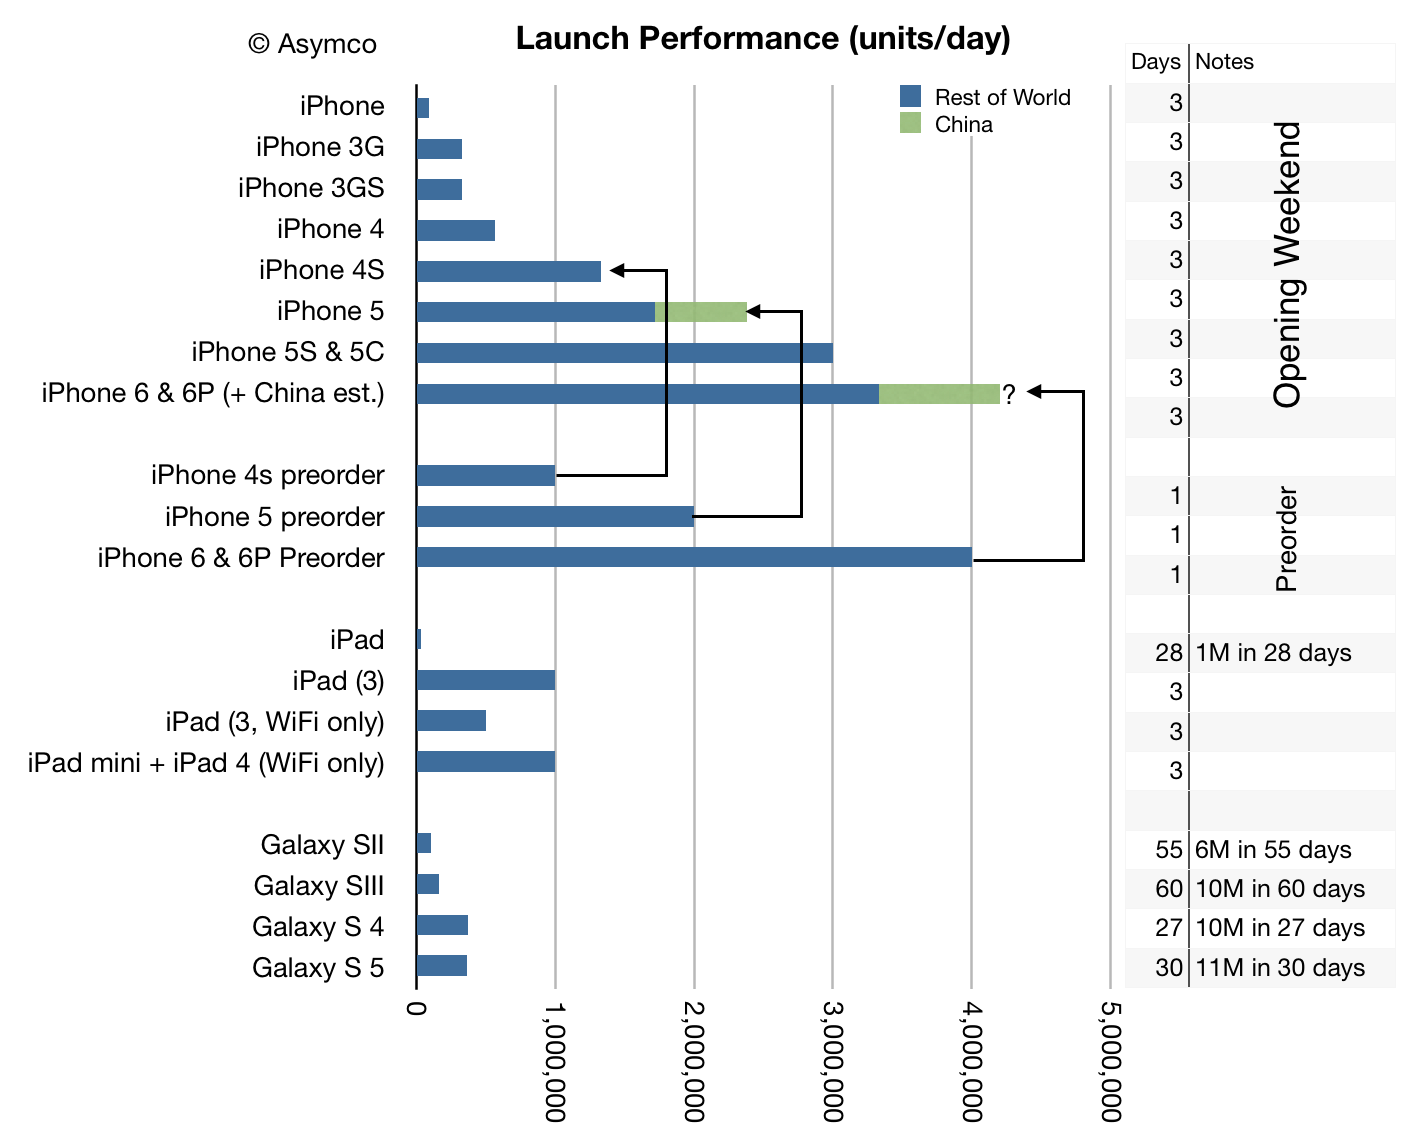
    When the iPhone 4S launched, one million units were pre-ordered and 4 million units were sold during its opening weekend. That made the daily rate during the 4S weekend 1.3 million units/day or one third faster than the pre-order rate of 1 million units/day.

    When the iPhone 5 launched, 2 million were pre-ordered and "over" 5 million were sold during during the opening weekend. That made the daily rate during the  launch weekend about 1.7 million which was about 15% slower than the pre-order rate. However, a few months later the 5 launched in China setting an opening rate of 2 million in three days or about 666k/day. Adding China's rate to the Rest of World rate yields about 2.4 million/day or about 20% faster than the pre-order rate.

    When the iPhone 6/6Plus launched, 4 million were pre-ordered and 10 million were sold during the opening weekend. That made a daily rate during the launch weekend about 3.3 million, again lower than the 4 million/day in pre-orders. However, just like the 5, the 6 launch excluded China. If we assume that a China launch would have run 30% faster than the 5 launch ((Considering that this year China distribution includes China Mobile a 30% increase from two years ago is, in my opinion, conservative)) then my estimate of launch performance for the iPhone range is shown in the graph below:

    Screen Shot 2014-09-22 at 12.35.01 PM

    I included in the graph the various other launch volume data we have available.

    I also included lines showing how pre-order volumes relate to weekend values for the products where we know both.

    It therefore does not seem improbable that had China been available (and at the time when it will be) the iPhone launch weekend rate for the 6/6Plus combo would have been about 4 million/day. A rate consistent with the history for the product.

  7. Tentpoles

    Research · 126 comments

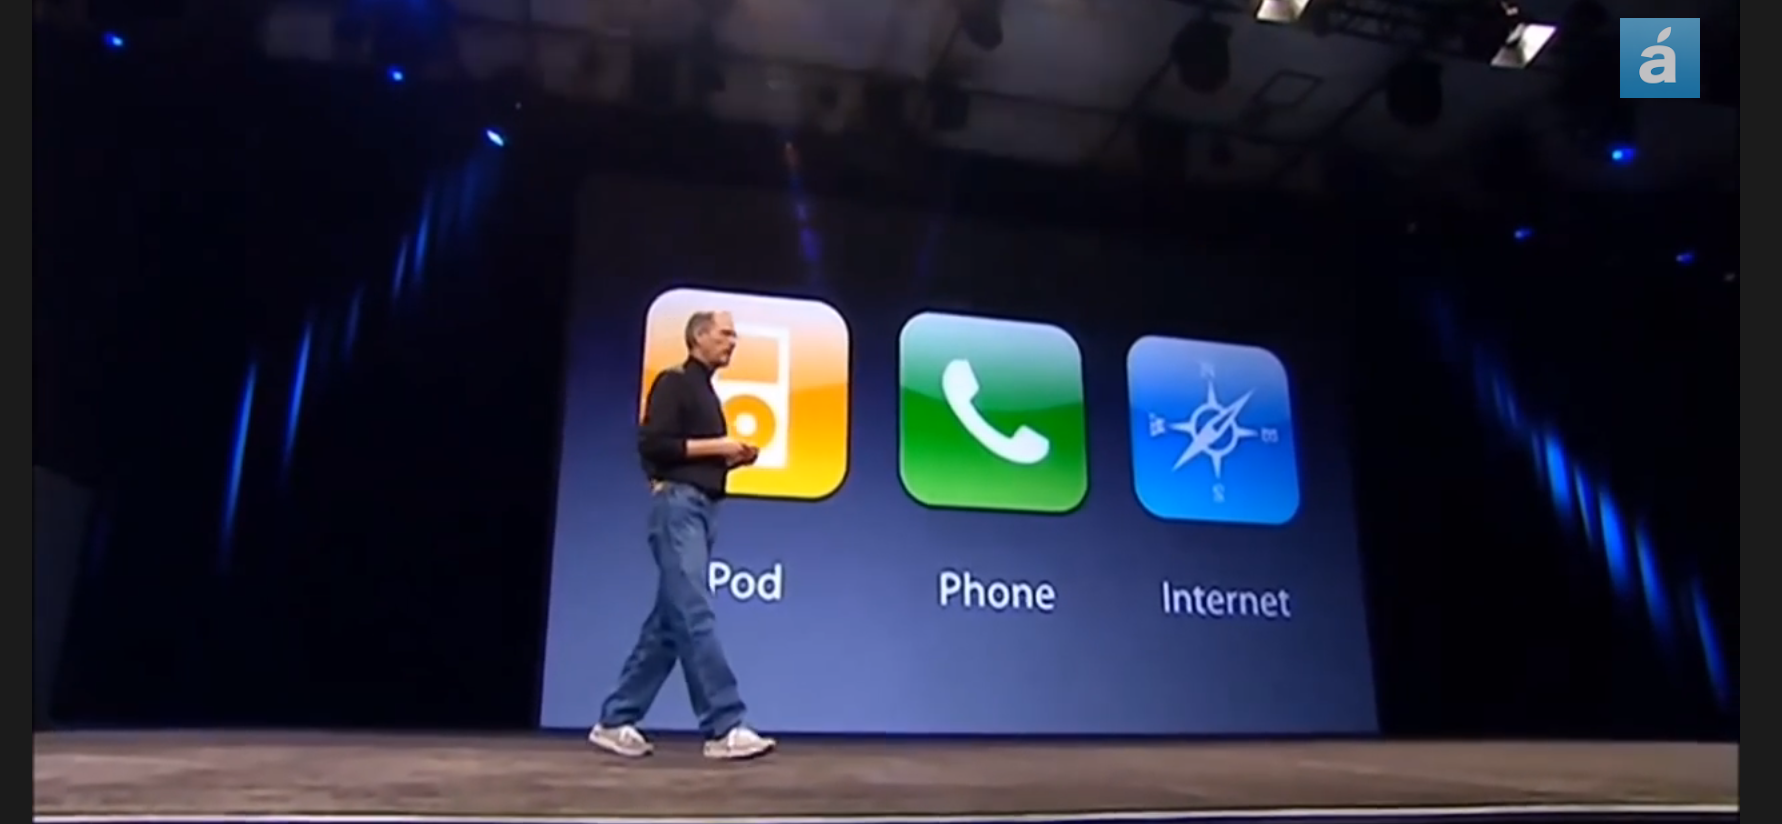
    When the iPhone launched, Steve Jobs introduced it as being three products in one:

    • A wide-screen iPod
    • A phone
    • A breakthrough internet communicator
    Screen Shot 2014-09-11 at 2.40.54 PM


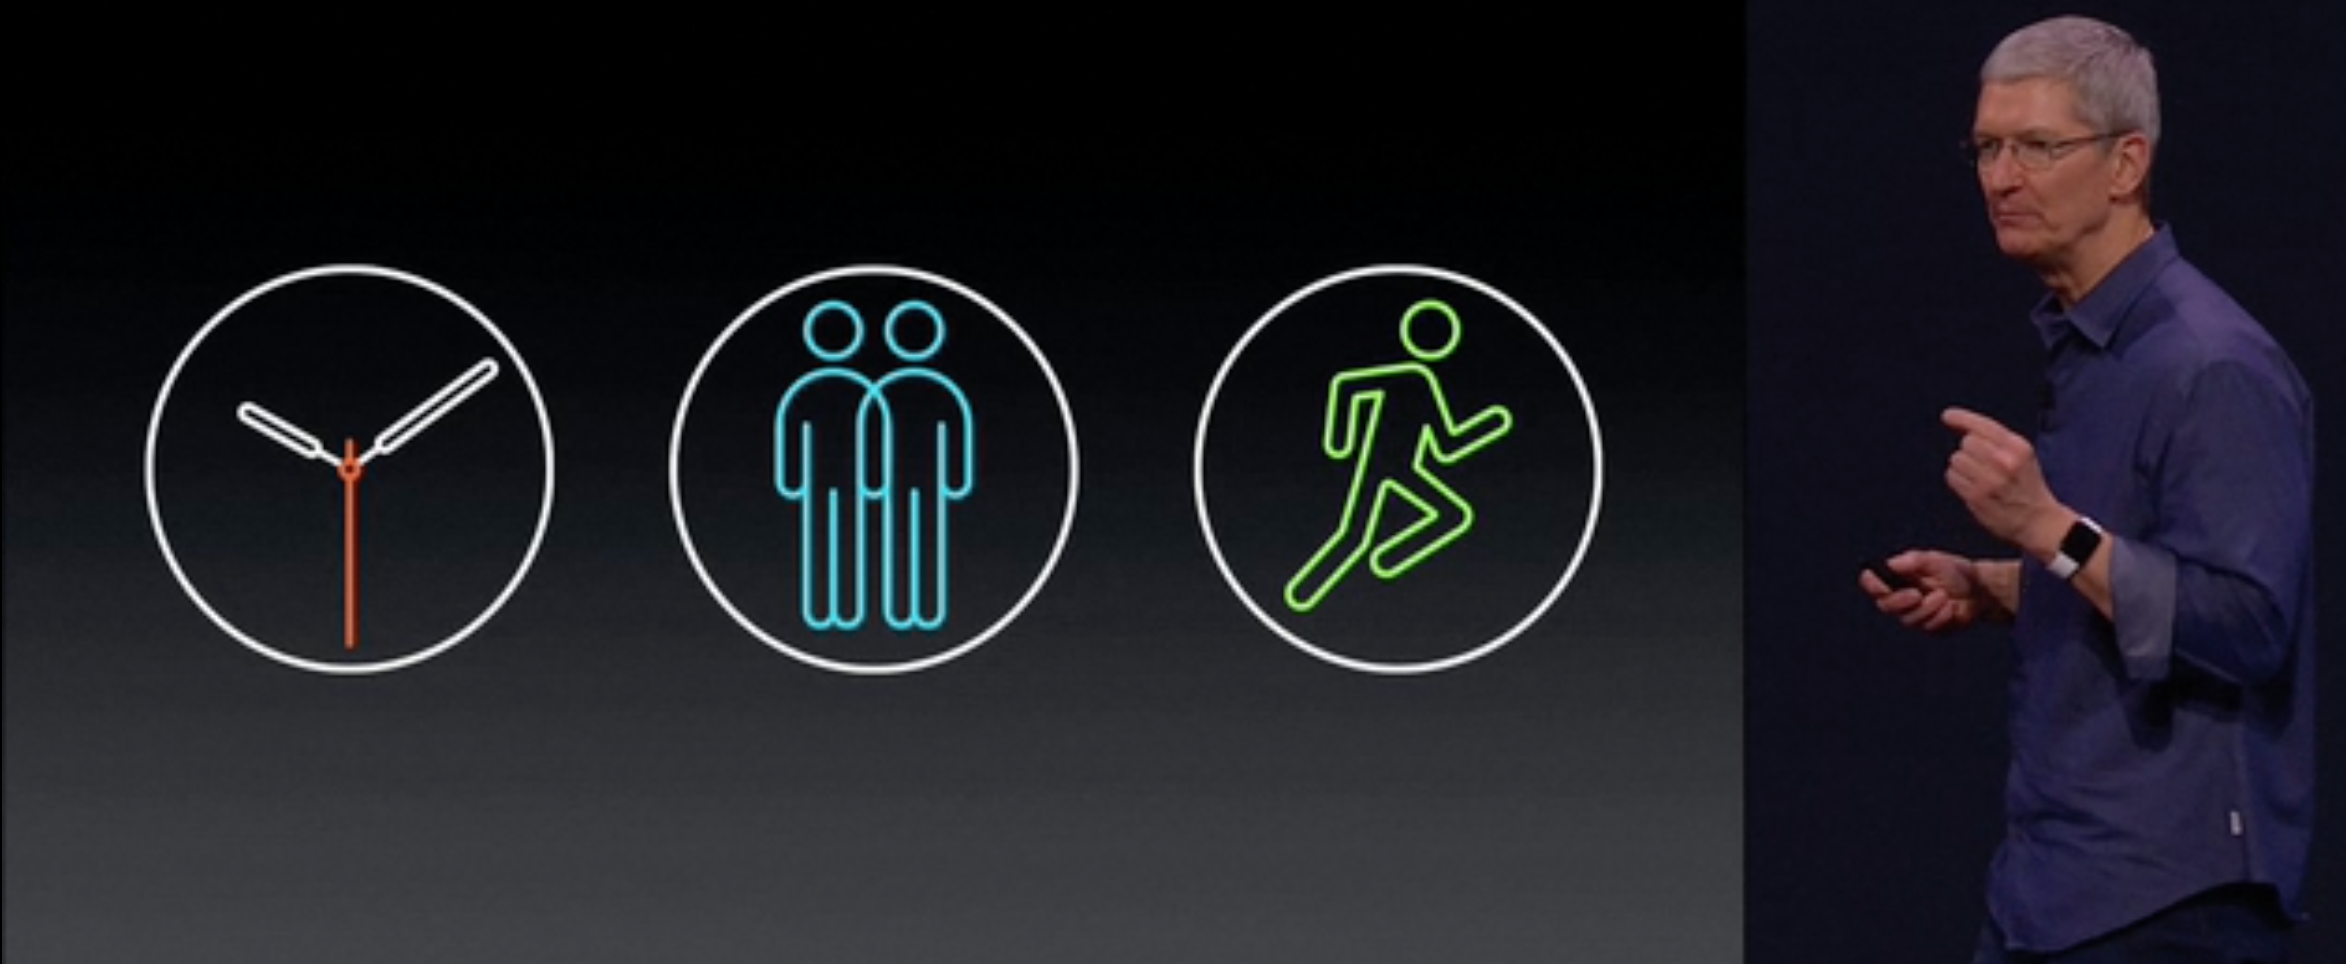
    When the Apple Watch launched, Tim Cook introduced it as being three things:

    • A precise timepiece
    • A new, intimate way to communicate
    • A comprehensive health and fitness device.
    Screen Shot 2014-09-11 at 2.37.52 PM

    As in the Revolutionary User Interface story,  the symmetry in approach to the launch is telling, but what I want to note is that the three things which the iPhone was defined as being are no longer things that it is most used for.

    Yes, the iPhone is still a wide-screen iPod which gets plenty of use but I don't think anyone thinks that is a defining feature. It's also a phone, but the Phone is just an app which, for me at least, is not frequently used. I communicate with my iPhone but the go-to app is iMessage or FaceTime or Skype or maybe Email or Twitter. Phone is something I use so rarely that the interface sometimes baffles me. And yes, it's an Internet appliance. Browsing is something I do quite a bit but many of the browsing jobs-to-be-done are done better by apps. News, shopping Facebook and maps are "things which were once done in a browser."

    So I wonder whether the tentpole product-defining anchors used to introduce the Apple Watch will be faintly amusing a few years from now.

    Of course, the reason iPhone outgrew its tentpoles is because of the app economy. 1.3 million apps does that to a product. When it becomes a platform a product invites collaboration on the problem of innovation. Collaborative innovation explodes the opportunity to discover new needs and uses. How, when and why people use the product changes beyond anyone's imagination.

    But this does not mean that the tentpoles used at launch are in any way in error. They are necessary to explain the value of a new category. The audience can't be told "wait and see all the cool stuff you'll be able to do with it". They need to be told why it's useful today. They speak in the language the audience can understand today. Steve Jobs could not talk in the language of apps and services in 2007. The unforeseen became the inevitable.

    Tentpoles therefore don't define the product but do provide the starting blocks from which the initial buyers make a cognition leap. And once they're off, the others will know where to go.


  8. Going where the money is

    Podcast · 69 comments

    The bank robber Willie Sutton did not say, when asked why he robbed banks, "because that's where the money is." He did agree with the idea however saying "Go where the money is...and go there often".

    Regardless of it being apocryphal, this idea came to be called Sutton's Law and is often taught to medical students. It's similar to the notion of Occam's Razor: when an obvious or simple answer competes with an obscure or complicated answer, pick the obvious one first.

    These are sound analytical rules of thumb. When thinking about what products and services could arise in the immediate future, those most obvious and with fewest assumptions should be put forward first. The what part is relatively easy. The tough question is more about when will they emerge?

    We now know that Apple will announce new products on September 9th ((I'll be there and will report via Twitter and a special session of The Critical Path podcast)). This gives us an idea of when something will happen, answering the tougher question. It leaves the simpler question of what will emerge.

    I put forward my predictions as follows:

    • Regarding iPhone, a tweet on product mix and pricing.
    • Regarding an "iWatch", an answer to a question from Eric Jackson.
    • Regarding the potential for wearables, a post on the subject.

    One more item has surfaced on the potential of payments processing which I want to address now.

    Handling payments, to me, is a perfectly plausible activity for Apple mostly because the company has made quite a few comments on the value of their "customers with credit cards" and the effort that went into Touch ID (which seems to be extravagant relative to the value of rapid unlocking).

    But one word of caution: if Apple does enable payments it's important to realize that being a (payment) bit pipe is not a particularly profitable business. It will undoubtedly bind value to the iOS devices which make it possible, but I don't think there will be a direct capture of profit from the transactions themselves.

    Profit needs to be in proportion to the value delivered. When that value is marginal convenience it is worth something but it's not a huge something. It is a marginal something.

    You might disagree pointing out that payments are big business and banking bigger still. But those businesses are not hired to simply funnel low friction payments around. They are proxies for trust and complex risk management. ((Nota bene: this trust could be commoditized with crypto currencies and blockchain technology making these giant businesses perilously smaller.))

    So for a company that facilitates the payment clearing system, the margins are likely to be very thin and with costs being non-zero it may be nearly a wash. The real impact of the decision to support payments will be in the aura surrounding the iOS ecosystem. An aura which will glow intensely.

    The idea of untold riches coming from "being in the payments business" is rather like the bank robber's dream of being where the money is. It is tempting to think that handling lots of money must result in wealth. However consider the value of Brink's. Net income of $57 million on $4 billion revenues and $1.3 billion market cap.

    Reality is that wealth comes from the creation of value not from its transport.

  9. How big is Apple's Ecosystem?

    Research · 38 comments

    iTunes/Software/Services revenues grew at 12%. This was the second fastest segment growth last quarter, with the Mac growing at a slightly faster 13% rate. Apple mentioned in the quarterly earnings conference call the for the first nine months of its fiscal year (i.e. since September) the line item iTunes/Software/Services has been the fastest growing part of the business. The following graph shows the growth scorecard for Apple's line items and it shows how the iTunes store is the only line that has been consistently green (growing above 10% for at least seven years.

    Screen Shot 2014-07-29 at 8.58.53 PM

    In addition to its revenues, iTunes can also be measured in terms of billings (or gross revenues). The billings growth rate is even higher at more than 25%. This is mostly to the more rapid growth of apps relative to a decline in music. As Apple only records the 30% it keeps as "revenue" for apps the overall growth in apps is less visible in its accounts.

    The relative performance of billings vs. reported revenues is shown in the following graphs:

    Screen Shot 2014-07-29 at 9.02.13 PM

    Note the estimated split between media types and software and services. The software and services portion of the business had sales of $1.9 billion while the revenues from third party content/apps sales reached $2.6 billion.

    The value of this data is that it encompasses an almost complete view of the Apple ecosystem. As almost all content and transactions are tracked and reported and one can get a very precise view of the economic value of the ecosystem. ((In addition to iTunes/Software/Services Accessories could also be considered as part of the ecosystem. The value of Accessories and licensing as Apple reports it adds another $6 billion to iTunes/S/S)) (( What is missing are ad revenues through apps which don't use iAd )) (( What is also worth asking is what is the size of alternate ecosystems such as those of Microsoft, Google etc. ))

    From the launch of the iPhone the value of Apple's ecosystem has grown more than 600% which is faster than overall sales growth (approximately 400%). If ecosystem value grows more rapidly than underlying hardware sales the question that emerges is when would the ecosystem transaction value exceed that of the business is supposedly supports.

    Today the iTunes/S/S ecosystem is about $20 billion/yr. iPod, iPhone, iPad and Mac sales are about $150 billion/yr. It does not seem likely that the former will overtake the latter. If that were the case then one wonders why build a business entirely predicated on retailing and services without the support of hardware revenues. Something along the lines of Amazon.

  10. Is the PC back?

    Research · 119 comments

    Gartner's own press release has an interesting spin:

    "After Two Years of Decline, Worldwide PC Shipments Experienced Flat Growth in Second Quarter of 2014, According to Gartner"

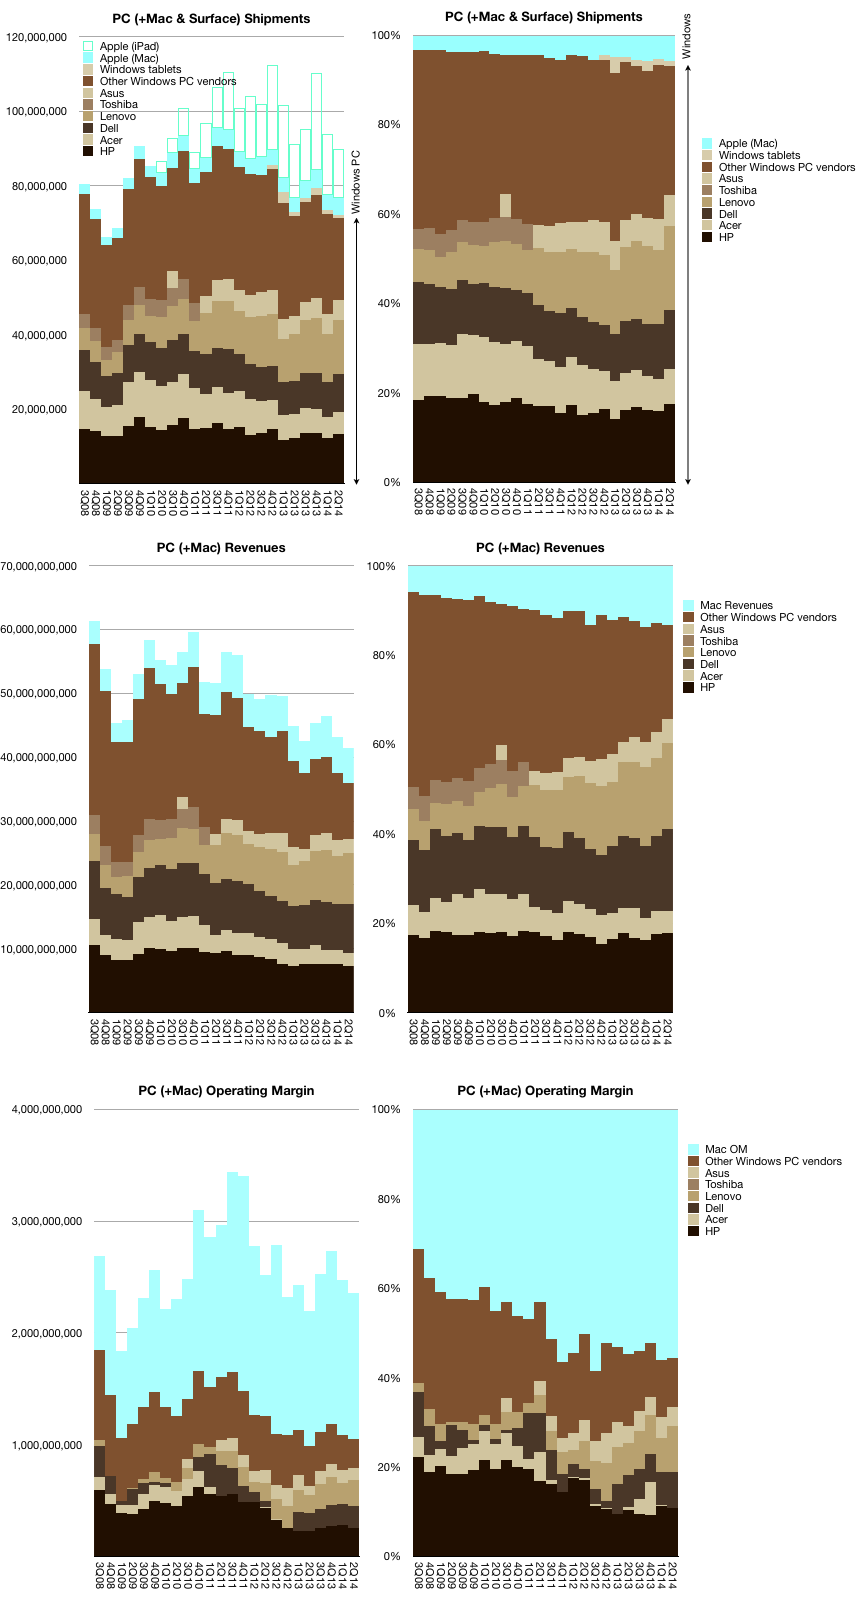
    Gartner's actual figure is 0.1% growth. Gartner and IDC measure slightly different quantities as "PC" but they don't disagree much. IDC still shows declining PC sales at about -1.7%. However both also include the Mac in their accounting of PC. If we were to remove the Mac and measure "Windows PC" ((In quotes because this total includes Linux and Chromebook)) Gartner's figures would show -0.8% drop in PC ex-Mac shipments.

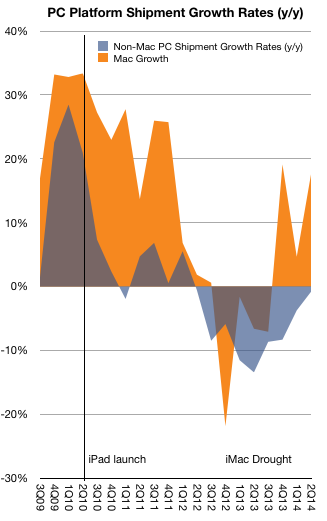
    The difference in growth between the Mac and non-Mac PCs is shown in the following graph.

    Screen Shot 2014-07-23 at 7-23-5.23.08 PM

    As Apple puts it, the Mac grew faster (and hence gained share) for 31 out of the last 32 quarters.  It missed on this perfect record during the fourth quarter of 2012 when the then fresh new iMac was impossible to buy due to production issues.

    So as far as the Mac is concerned the slowing of the decline in PC unit shipments isn't at its expense. What has been discussed as a cause for the moderation of market contraction is the expiration of Windows XP support. Certainly that seems plausible and is supported anecdotally. If it's true then the PC respite may be transient.

    To put a finer point on it, it would be useful to know  revenues and profits  in addition to volumes. Thanks to Charles Arthur for providing most of the data that allows this picture to be drawn:

    The revenue pictures shows that (non-Mac) PCs have been declining for almost four years and into the present quarter and operating margin ("profit") has shrunk to nearly $1 billion (while being generous with "other" PC vendors).

    Incidentally, the Mac is nearly the highest revenue PC brand and by far the most profitable. Indeed, it's more profitable than all the other vendors put together.

    If one includes the Mac, the PC industry may be limping along, but if we were to exclude it then this post conforms to Betteridge's law of headlines.

  11. Late late majority

    Research · 64 comments

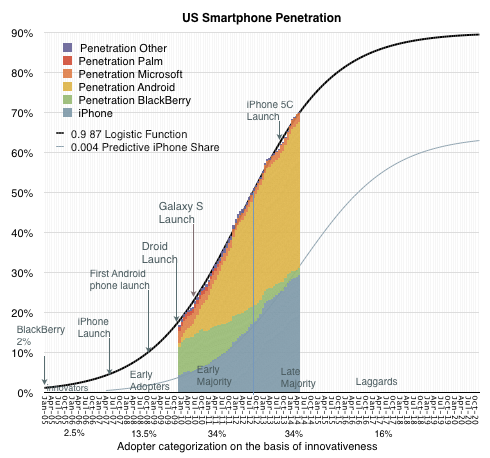
    Seven years after the iPhone was launched, 70% of the US population is using smartphones. Smartphones existed before the iPhone so the category is older than seven years but as far as adoption goes this is nearly the fastest ever.

    The CD Player reached 55% in seven years and the Boom Box about 62%. If measuring the period between 9% penetration and 90% ((which I consider the "economically attractive" period of growth)) the smartphone in the US will have a lifespan of about 9 years starting in 2008. Before this period, the product was largely experimental and participating vendors ((Palm, BlackBerry, Nokia)) mostly failed. After this period most products will be "commoditized" with decreasing margins and increasing consolidation.

    The rapidity of growth is all the more remarkable given the penetration is at the individual, not household level. The total user base is therefore over 270 million rather than the 115 million usually targeted by consumer technology, nearly 60% more purchases. This is also remarkable because the product has a shorter lifespan of use (two years) than is typical for other consumer technology products ((e.g. TVs, Refrigerators, Radios, etc.))

    We are therefore now in the "Late Majority" phase of the US market. This is not a surprise. The inflection point in the market occurred in mid 2012 so we've been in this phase for two years already. It's not therefore controversial to predict two years of continuing though decelerating growth.

    Screen Shot 2014-07-08 at 7-8-2.39.27 PM

    As Geoffrey Moore explained, the marketing of technology products needs to be varied as we get into different phases of the market. Innovators (first 2.5%) need to be sold on the premise of novelty itself. Early adopters (next 13.5%) seek status and exclusivity. Early majority (34%) seek acceptance and Late Majority (34%) seek pragmatic productivity. Laggards (last 16%) seek safety.

    One aspect of this adoption cycle that is misunderstood is the role of pricing. The assumption is that pricing matters more as adoption increases. This is misunderstood because pricing always matters and therefore it never matters. Pricing is one of many elements of marketing mix and at any time there are product choices across a wide spectrum of pricing. Pricing is also a signal which can be elaborately obfuscated through bundling and unbundling.

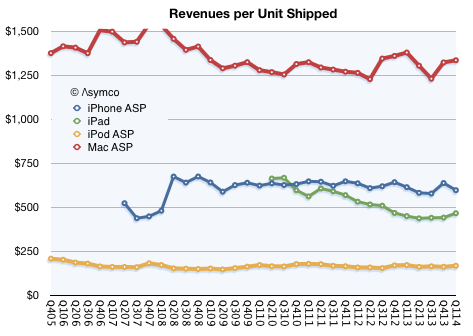
    One way to illustrate this is to consider how Apple products behave in the late phases of markets. Apple products have notoriously firm pricing.

    Screen Shot 2014-07-08 at 7-8-2.38.26 PM

    The revenue per unit of Macs, iPods, iPhones and iPads remains stubbornly consistent. This is not to say that each unit sold is the same price. The company tweaks "the mix" of mid, low and high products to keep the average selling price constant. But fundamentally the average remains constant which means that regardless of market phase, Apple retains its margins.

    So as we look forward to the last two years of growth for smartphones, how will Apple fare?

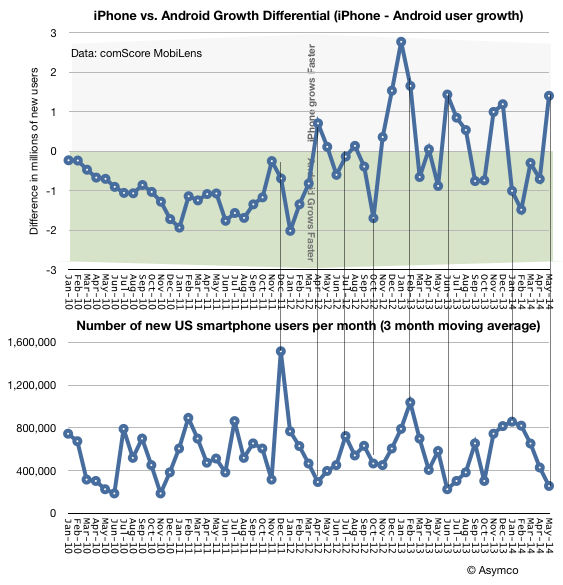
    There are weak signals that it will do rather well. I looked at two sets of data for clues: the number of new-to-smartphone users being added each month relative to the increase of usage of either iPhone or Android.

    Screen Shot 2014-07-08 at 7-8-2.40.19 PM

    [Edit: The title of the second graph above should be "Number of new US smartphone users per week (3 month moving average)"]

    What I'm looking for is a relationship between the rate of adoption of the overall product and the rate of adoption of iPhones. I measured the new-to-smartphone users as the change in user population (per week) and the preference for iPhone as a growth differential. ((iPhone growth in millions of users minus Android growth in millions of users. Positive data points suggest iPhone grew faster in a period and negative points suggest Android grew faster.)) The data shows no perceptible correlation between adoption rate and preference for either platform, however when looking closer there is a  periodicity to the addition of users, especially starting in 2012.

    The range is not insignificant, ranging from ~300k users/week to well over 1 million. The periods of growth of users could be due to new product launches or incentives and promotions done by the mobile operators. Whatever the reason, there is some flux.

    If we look at the corresponding adoption differential in platforms the relationship seems to be that peaks in adoption are matched to Android preference and troughs to iPhone preference. This might seem logical: after the 50% saturation point, when promotions are run by operators, non-consumers are drawn in and they tend to adopt the "low-cost" product.

    However, this is also paradoxical. Why, when we are in a late stage of the market, does the iPhone do well when users are not incentivized to adopt? The graph above shows that as we crossed 70% adoption, 1.4 million more users adopted the iPhone than Android.

    Even if we look out to the last six months, iPhone added 15.5 million late majority users while Android added 14.2 million. If promotions decrease for the "late late majority" and laggards then would the iPhone do even better relative to Android?

    The only answer seems to be that "low cost" is not what's driving this market. But then again, it never did. Towards the end of the "pre-smartphone" market the most wildly popular voice phone in the US was the RAZR. And it was a premium product.