Asymco

Asymmetric Intelligence

Market

  1. Competing effectively against your most potent competitor

    Research · 55 comments

    New market disruptions take root in non-consuming contexts. For instance, mobile phone photography began not because early phone cameras were good. They weren't good at all but good enough when a camera was not within reach. The quality was poor but the photo taken would not have otherwise been taken, making a lousy photo better than no photo.

    The result is that the total number of photos taken this year will be ten times higher than the total number of photos taken before the advent of mobile phone cameras. ((The total number of photos taken in 2014 is likely to be around 880 billion. Prior to 2000 the total number of photos ever taken is estimated at 85 billion.))

    This rush to use the phone as a camera has meant that phone makers are keen to improve their product (so as to compete effectively with it against each other) and as a consequence they overtake the incumbent camera makers in quality as well as quantity.

    The same phenomenon was experienced by fixed component "Hi-Fi" audio products. The quality of mobile music was poor but it was convenient and convenience translated into consumption and consumption translated into quality improvement and eventually the evaporation of usage of the traditional category.

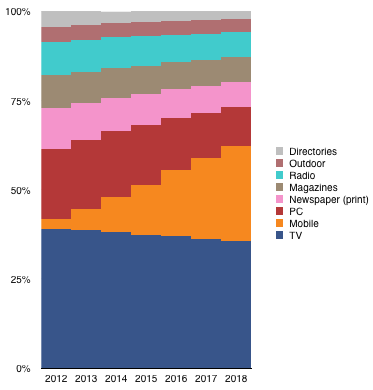
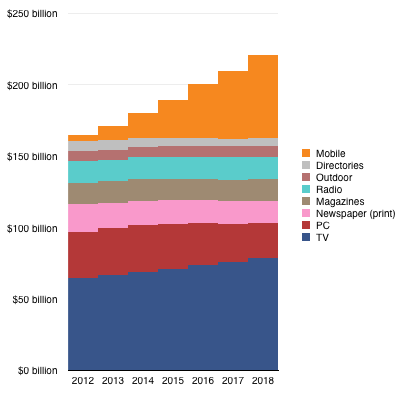
    Now consider how ad dollars are getting spent. The following chart shows the eMarketer forecast for ad spending mix across different media in the US.

    Screen Shot 2014-07-02 at 7-2-8.12.01 PM

    It would appear that the "Mobile" media is competing effectively against the other media types, especially the non-Mobile digital (i.e. PC-based experiences).

    However, if we look at the absolute spending forecast the picture shows that Mobile is responsible for most of the growth in the overall spending.

    Screen Shot 2014-07-02 at 7-2-8.13.10 PM

    In other words, Mobile is creating new consumption of ad spending. If the forecast is correct, it suggests that if Mobile was not an option, ad spending would probably remain flat.

    Mobile is capturing all the growth but it's also the creator of this growth. The reason for this is that people are consuming mobile (i.e. looking at their device screens) more without necessarily looking at other media much less. Mobile is effectively creating consumption and therefore competing effectively against non-consumption.

    Nielsen data backs this up by also citing that user "app time" on devices increased from 18 hours and 18 minutes per month in late 2011 to 30 hours and 15 minutes in late 2013.

    That's a lot of screen time which results in a lot more "inventory" of valuable ad space becoming available. Of course the ad buyers will buy the inventory. The value it provides is clear and they will increase their budgets to accommodate it. ((Note that the PC does suffer a decline in ad spending but it's not nearly as much ($8.5 billion drop) as Mobile's gain ($54 billion gain) ))

    Note that mobile phone makers did not set out to punish newsprint manufacturers. They did not set out to cause suffering for Canon or Nikon. They did not build devices to crush JVC and Pioneer or the myriad of music, photo, and print industry participants. They just wanted to make better phones.

    Because they focused on a job to be done that was not done well by alternative products they created consumption. They then used that additional consumption to expand into obvious adjacent use cases. The result was disruptive.

    There was no escape for the incumbents. The approach of making a camera into a phone would be doomed as would making an amplifier into an iPod. The outside entrant approach was the only way to "pivot" if such a pivot was even thought desirable.

    This is why non-consumption is such a difficult competitor to those in the business of serving consumers and a pushover for those in the business of doing something else altogether.

  2. Twenty Questions from Catalin Stelian Andrei

    Research · 17 comments

    Catalin Stelian Andrei, Editor of The Day, INTERNET PROTV asked me twenty questions:

    1. What phone do you have in your pocket right now? Why that model?

    I carry the iPhone 5. The last iPhone I bought was an iPhone 5C which I gave to a family member.

    2. Apple is going to launch, form all we know, an iPhone with a bigger screen, long after their market rivals. Is Apple one step behind, being forced to take this road in the fight with Android and Windows Phone devices? Because many smartphone users were hoping that an big screen iPhone, a redesigned model, will be lauched long time ago, and that didn’t happen.

    Making bigger phones is easier than making smaller phones. First because miniaturization has always been the most difficult engineering challenge, and second, because a smaller phone has a smaller battery making efficiency much more important. The larger the phone, the simpler it is. The third reason smaller is more valuable is that it’s easier to carry and use. The largest phones cannot be put in pockets and cannot be used with one hand. In the history of consumer, electronics size reduction has been the most consistent measure of performance, and the most rewarding. Usually the most exceptional reductions in dimensions create the highest price and profit bands. There have been niches for larger portable devices but they are consistently a small part of the overall market. If Apple were to introduce a larger device I hope they will be able to solve usability problems and make the category attractive to a larger audience.

    3. What do you expect from the new iPhone 6?

    I expect it to run the latest version of iOS and, with the new apps developers will ship, that should make the most impact in people’s lives. I imagine health maintenance and home automation will become valuable new franchises. Of course iOS 8 will also run on older iPhones, but I suspect the newest iPhone will somehow run the new software better and have smoother integration with services.

    4. What’s the “not to do” lesson that Apple needs to learn for the now iPhone from it’s own past experience or their competitors?

    The biggest challenge is to move rapidly with scale. The company has managed to grow from zero phones a year to hundreds of millions. That’s great but it’s still frustrating to wait one year for major improvements. The “cycle time” of innovation for Apple remains one year. I wish it could be faster but perhaps this is also too fast for some. In some services like maps and iCloud and iWork, which are independent of hardware (mostly,) speed is of the essence.

    5. The iPhone is the most expensive smartphone on the market right now. In Romania, it certainly is. But where does Apple gains it’s most money from, selling products to users or selling services, like iTunes, App Store? And having that in mind, what will be their next step: better – breakthrough products or bigger, more complete services?

    The answer to where a company “gets its profits” is best answered by asking where a buyer “gets his value” from the product. For instance you might answer the question of where a car company gets its value by saying that it’s from making people be in more than one place in a day. So the “differentiation” of a car is in answering the question slightly differently. If it’s hard to see a difference to this answer between cars then it’s hard for any one company to make a profit. For a company like Apple, we need to ask what its users value about the experience and why they are willing to pay for that. My hypothesis is that the brand's value is in making life a little bit easier. That’s what Apple competes on. Of course, some people are not willing to pay to have an easier life and some even want to make their lives more complicated so Apple’s proposal to make life easier, for a price, is not accepted by everybody—which is ok by them. But for many, paying for comfort, productivity and ease of mind is worth quite a bit. The reason Apple is able to gain a premium over the competition is that this value proposal (of paying for simplification) is either weak or non-existent for competitors. Indeed, many competitors compete on the basis of making life more complicated.

    6. What does innovation means for Apple right now? What are their options for assuring a next decade of success? A new Steve Jobs person or a Steve Jobs tipe of group thinking. How hard is that to achieve?

    Innovation is meaningful invention—bringing useful creations to a large number of people who then make use of that creation. The interesting aspect of making money from innovation is that it’s a rare phenomenon, requiring many disciplines to work together. It’s like a big movie that somehow works and becomes widely popular but costs little to make. Many movies are made, few are successful and very few of those which are successful are built at low cost. What we know about technology innovation is that it’s a combination that comes together under strong leadership but that leadership alone is not sufficient. The myth of Steve Jobs is that he was both necessary and sufficient to success. The truth is that he was necessary but not sufficient. To make successful innovations requires strong leadership and teamwork and a process of incentives and passion that is hard to create a formula for. How this works at Apple is its biggest secret.

    7. Who are the key Apple employees right now? Do they need another Jobs or do they already have him?

    All Apple employees are key. I would say that’s the magic formula. There is no chief magical officer (and there never was.)

    8. What will be the next best thing for Apple? […]

    I don’t know. It’s probably not knowable.

    … Are they capable of another breakthrough in the market?

    Yes. This is almost certainly knowable.

    9. Is the smart-home project something that will really happen in the next, let’s say, two decades?

    If the project requires replacement of existing infrastructure, it will not happen. If the project allows adding new items to existing infrastructure, it will almost certainly happen.

    10. Growth comes from the middle and low-end smartphones, according to IDC. Would or would not be a good idea for Apple to release a handset cheaper than the 5c?

    If Apple were concerned with growth then they should. But we have to ask why they avoided doing this six years ago. Not only was it obvious to do so but a portfolio strategy was the modus operandi for every competitor and had been for decades. The question isn’t why Apple does not broaden its line-up but why do the others diffuse their efforts and have such poor focus.

    11. What feature or software you think would be the main battleground in the future, in the smartphone market? Apps? Battery? Camera?

    Integration of all the above. When new experiences and services emerge those who are able to make them usable succeed. Usability requires integration.

    12. Who puts more pressure on Apple: Apple itself, Samsung, LG, HTC, Microsoft and Nokia? And how.

    I suspect competition is part of motivation but it’s not the entire story. Let’s not forget that Apple is considered to suffer from competitor pressure from software companies, services companies, media companies, hardware companies and everything in between. For instance, Apple is in competition with Microsoft, Amazon, Google and Samsung but the competition is not transitive. In other words Amazon is not perceived as being in competition with Samsung and neither is Google competing with Nokia. So somehow Apple should be sensitive to every perceived alternative to every aspect of its products. This quickly becomes an absurd idea. Apple is a system of things and systems can’t be compared with components.

    13. What is Apple’s sensitive spot today. What do you believe Apple fears the most?

    Losing people. The problem of retaining talented people is the most difficult challenge, especially when they become very wealthy due to the success of the firm.

    14. In 2012, you described the fall of Nokia in competition with Samsung at the Guardian Mobile Business Summit due to the disruption theory: the launch of the smartphone. Is Apple in danger of becoming a victim of the same story in the near future? What technology could replace the smartphone and when?

    Yes, every company is vulnerable to disruption. The defense is not to protect against it but to self-disrupt or enable self-destruction. Self-preservation is an instinct in humans so this is psychologically very difficult. The crisis comes not from a technology change but a business model change and that implies a cultural change. Companies embrace any and all technologies which sustain their business models and reject, resist and ignore any and all technologies which disrupt their business models. Changing business models is like a brain transplant; it happens so rarely that we can count it on one hand. By the way, because it’s so rare is why companies who attempt it are discounted by the market.

    15. You've been a Nokia executive. From this perspective, how do you see the deal with Microsoft and the future of Windows Phone and the Lumia brand?

    This is a long story. I can’t really do it justice now but I will say that it seems that Microsoft understands that they need to become an integrated systems company and not a component supplier. The same became evident to Nokia so they needed to merge.

    16. You've also worked with people from RIM. Do the have the capacity to innovate?

    Perhaps but scale also matters. RIM and HTC may not have the time to grow.

    17. Let’s imagine that no big company owns my personal information. If I wanted to sell that to someone, what would be the right price to ask? How valuable are individuals in the war for gaining personal information?

    The price of your personal information will be set by auction. It’s up to you to decide if you want to create a reserve price or to let the highest bidder win. As of today most people would trade all their personal information for almost zero price. This will not last and consumers will find out their value over time. I can’t predict how it will change but it will be a combination of offers being made and personal data catastrophes which will act as warnings.

    18. Do you believe in phoneblocks project from Motorola?

    Only people who want more complicated lives will want to build their own products. There are some such people (for example children) but they are not willing to spend a lot for that complication so the overall market for increasing complexity is small.

    19. The last question. What could trigger an Apple fall and when?

    The most common trigger for failure is success. To continue succeeding is very hard because motivation disappears. What can cause a crisis of motivation would be that there is a loss of belief that there are problems left to solve.
  3. How close is the UK to smartphone saturation?

    Research · 23 comments

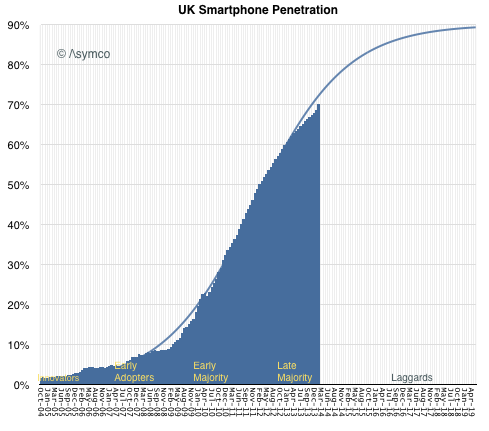
    In How close to saturation is the smartphone I highlighted that the US is not nearly saturated at 68.8% penetration at the end of March. Since the US is not the highest penetrated, one may wonder whether other "developed" countries are far further along.

    There is no data on all the countries in the world on the same resolution as that in the US, but thanks to Charles Arthur, Kantar shared data on the UK and we can have a clear trajectory for that country.

    The most recent data for UK was as of February 2014 when penetration was 70%.

    Screen Shot 2014-05-08 at 5-8-6.31.48 PM

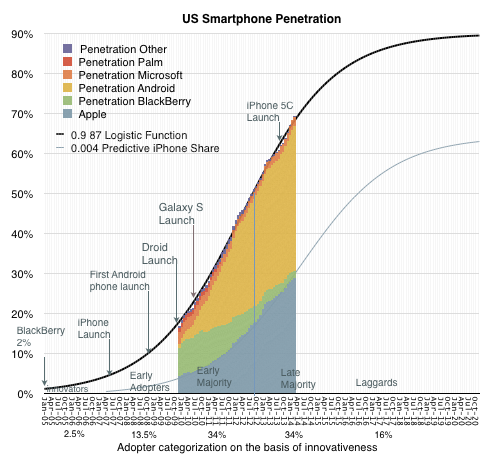
    In February the US figure was 68.2%, so the US is 1.8% behind in penetration. The equivalent picture of the US is below:

    Screen Shot 2014-05-08 at 5-8-6.34.23 PM

    Not a significant difference. Both markets are in the "late majority" phase of growth and well before the lagging adopters join.

    Note that I took a crack at forecasting both the US and the UK penetration given the significant amount of data we have so far. The asymptotic penetration value I chose was 90%. If the pattern holds then there is growth in both markets (and by proxy the developed world) well into 2018.

  4. Fortune 130

    Research · 74 comments

    The increase in net sales of iTunes, Software and Services in the first quarter of 2014 compared to the first quarter of 2013 was due to growth in net sales from the iTunes Store, AppleCare and licensing. The iTunes Store generated a total of $2.4 billion in net sales during the first quarter of 2014 versus $2.1 billion during the first quarter of 2013. Growth in the iTunes Store, which includes the App Store, the Mac App Store and the iBooks Store, was driven by increases in revenue from App sales reflecting continued growth in the installed base of iOS devices and the expansion in the number of third-party iOS Apps available. Net sales of digital content, including music, movies, TV shows and books, from the iTunes Store was relatively flat in the first quarter of 2014 compared to the first quarter of 2013.

    Apple Inc. Form 10-Q.

    During the last quarter Apple changed the pricing for iWork and OS X to zero ((OS X server is still priced at $20 and iWork for previously unlicensed devices and computers is still priced above $0)).

    I estimate the net effect to have been a reduction in revenues from those software titles of about $350 million for the quarter. Nevertheless, increases in services and app revenues means that the iTunes total reported revenues increased to a new record.

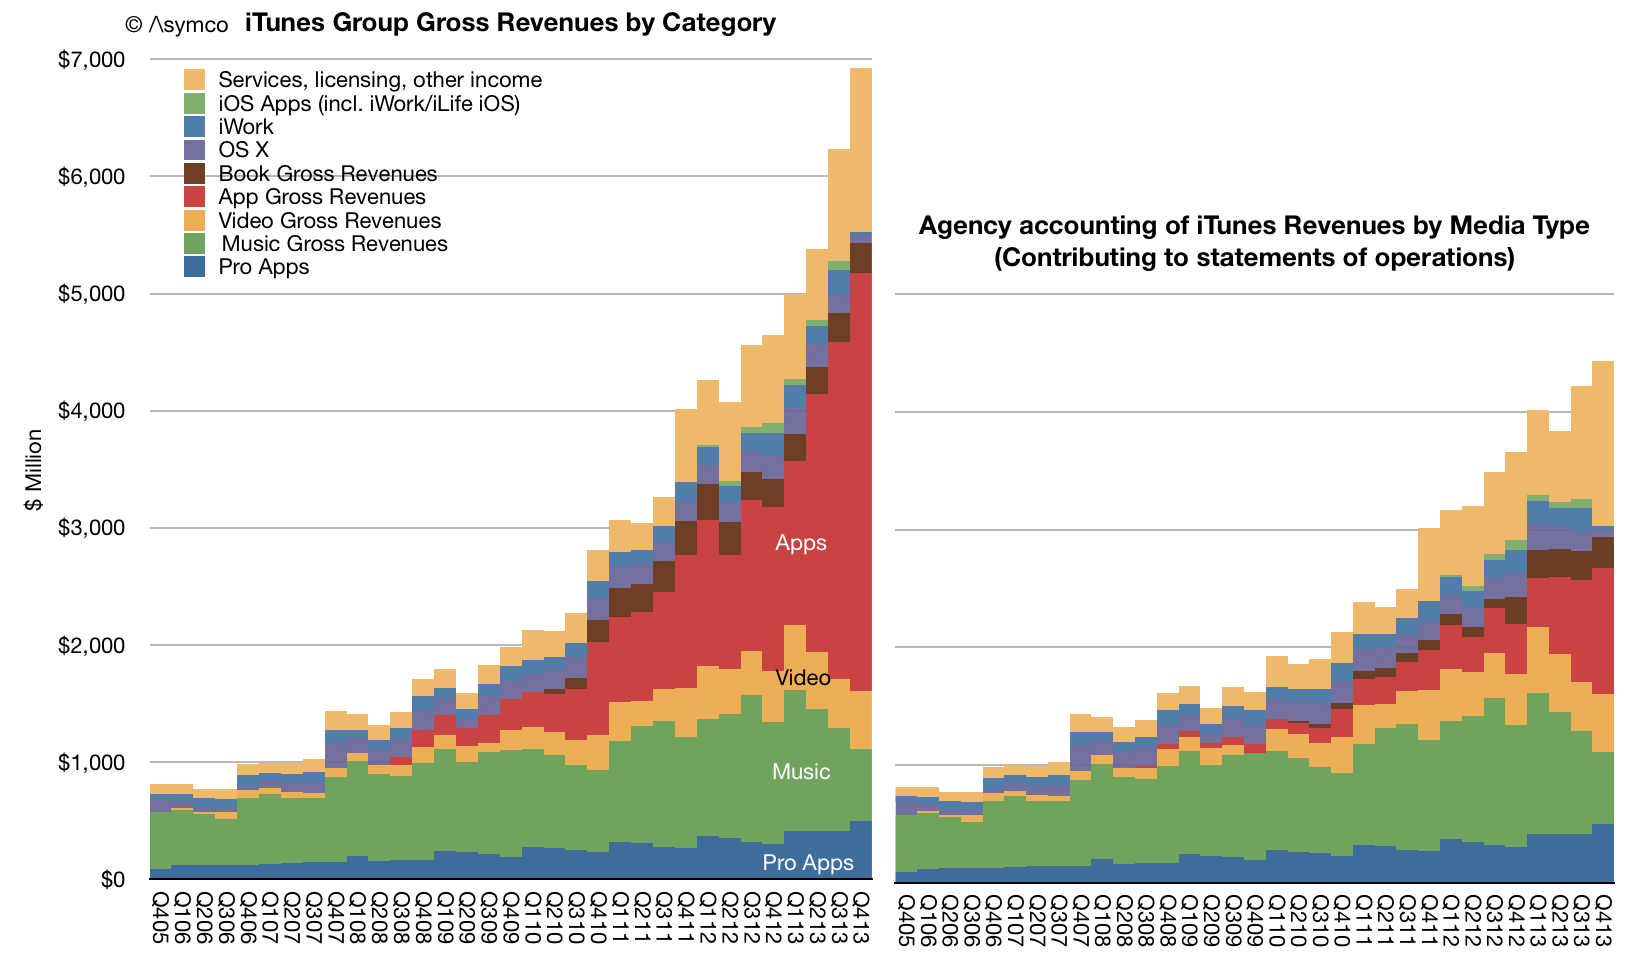
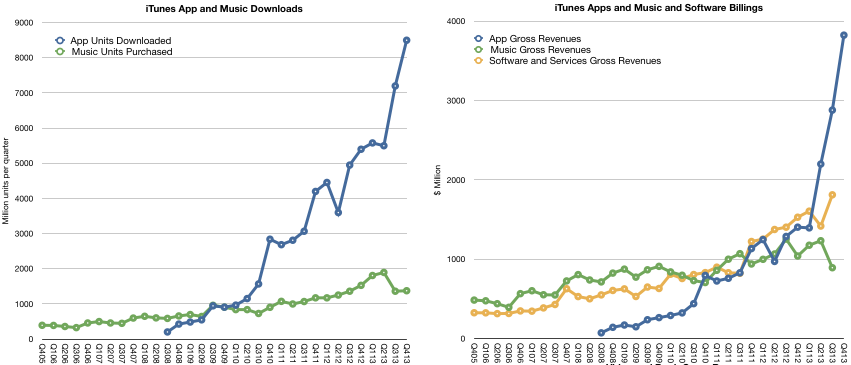
    The total with estimated contributions by media and service components is shown below right.

    Screen Shot 2014-02-10 at 10.05.11 AM

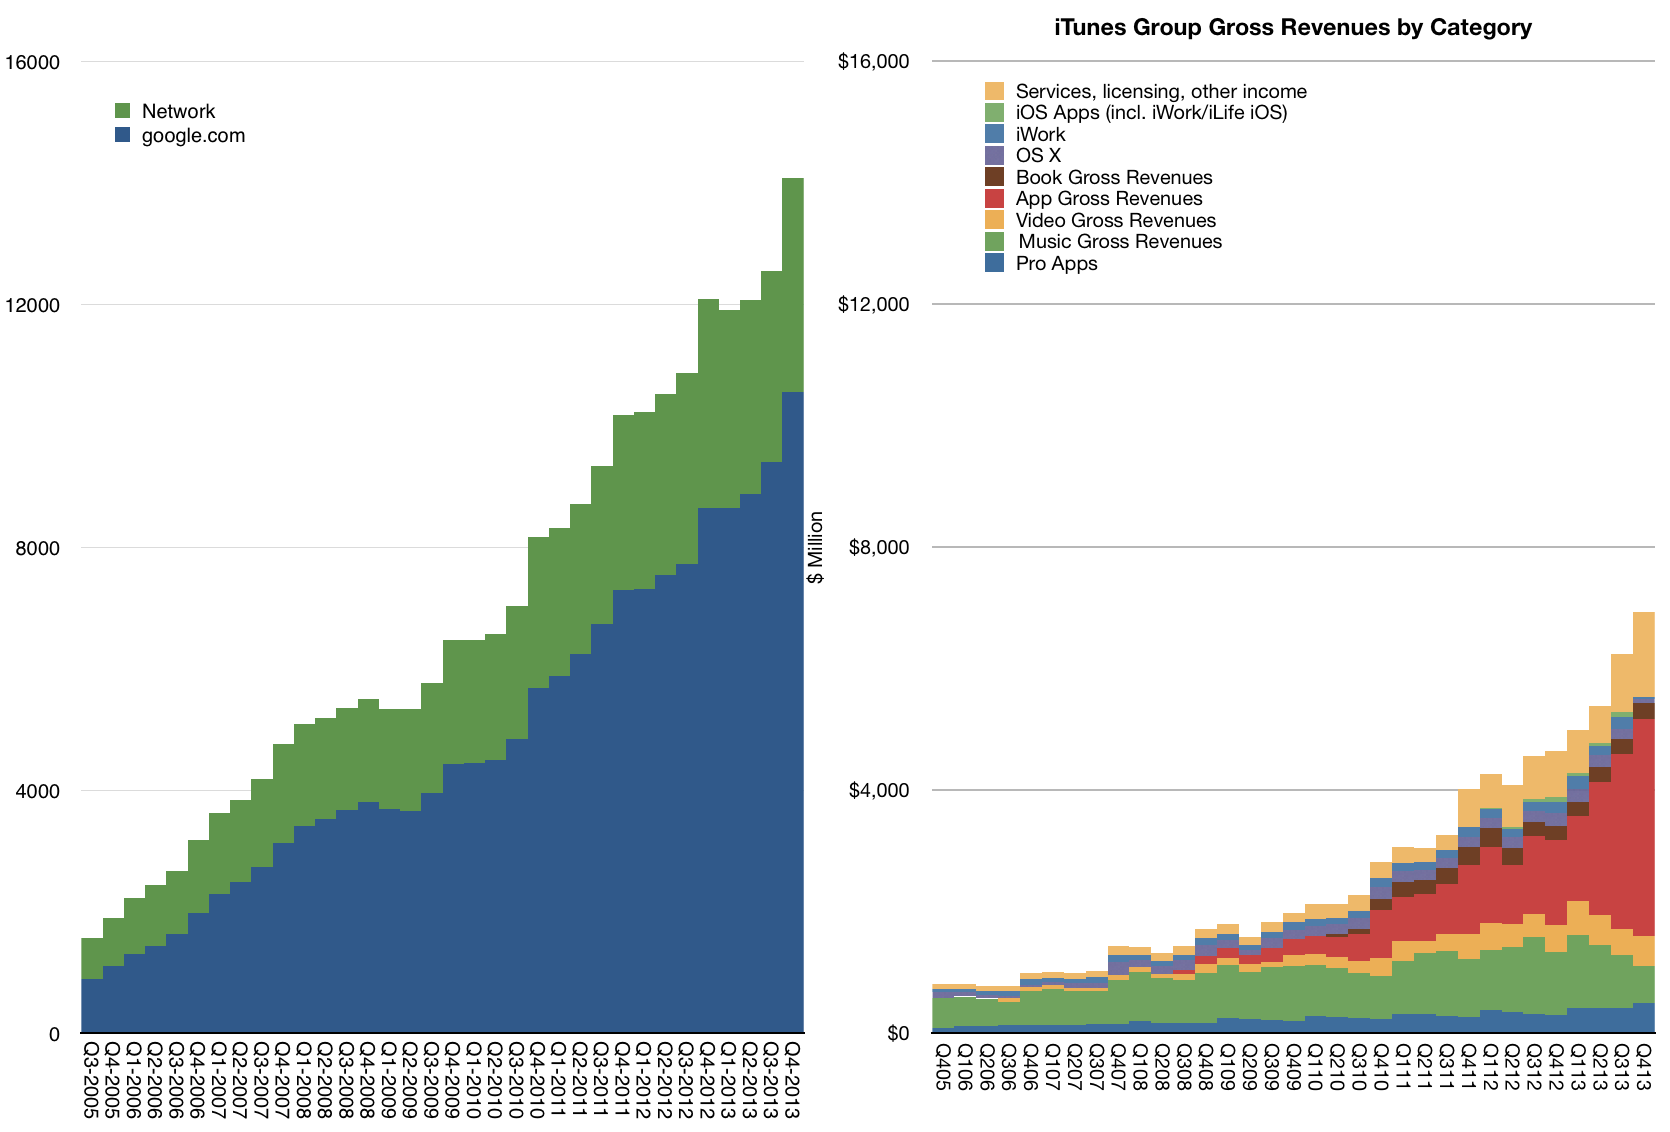
    Note that revenues do not reflect total billings. As Apple reports only the 30% of App transaction values, the full iTunes/Software/Services transaction values are shown in the above graph on the left.

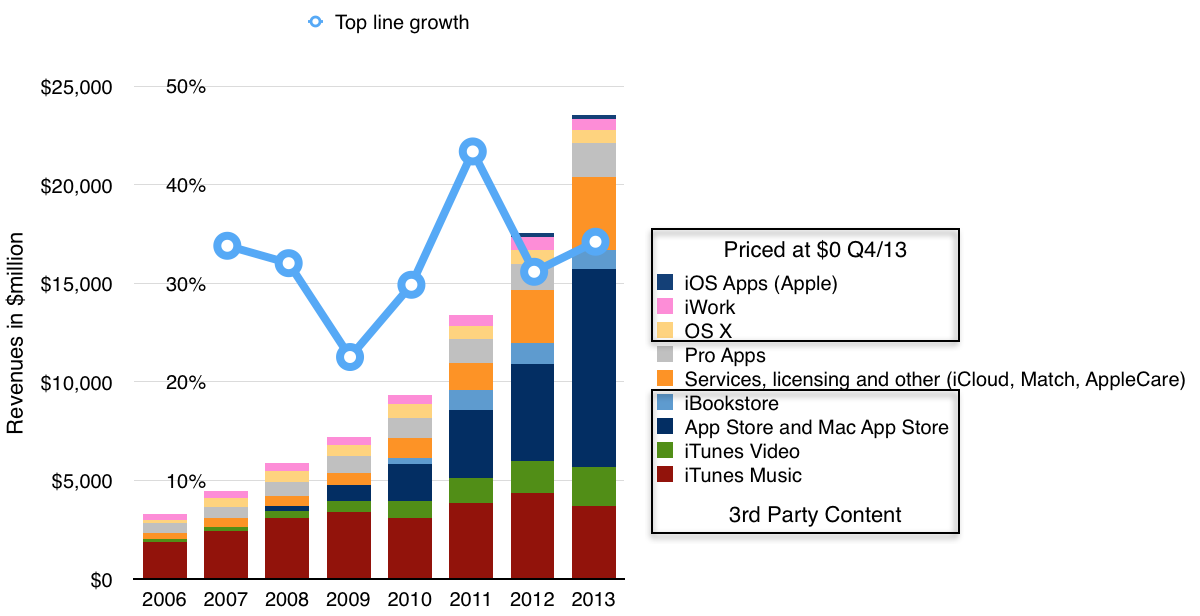
    The "gross" revenues are now nearly $7 billion per quarter. On a yearly basis the iTunes/Software/Services group had gross revenues of $23.5 billion with growth of 34% y/y.

    Screen Shot 2014-02-10 at 10.03.28 AM

    Other estimates for full year 2013 growth are:

    • Third party content +46.6%.
    • Music downloads -14%
    • Video +19%
    • Apps +105%
    • Books -9%
    • Services +37%
    • Pro apps +29%
    • OS X -8%
    • iWork and iLife -8%

    Although iTunes/Software/Services are not usually included in a "sum-of-the-parts" total contributing to Apple's overall enterprise value, the scale of volume and value of transactions is becoming harder to ignore.

    To illustrate this, I plotted the history of gross iTunes revenues vs. Google's search business ((Excludes Motorola and "Other" segments as reported by Google))

    Screen Shot 2014-02-10 at 10.03.55 AM

    On a yearly basis iTunes/Software/Services is nearly half of Google's core business and growing slightly faster.

    The iTunes "empire" of content and services would be ranked as number 130 in the Fortune 500 ranking of companies (slightly below Alcoa and above Eli Lilly).

  5. Of bits and big bucks

    Research · 89 comments

    Exactly one year ago, on January 7th, 2013, Apple announced that the App Store reached 40 billion downloads ((Unique downloads excluding re-downloads and updated)). Here are additional data points from that release:

    • 20 billion downloads in 2012
    • 2 billion downloads in December 2012
    • 500 million active iTunes accounts
    • 775,000 apps
    • sold in 155 countries
    • 300,000 native iPad apps
    • over $7 billion in developer payments

    This year, on January 7th, 2014, Apple announced a new set of data points:

    • $10 billion spent on the App Store in 2013
    • $1 billion in December 2013
    • 3 billion app downloads in December 2013
    • 1,000,000 apps
    • sold in 155 countries
    • 500,000 native iPad apps
    • $15 billion in developer payments

    The obvious:

    1. 225,000 apps were added in 2013
    2. 200,000 native iPad apps added in 2013
    3. App download rate for December increased by 50%
    4. No new countries were added in 2013
    5. $8 billion was paid to developers in 2013 (more than in all previous years put together)

    The less obvious:

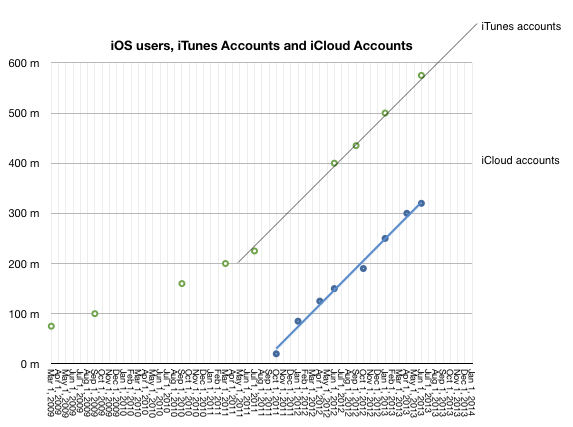
    1.  No update on iTunes accounts this time but there was a mid-year update (June 10th) which put iTunes accounts at 575 million. iTunes accounts have grown linearly since mid 2011 so it's quite probable that the current total is above 650 million. 
    Screen Shot 2014-01-08 at 1-8-9.28.41 AM
    1. Given mid-year updates to earnings/revenue and the October 22nd update that 60 billion total apps were downloaded and the May 15th update that 50 billion total apps were downloaded it's possible to estimate with confidence that there are now 68 billion total apps downloaded and that were about 27 billion app downloads in 2013. This is an increase of 35% in the yearly download rate. As noted above, the December growth alone was 50%.
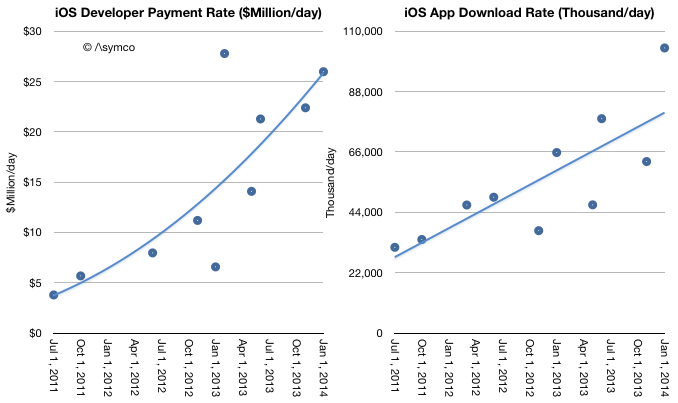
    2. Given mid-year updates on developer payments, and download rates we can estimate revenues per app have increased. As in-app purchasing has taken off it's no longer meaningful to assign a "purchase value" to each download. The rate of payments to developers is increasing faster than the download rate. Currently $26 million is paid out every day while about 100 million apps are downloaded daily. Note that the trend lines below are arbitrary: 
    Screen Shot 2014-01-08 at 1-8-9.41.18 AM
    1. As other reports have noted, there was a decrease in music downloads in 2013. This is also evident when backing into a download total for music given the earnings data and the above evidence of app growth. My estimates below may be overly generous for music unit downloads as they also assume lower pricing. Overall gross music revenues through the iTunes music store ((Excluding new iTunes radio and revenues from services such as Match)) are flat for the year and may even have begun declining precipitously. App revenues are more than compensating for this. 
    Screen Shot 2014-01-08 at 1-8-9.50.37 AM
    1. The iTunes content economy is grossing about $17.5 billion/yr. Apple's own software and services (reported as part of the iTunes segment) add another $6.2 billion/yr. The combined total of $23.7 billion/yr. is slightly lower than what Apple net sales were during its fiscal 2007 year or what Amazon sold in 2009.
    2. A complete report on the iTunes economy and pro-forma iTunes income statement is available for purchase at store.asymco.com.

    So much for the data. What is really happening?

    First, it's tempting to look at music and suggest that music downloads are suffering from streaming, just as it was tempting to suggest that CD buying was suffering from piracy (and later, downloads.) But this is falling into the trap of defining a product's use by the metrics used to measure transactions. These metrics are but a proxy for what consumers are actually doing with their time.

    Consumers have a fixed time budget, a more rigid constraint than their spending budget. Competition for a slice of a consumer's time budget is far tougher than competition for a slice of a consumer's wallet. So what's amazing is that apps have successfully grabbed a share of this time budget. I believe that the reason they succeeded is that they initially fit into niche time slices that were previously unoccupied. ((Interestingly, this was how music, especially digital music as enabled by the iPod, gained traction))

    Downtime or "boredom" was filled with app interaction. This includes some social media consumption. These are not immersive experiences. They are "casual",  inconsequential and trivial. At first anyway. And that's the rub. As apps enter a consumer's world they initially take on non-consumption, which is easy to beat. But as the experiences become increasingly compelling they "move upmarket" and compete more aggressively with existing media consumption patterns.

    For instance, one might allow casual gaming to take root in non-consuming contexts such as commuting, waiting, and escaping time niches. But if the experience becomes addictive, the gaming takes over time previously spent watching TV or using console games. The same can be observed for app-based experiences of social media, shopping and chatting.

    This is the insidious march of a disruptor. It gains a foothold in a context where it has no competition and then relentlessly gets better, eventually displacing the far better suited alternatives. This is what I believe is happening with apps. They are asymmetric in their competition with established media and as a result they are easily ignored and brushed off as irrelevant competition. That is until the incumbent media sees a sudden drop in consumption. Even then, the culprit blamed is not the upstart but some structural issue.

    Music would appear less vulnerable to this app-based substitution because it's an eyes-free experience and can be easily consumed concurrent with another activity. There is however, a subtle de-emphasis and hence devaluation of the experience as it fades into the background. The "job it's hired to do" changes.

    Second, and relatedly, the other meta-observation is that apps are media. They are produced, marketed and priced in ways analogous to other media types. This has implications for the artist/producer/creator. For them movement into apps is natural and effortless. It's how developers moved into them without thinking twice. Trouble is that this transition is not at all simple for those who distribute media.

    I tweeted that the media industry deplored the shift of "digital pennies for analog dollars" ((Original quote was made by Jeff Zucker, president of NBC Universal, in 2008 in reference to the future of TV)) as the packaging of their product changed. The angst and trauma suffered by the media industry when dealing with what could be seen as a trivial change in the encoding of content are the stuff of lore and legend. Moving to apps could be even more troubling. Mainly because there is already a distribution channel in place. And it's owned by a set of companies whose motives and business models are completely different.

    The app economy shows that there are big opportunities in "digital pennies" and that the figures are beginning to match even the "analog dollars". In fact, I suspect eventually digital pennies will dwarf analog dollars. The trouble is that these pennies will not be earned at the same control points. Bits are already big bucks. They're just not the bits we are used to.


  6. When will the migration from PCs be complete?

    Research · 129 comments

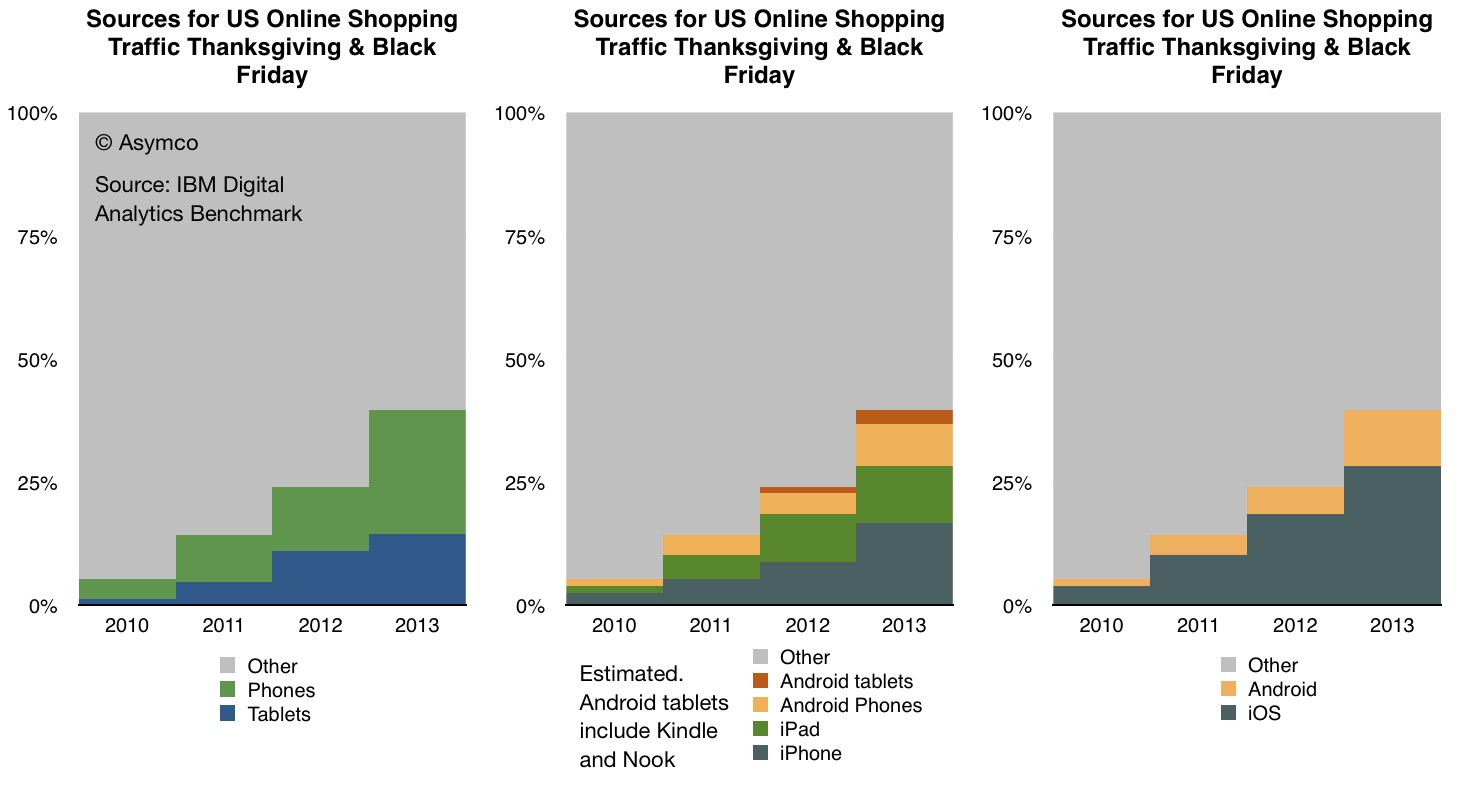
    IBM Digital Analytics Benchmark (report is here) has published, for the fourth year in a row, US online shopping traffic data with a split between mobile and fixed online traffic. It reveals a pattern of consumer behavior which is quite startling: people seem to prefer to shop using mobile devices.

    The data is shown below:

    Screen Shot 2013-12-02 at 12-2-6.45.34 AM

    In terms of sources of traffic, mobile devices (including tablets) have increased from about 5% of all online traffic to 40% in four years. Last year the volume was 24% implying that 16 points of share were gained in one year. If that is extrapolated to next year then more than half of holiday shopping traffic in 2014 will be on mobile devices.

    Put another way, next year less than half of users will hire a PC for the job of online shopping.

    If this conversion from PC-based shopping to device-based shopping follows a logistic substitution curve then the conversion to devices will probably be 90% complete in another 5 years or by 2018 or 2019. I see no reason why this particular job to be done (shopping) should not be considered a proxy for other jobs as well. Therefore it's not a stretch to imagine that the transition to post-PC consumption will also be practically completed by 2020.

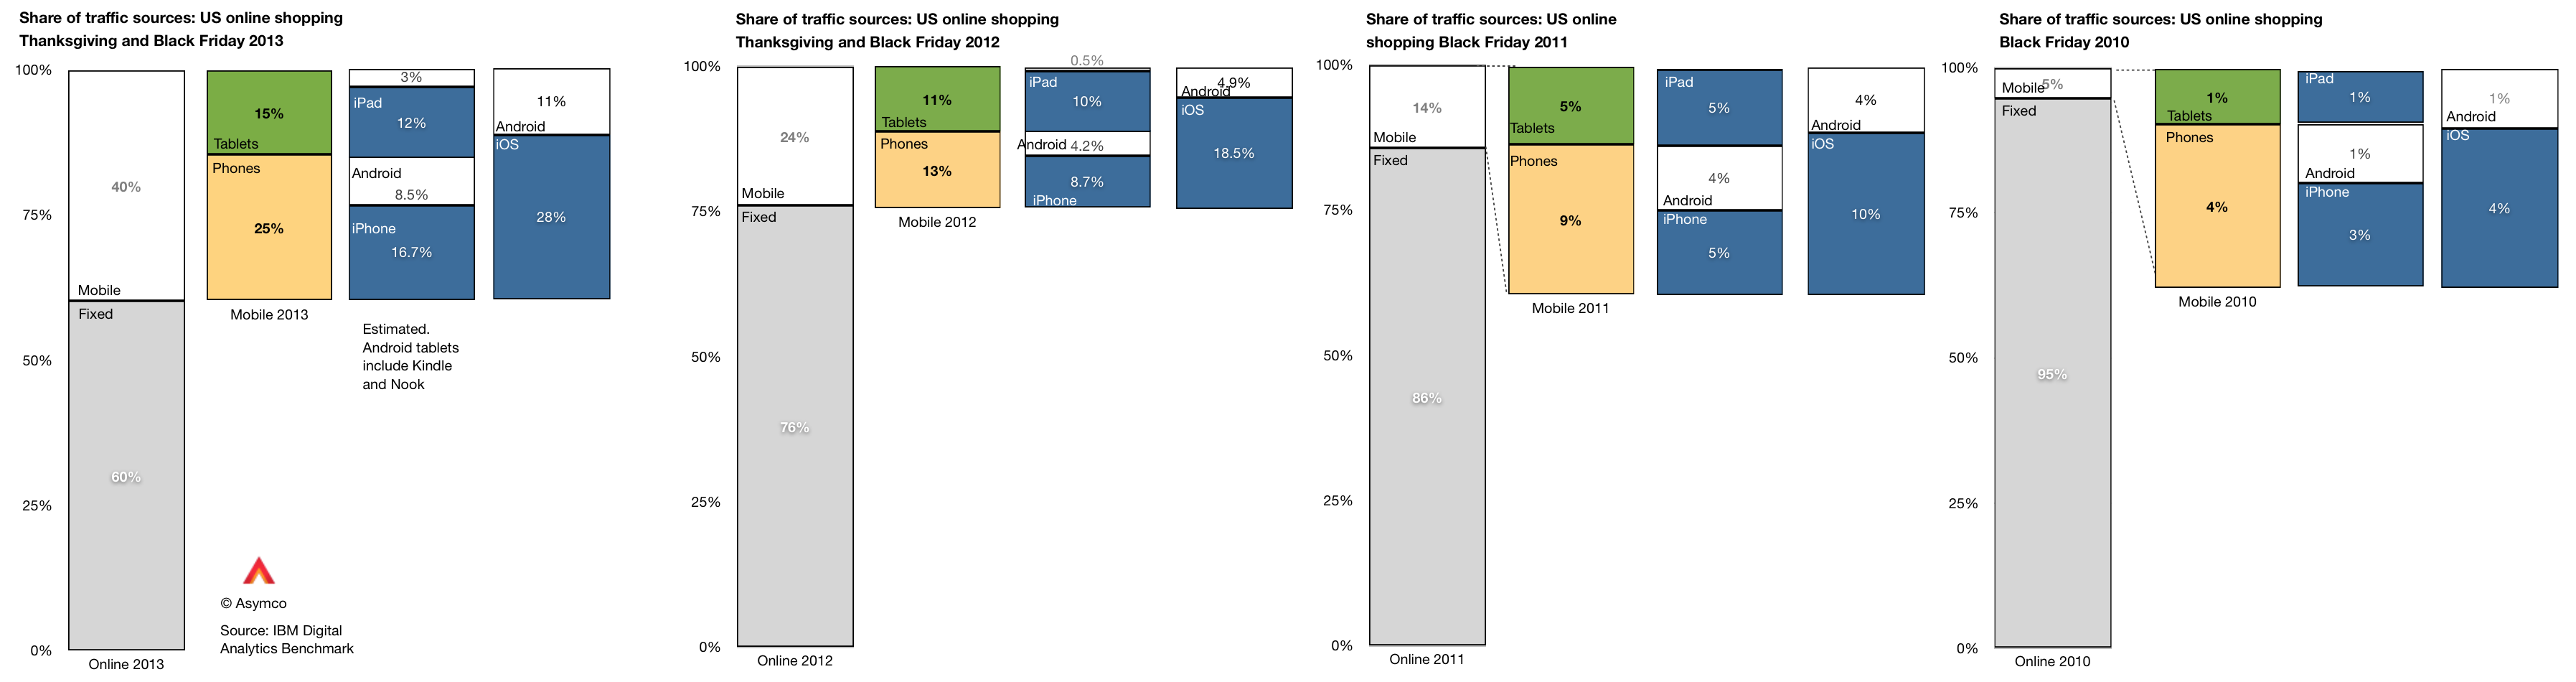
    Within the data there is also a significant amount of detail beyond the mobile/non-mobile split in behavior. There is a distinction drawn between tablet and phone traffic and a further distinction between Android and iOS devices. ((The split between Android and iOS for tablets and phones was not published for 2013 but I extrapolated from previous years and assumed that 80% of tablet traffic was sourced from iPads vs 88% in 2012 and 99% in 2011. Note also that non-iPad traffic is assumed to be Android but that includes the Kindle and Nook products which are using partial and unsanctioned versions of Google's Android.))

    This more detailed view of the traffic is shown in the following diagram:

    Screen Shot 2013-12-02 at 12-2-7.00.20 AM

    A few observations:

    • The pattern of slowing tablet growth is likely due to the slowing growth in iPad sales. This itself is due to the lull in product launches as the shift to fall only iPad releases took place in 2012.
    • The consequence is that iPad traffic contribution only increased by 2 percentage points, from 10% in 2012 to 12% in 2013. Compare this with the doubling the previous year (from 5% to 10%).
    • Among phone users, both Android and iOS grew their contributions to traffic by roughly 100%. Android phone traffic increased from 4.2% of all traffic to 8.5% and iPhone traffic increased from 8.7% to 16.7%.

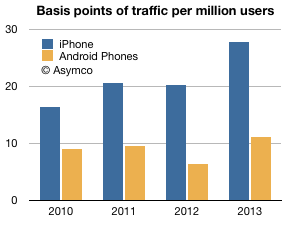
    As we also know the approximate number of phone users for each platform (via comScore) then we can also determine the per user contribution of traffic of each platform. ((Note that this is phones only.))

    The measure is "basis points of traffic per million users" and it is the result of taking the traffic data (in percent of total online traffic) and dividing by the population of users of a particular platform. The result is shown below:

    Screen Shot 2013-12-02 at 12-2-3.05.53 PM

    The way to read it would be that each million iPhone users generated about 28 basis points of traffic while each million Android users generated about 11 basis points of traffic.

    A way to compare these audiences would be to define the ratio between traffic usage by platform user. That ratio was

    • 1.83 (iOS:Android) in 2010
    • 2.16 in 2011
    • 3.15 in 2012
    • 2.51 in 2013

    So, as far as phones are concerned, US iPhone users are about 2.5 times more likely to shop online than US Android phone users. The data is reliable: with the US population now over 65% penetrated with smartphones, these populations of users (totaling over 130 million) are vast and representative. As the technology is reaching deep into the late adopter segments the difference in behavior between iOS and Android usage is becoming easier to explain. We have to eliminate quirks of demographics or income or other possible causes.

    The platforms themselves are becoming the last remaining suspects as causes for differences in the behavior of their users.

    It may seem preposterous to suggest that a platform can affect shopping behavior but let's remember that the PC, the subject of this article, is a platform in itself. The migration of usage away from the PC to alternatives can only be explained by the alternatives being superior at the particular job that needs doing. The argument is naturally extendable to each alternative individually.

  7. What's an Active User worth?

    Research · 86 comments

    Apple has sold 700 million iOS devices. Google claims one billion Android device activations. Microsoft has about 1.5 billion Windows users and Facebook about 1.19 billion. LinkedIn has 259 million users and Twitter has 232 million. Amazon has 215 active account holders and PayPal 137 million.

    Markets place a value on these users implicitly when company shares are priced. For example, Twitter whose users are worth about $110 or FaceBook's $98 and LinkedIn at $93.

    This consistency suggests a universally accepted value per social media user but what is the value of an ecosystem user? Apple, Google, Microsoft and even Amazon aspire to enable ecosystems which should be seen are more valuable than mere communities. Ecosystems enable a higher level of economic activity because they are unbounded by the medium itself. Any number of media can be created. Or so the theory goes.

    If we could determine a value for an ecosystem user we could test it against the going value of a social media user. Fortunately we have enough data to do so.

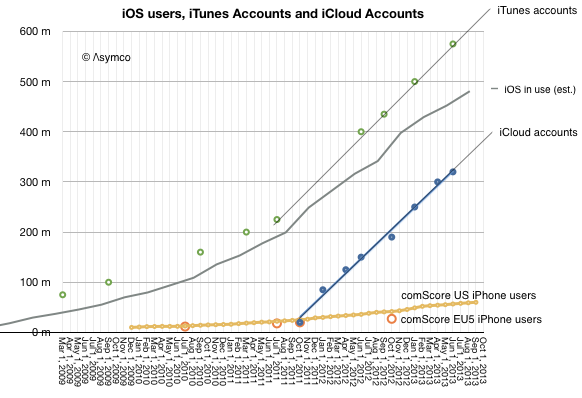
    The total number of iOS devices sold per quarter allows us to measure the install base of device users. With some assumptions regarding the retirement and attrition rate we can get the following history:

    Screen Shot 2013-11-11 at 11-11-11.52.34 AM

    Since the total number of iTunes accounts is updated with some regularity I've added it to the graph. I've also shown on the same graph the total number of iCloud accounts. For calibration, I included survey data showing the number of iPhone users in two regions (US and EU5).

    These combined graphs give us an upper bound of active users (iTunes accounts) and a lower bound (iCloud) calibrating our device-based estimate. The regional iPhone data offers some additional test on growth.

    The result is "about 500 million" ((482 million by my count but with quite a bit of margin of error)) with a growth of about 11 million per month.

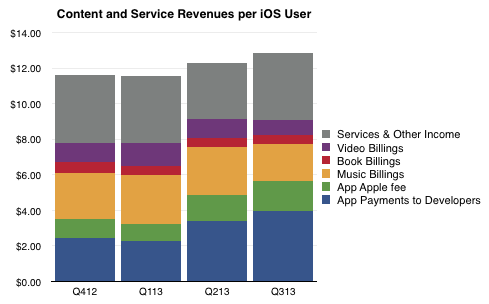
    So if we know with some confidence that there are about 500 million active users as part of the iOS ecosystem, how do we know how much value they generate? The answer is in the consolidated iTunes revenues as reported by Apple: $4.26 billion/quarter. With some attention to the reported media retail and purchases, the following picture of the average iOS user's quarterly spending emerges:

    Screen Shot 2013-11-11 at 11-11-11.50.23 AM

    The bottom line is that in the last 12 months the average iOS user contributed  about $48/yr to the ecosystem via Apple's own properties. They also bought the device and paid for cellular service in most cases. They may also have engaged in quite a bit of browsing and online purchases which fed other ecosystems. But as far as Apple is concerned, it transacted about $48 per user.

    As Twitter revenues last year were $317 million, the Twitter user today generates about $1.36 of revenue per year or one thirty-fifth of what an iOS user generates through iTunes and iCloud alone. And note that the number of iOS users is about twice that of Twitter.

    Of course one could argue that the iOS user's participation is not profitable for Apple. It does obtain massive cash flow from iTunes which finances its fashionable data centers and bandwidth but it does not presume to value itself primarily through this revenue.

    Or at least the market doesn't think so. We don't hear much about how Apple is worth so many dollars per user. ((I suppose the corollary to this is that Apple users are disloyal or fickle or fleeting, and quite contrary to observed behavior.))

    The paradox is that while the device which enables this commerce is where Apple guides the consumer's perception of value, markets discount devices and bid up services. In other words, users continue to pay for the devices which delight them enough to participate in services (especially the monthly billable kind) but markets walk right by these shiny baubles and and shower money on services which have negligible sales and even fewer profits. There must be some serious misdirection going on here. The question is who's being fooled.

  8. Owing how much to how few?

    Research · 7 comments

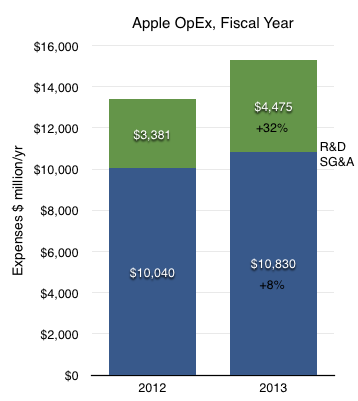
    For the year ending October Apple's R&D costs were $4.475 billion. These costs have been rising. Though, as the company explains, not faster than net sales:

    The growth in R&D expense was driven by an increase in headcount and related expenses to support expanded R&D activities. Although total R&D expense increased 32% and 39% in 2013 and 2012, respectively, it remained fairly consistent as a percentage of net sales.

    [My emphasis]

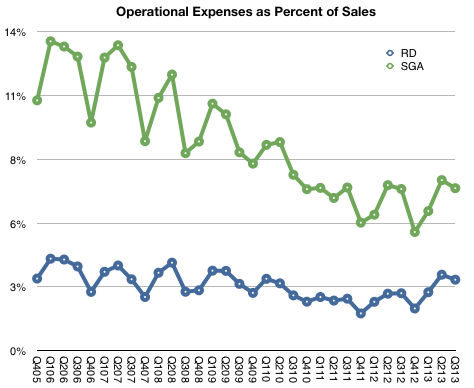
    We can see this in the following graph:

    Screen Shot 2013-11-01 at 11-1-4.37.48 PM

    R&D has remained very nearly 3% of sales since at least 2005.


    SG&A Expenses barely grew however:

    The growth in SG&A during 2013 was primarily due to the Company’s continued expansion of its Retail segment and increased headcount and related expenses, partially offset by decreased spending on professional services.

    The change in R&D and SG&A on a full-year basis is shown below.

    Screen Shot 2013-11-01 at 11-1-4.42.06 PM

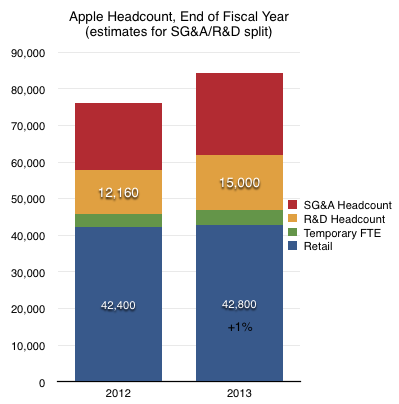
    I emphasized the mention of increases in headcount. We cannot know with any precision what portion of last year's $15 billion in operating expenses went toward wage expenses since there are other costs such as advertising ((Apple's advertising expenditures for fiscal 2013 were $1.1 billion or 10% of SG&A or 0.64% of sales.)) commissions and public relations in the case of SG&A and outside services, equipment leases, in the case of R&D. However, it's more likely that wage expenses are a far larger proportion of total R&D than they are of SG&A.

    My estimate, based on wage rates, is that there are approximately 15,000 R&D staff at Apple.

    Screen Shot 2013-11-01 at 11-1-4.42.49 PM

    If we divide sales by this number we get $11.4 million in sales per engineer.

  9. How many smartphone users will there be in the US?

    Research · 42 comments

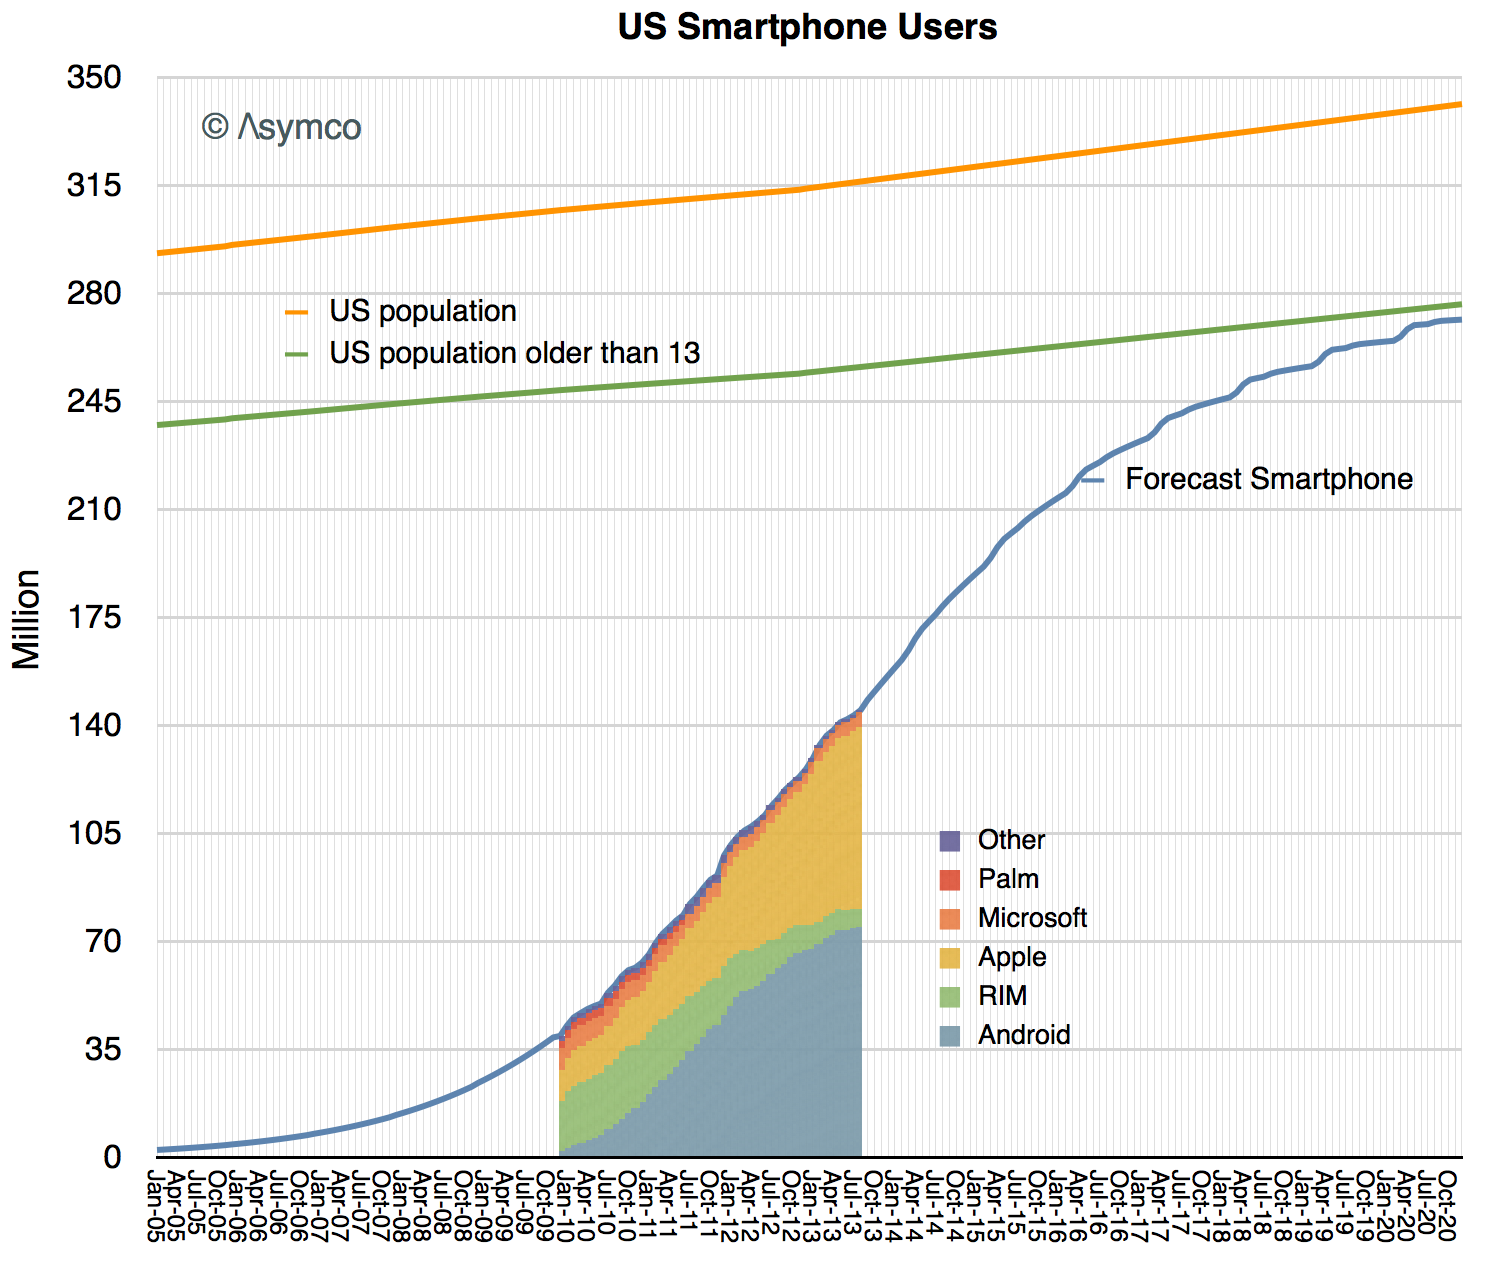
    In yesterday's post forecasting smartphone penetration I neglected to mention the exact subset of the US population being sampled. The analysis is based on comScore's sampling which covers only those devices which are the "primary phone" for users  over 13 years old and not provided by an employer.

    In other words, the population being sampled is not meant to identify how many phones will be in use but rather what is the primary phone for those non-children who choose their own phones.

    So the measurement that can be obtained from the S curve analysis is a subset of all phone users and will not identify exactly how many phones will be in use. Given that, this is what that subset looks like:

    Screen Shot 2013-10-08 at 10-8-9.41.00 PM

    I drew a line showing the census data (and projection) for the US population and estimated what percent of that population might be older than 13 years ((I estimate 19% of the population is 0 to 13 years of age.))

    Of the remaining population, I expect smartphones will be used by nearly all by end of 2020.

    That means about 270 million users. It also means that about 125 million more than are using smartphones today. Note also that a significant number of those under 13 will also use smartphones and that the metric is "primary phone" and insofar as there are more than one phone for some users they are a multiplicative factor. Finally this measure does not account for company assigned devices.

    So although this measures how many users will use smartphones, the total number of such phones in use is likely to be significantly higher.

    Finally, when considering the market's potential size it's important to have an accurate estimate of how frequently these phones are replaced. So, for instance, if we guess that 300 million smartphones will be in use and that they get replaced every 2 years then it follows that the US market for smartphones would be about 150 million units per year in 2020.

  10. The figurative sales of iPhones and BlackBerries

    Research · 32 comments

    The most interesting juxtaposition in market data happened this week.

    Apple announced 9 million units of the iPhone 5s/c sold in their opening weekend while BlackBerry recognized 3.7 million smartphones sold in the three months ended August 31.

    I will state these data points with a different emphasis:  while Apple explicitly reported, both in a press release and in an SEC filing, Sales of 9 million units, BlackBerry reported recognition of revenues on 3.7 million units.  At the same time BlackBerry also reported sales to end users of 5.9 million units.

    So, did Apple sell 9 million iPhones in three days? What about units ordered and not delivered? Which of these units will show up in the company's income statement? Conversely, did BlackBerry sell 3.7 million or did it sell 5.9 million smartphones in three months?

    The answer is dependent on what constitutes a sale. I suggest re-reading the Sold and Shipped: A Brief Introduction post from last year. Understanding is complicated by many factors, not least of which could be intentional signaling by management. We may never come to a perfectly matched comparison of the two companies' situations but our job as analysts is to see through the signals and obfuscating language and interpret a pattern. A pattern that extends over a time and helps us learn.

    My observation is one of contrast. The juxtaposition this time is that Apple emphasized sold and not shipped while BlackBerry sold more units to end users than it recognized revenue. These signals reflect precisely the inverted fortunes of the two companies.

    For BlackBerry the higher sold than shipped recognition was due to a product launch failure. Units which were shipped (and recognized as revenue) last quarter did not sell and the company is not only writing off the inventory but has drastically reduced its deliveries of new units in order to drain inventory. The company explains:

    During the second quarter the company recognized hardware revenue on approximately 3.7 million BlackBerry smartphones. Most of the units recognized are BlackBerry 7 devices, in part because certain BlackBerry 10 devices that were shipped in the second quarter of fiscal 2014 will not be recognized until those devices are sold through to end customers. During the quarter, approximately 5.9 million BlackBerry smartphones were sold through to end customers, which included shipments made prior to the second quarter and which reduced the Company's inventory in the channel.

    The company is essentially saying that due to the unusual circumstances of a product launch failure, they will change how they account for their business. They don't have the confidence that units shipped will actually sell and will not recognize them since they fear they will have to write some off. They are signaling: They are being far more conservative, not reporting shipments alone because those shipments could essentially be value free.

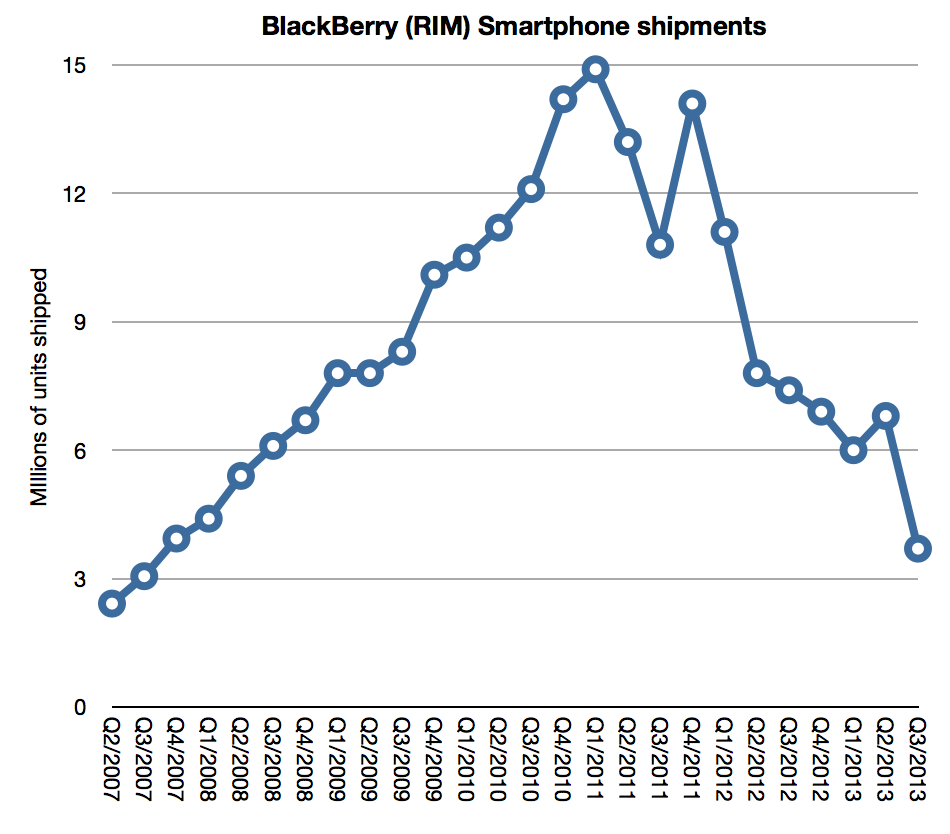
    When seen as a pattern, the new figure on recognized revenue units needs to be shown relative to the history of recognized revenue units.  

    Screen Shot 2013-09-27 at 9-27-9.59.29 AM

    You can see the instability in volume recognition in the graph as a clue. Product launches cause erratic changes in what was previously a seasonally stable business. This is, essentially, the company being thrown onto its back foot. It is staggering from an unexpected blow and resetting expectations.

    Now note the contrast with Apple. Apple provides every quarter shipment data on all its products. This is consistent with generally accepted accounting principles and consistent with reporting from other companies. ((Though many, e.g. Samsung, Google, refrain from reporting shipments any shipment data at all.))

    Apple also offers "channel inventory" data on select products. This inventory data, when coupled with shipment data, offers insight into how many units are actually purchased by end users. If Apple runs a tight ship then its inventory is relatively low but if it has a reliable customer base that of its channel is also low. Moreover, if it can predict sales well then it avoids overfilling the channel and having to take a hit while draining it.

    In that context the way the company reported the 5c/s launch is signaling optimism:

    On September 23, 2013, Apple Inc. […] announced that it has sold over nine million new iPhone 5s and iPhone 5c models, just three days after the launch of the new iPhones on September 20.

    Apple expects total company revenue for the fourth fiscal quarter to be near the high end of the previously provided range of $34 billion to $37 billion, and expects gross margin to be near the high end of the previously provided range of 36% to 37%.

    The SEC filing language above refers to the following press release:

    Apple® today announced it has sold a record-breaking nine million new iPhone® 5s and iPhone 5c models, just three days after the launch of the new iPhones on September 20

    “This is our best iPhone launch yet―more than nine million new iPhones sold―a new record for first weekend sales,” said Tim Cook, Apple’s CEO. “The demand for the new iPhones has been incredible, and while we’ve sold out of our initial supply of iPhone 5s, stores continue to receive new iPhone shipments regularly. We appreciate everyone’s patience and are working hard to build enough new iPhones for everyone.”

    The reporting of sales after a launch weekend has been a staple of Apple's communications about product for a long time. Therefore the evaluation of this performance should be made in comparison with previous launches.

    But it's not necessarily a statement of end user purchases. Nor is it a statement purely of shipments. The term "sold" as used in a press release is not an accounting term and it is not something which is meant to be audited.

    However, none of that matters. The signal is what should be observed. By deliberately and repeatedly using the word "sold" Apple is expressing confidence that demand for its products is strong. Sure, there is channel inventory in that 9 million unit number but there are also ordered devices which have not been shipped and thus are not counted as sales. There are also depleted store shelves and people angry about not getting their desired phone model. Apple knows this, Tim Cook is making it clear they know this. They have excellent visibility into the distribution of their products. They have excellent inventory management. They are typically conservative in their financial reporting.

    So why would anyone interpret Apple's release as a negative signal? If you want an example of a negative signal, look at how BlackBerry reported its launch performance.

    When interpretation of a signal is very different from the literal statement, it says more about the interpreter than about the company.

  11. iPhones 5c and 5s launch performance illustrated

    Research · 194 comments

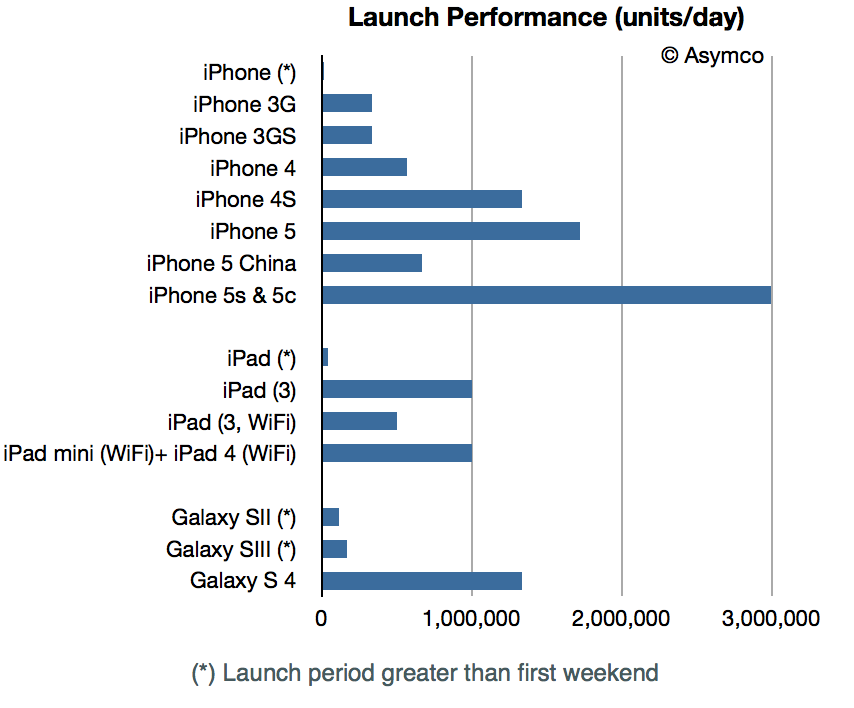
    Apple today announced it has sold nine million new iPhone 5s and iPhone 5c models in the first three days after their launch. This performance is illustrated in the following graph:

    Screen Shot 2013-09-23 at 9-23-7.12.13 PM

    Note that the data is normalized to units/day.

    The launch countries this year differed from last year in that they include all of China whereas last year only Hong Kong was included. ((I am assuming that this year China includes Hong Kong. It would be good to confirm this.))

    The absolute number of 5x devices sold (not just shipped) seems to be an 80% increase from the 5 launch (9 million vs. 5) but accounting for China the increase is a more modest 29%.  ((The China launch event last year may have had a different dynamic as it occurred later and nearer to holiday season, but I'll go with the unqualified data.))

    However, perhaps the more relevant comparison is between different "S" generations of phones.

    The data shows that the 3GS was 3x more rapidly purchased on launch than the original iPhone. The 4S was 4x more rapidly purchased on launch than the 3GS and now the latest 5s/c are 2.3x more rapidly purchased than the 4S.

    The growth is certainly lower but from a much higher base. This should not be surprising.

    UPDATE: Galaxy S 4 launch data is updated to show weekend performance. Previous graph showed performance over the first 27 days.