Asymco

Asymmetric Intelligence

Market

  1. Think local, act global

    Research · 113 comments

    One of the curiosities of the mobile phone market is how vast it is but also how heterogeneous it has always been. I wrote about this in 2010:  Smartphone parochialism: How operator policies prevent or promote platform adoption. This observation was influenced by my time at Nokia where I became amazed at how differently users behaved in different countries.

    There were many causes. Some cultural, some historical, some economic and some policy-driven. The result was that it presented a challenge to any company with global ambitions and indeed it was rare to see the same company do well in every market. Japanese companies did well in Japan, European companies did well in Europe and US (and Korean) companies did well in the US. Nokia was most successful because it was able to apply an European model more broadly (but not in the US). Samsung succeeded by simply adapting to each and every market with hundreds of products. But it was a particularly "provincial" market.

    My assumption was that when smartphones would become the majority of phones in use there would be a normalization of behavior and thus a homogeneity of preferences. This is, after all, what happened in other platform games. PC form factors are globally consistent, PC operating systems are equally preferred around the world, FaceBook, Google and Twitter are also, unless censored, uniformly popular. Apple's iPod eventually also became a global phenomenon with no material difference in preference by market. Likewise for game consoles. ((Although Japanese do seem to prefer Japanese platforms more.))

    However, a decade after the broad adoption of smartphones, the relative popularity of various platforms is still unevenly distributed. Prior to the iPhone, Symbian was strong everywhere but the US and BlackBerry was very strong in the US but weak elsewhere. Windows Mobile had footholds in some markets but little traction in others. Today the picture has changed but it's still a patchwork of preferences. Consider the following graphs.
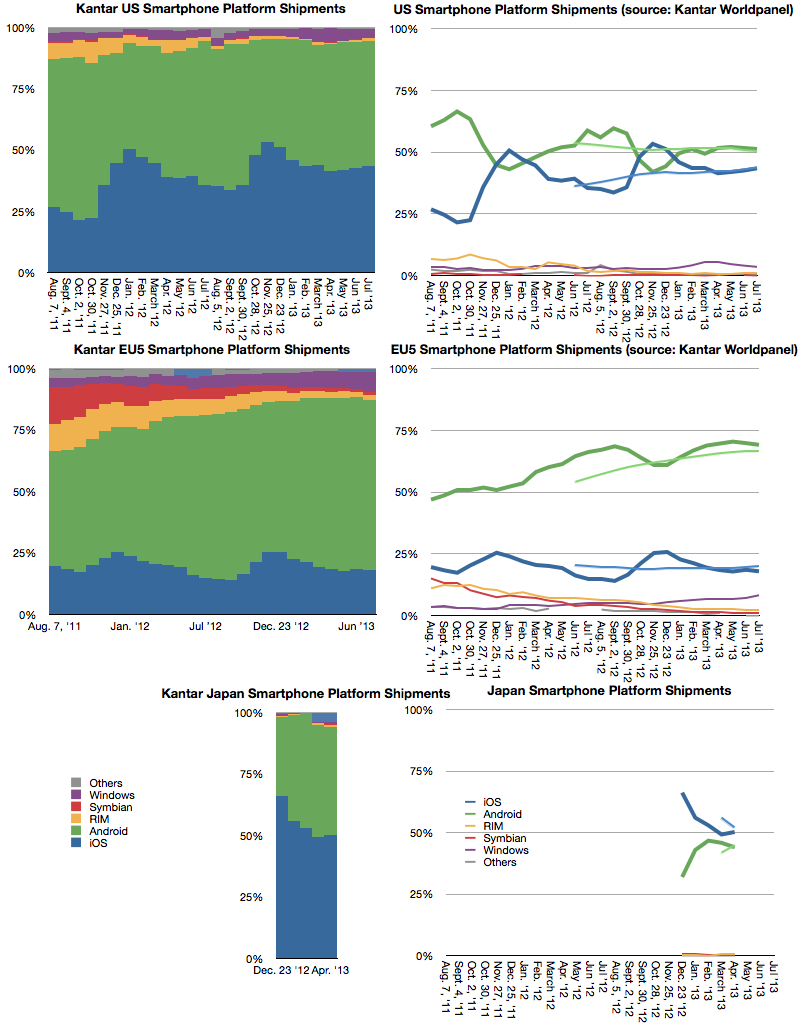
    Screen Shot 2013-09-18 at 9-18-12.57.15 PM

    They are the most detailed sets of data on platform phone purchases but they not the only data: We also know that Android is vastly more popular in India from web usage statistics. We know that BlackBerry is sensationally popular in Latin America and the Middle East. We know that within Europe there is a gap between North and South in iOS vs. Android and even more pronounced between East and West. We know that whereas iPhone was a huge hit in Korea upon its launch there, Samsung and LG swamped it in the last two years.

    But the data shown above is the story of iOS being very popular in Japan and increasing its share in the US while being flat in EU5. Again these three markets are different but each contradicts the global picture.

    Note the differences in trend not just absolute performance. This is what is puzzling. There seems to be a divergence between markets: Markets are become more islands onto themselves rather than one whole. This contradicts all the theories of how computing markets should behave (network effects, ecosystems, monopoly power, etc.) It implies that there is still a great deal of friction in the market; friction which I suspect to be due to the peculiar nature of telecom economics.

    I wonder if this observation is, as usual, late on my part and that Apple's iPhone product marketing has seen it years ago.
  2. My interview with Chloe Cho on CNBC Asia's Cash Flow show

    Research · 3 comments

    My thanks to Kirk Burgess for providing this transcript:

    Horace Dediu interview on CNBC Asia Cash Flow show - 10th September 2013

    Chloe Cho (CNBC): Take us through what Apple is exactly trying to do?

    Horace Dediu: Well, this is the first time in the six years of this competition in the smartphone market that Apple has broadened its portfolio. We have seen only a single product launch every year--this is very unorthodox in the industry. Normally each competitor [ranges] dozens of devices. Apple's entry has been asymmetric from the start, and now in its sixth year we are expecting to see, finally, a broadening perhaps into two separate products. The question will be whether [there will be] a significantly lower price point for the so-called 5C and whether that will change the average selling price overall for the portfolio. The average selling price has been remarkably steady, and remarkably high, typically around $600 for the duration of this products life. Something, again, unprecedented. My expectation is the new price point will be quite a bit lower than $600, starting with about $450, it might drop a bit further, [which] would cause the overall price range to come down as we have seen with the iPad; [where we] also had a price erosion happen as the smaller version came out.

    Q: Horace, do you think they have got the timing right? Should they have done this a little bit earlier when the market wasn't so saturated and filled with cutthroat competition?

    A: Indeed, I think. As I said, as a product with six years in the market it's a bit late; I expected this to happen last year. I think a lot of the momentum that has been lost in the past year in terms of sales growth has been because of the lack of low end. To note also will be whether they indeed expand their carrier footprint. We are expecting something new in Japan and possibly China Mobile. There is a second announcement happening with a few hours delay in China. This is again the first time that has ever happened.

    Q: Horace, do you think they didn’t move down the value chain fast enough largely because they didn’t have a deal with China Mobile?

    A: Well that's always a good question whether they are driven more by carrier channels or are they driven more by consumer market expectations. I think it's a bit of both. We do have this hybrid approach where they continue selling this older product for one or two years after the new product is launched--so the 4 and 4S are still available while the 5 is being ranged. This strategy is hybrid I say because this isn't truly a low end product, it is a stale product that is being put out there. This [strategy] may be driven more by consumer demand, not so much what operators are asking for. With the 5C we might be looking at a solution for operators in particular.

    Q: Horace, how much do some these incumbents like Apple and Samsung need to be worried about Microsoft approaching their space?

    A: I believe Microsoft will not be competitive in the near term. I don't think [during] the next year we are going to see a very impactful entry from Microsoft. What Microsoft is likely do is lower prices significantly on Nokia's portfolio and their pipeline as it is. That might cause more pressure on the pricing, but the problem has been that consumers have not really been taking up the Windows Phone platform very aggressively. It has been somewhat successful in Europe but not taking off elsewhere. I think Microsoft will be in an integration mode with the Nokia assets into 2014, but I would expect in a year from now we might see some new entry product that would be exciting. I think 2-3 years down the road we might see something from Microsoft that would excite consumers as well.

    Q: There has been a lot of focus on which companies have a more integrated house, Apple or Samsung. In light of the fact that they are having to move into lower price points, in your view which is doing the better Job, Apple or Samsung?

    A: Well Samsung is a great industrial enterprise and they are doing very well by broadening as much as possible their portfolio, even before the smartphone race started for them, which was in 2010, they were known for being one of the most prolific product creators out there. They actually had over 100 different mobile phones, not smartphones, just regular mobile phones that they would range, and Nokia were extremely concerned by this pressure they were getting from Samsung.

    What they have seen since 2010 is the same thing, except with smartphones, and so they’ve been really prolific and covering the spectrum of price and screen and every other possible variant that could be made. I think however that Samsung hasn’t got a software platform under its belt. They could become a software player by taking over some of the control of Android as we have seen Amazon do, and thus really establish themselves as a platform player. They are doing so to some degree with the "Gear" product, and they might be doing something like this by launching their development conference this year.

    But they aren't yet a platform player whereas Apple is, but then again we just don’t know what the politics of Android are with respect to forking it by an OEM as large as Samsung.

  3. Third to a billion

    Research · 166 comments

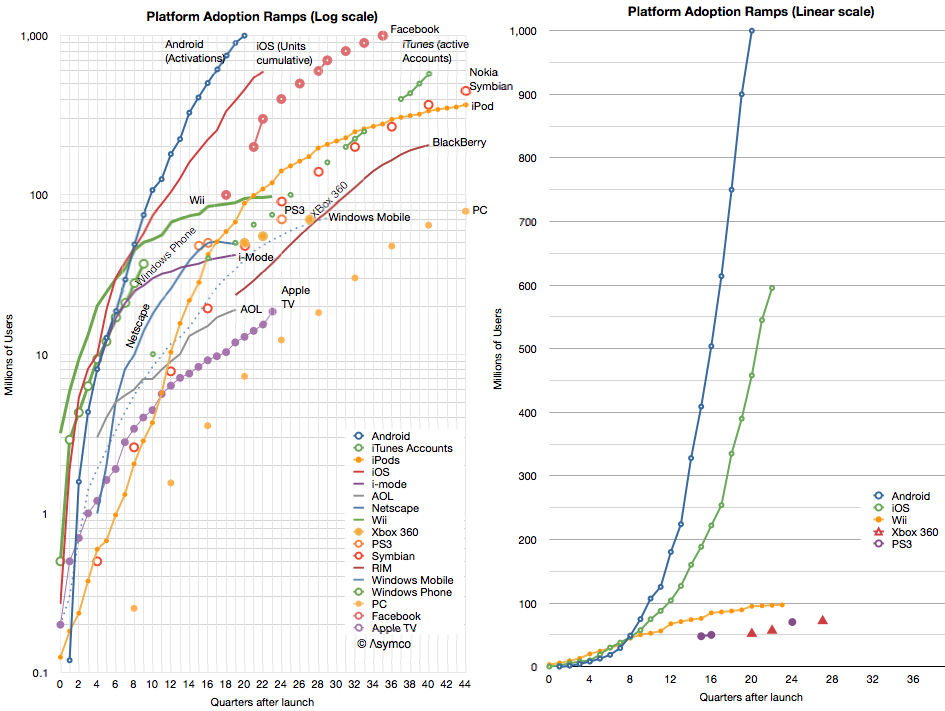
    Android is the third platform to reach a billion users ((Although activations are not users, I'm assuming that usage is not far behind and the cumulative sales figures I gather are roughly comparable.)) .  The first was Windows and the second was Facebook. Apple sold around 650 to 700 million iOS and is expected to be the fourth to a billion sometime next year. ((Separately, iTunes reports 575 million account holders.))

    If we define the Race To a Billion to be bounded by a time limit of 10 years, then Windows does not qualify and Android is actually second. The race is shown in the following graphs (the one on the left is logarithmic scaled, the one to the right includes only a few contenders for illustrative reasons).

    Screen Shot 2013-09-06 at 9-6-4.06.29 PM

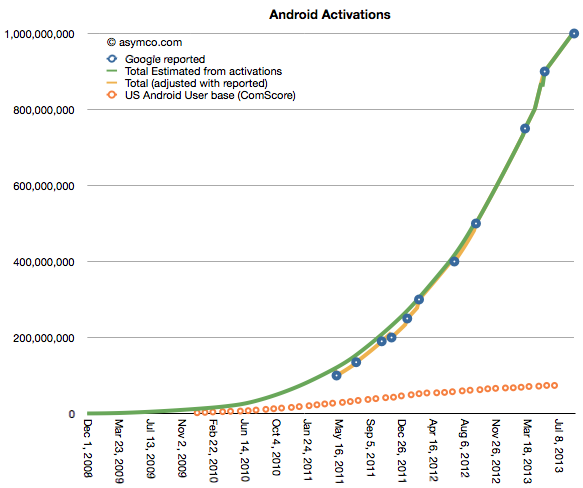
    Android's activations as reported are shown in the following graph:

    Screen Shot 2013-09-04 at 9-4-1.15.38 PM

    Without qualification, Android has been a viral success story. It reached one billion activations in about five years, almost half the time it took FaceBook and far faster than Windows.

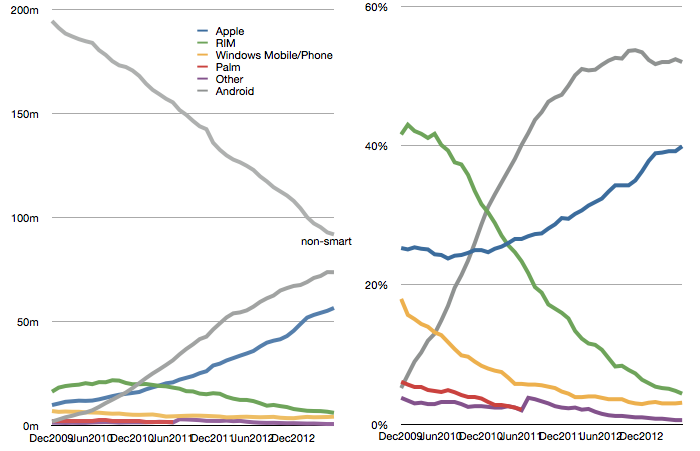
    However, Android growth can be qualified. I added another set of data which is the number of US Android phone users as deduced from measurements by ComScore. ((ComScore surveys users on their primary phone. Survey includes only those aged over 13 years and excludes phones issued by businesses.))

    One way to read the two graphs is: Between March and August, of the 250 million Android devices activated, 4 million were to new Android consumers in the US. In other words, In the last six months, 1.6% of Android activations went toward new usage in the US. The equivalent figure for iOS is about 6%. Note that these are new users, not included are upgrades. It's likely that more of the US buying goes toward upgrades because iOS has been in use longer.

    So whereas Android is growing very rapidly, there is a question of reliability of that audience. Engagement is one thing, but in the market which shows highest penetration (and deepest distribution of an alternative) Android is peaking.


  4. The Revenue Table (imperial units edition)

    Research · 40 comments

    Tim Cook famously said:

    We can put all of our products on the table you’re sitting at. Those products together sell $40 billion per year. No other company can make that claim except perhaps an oil company.

    For those of you laughing, that was three years ago. The revenues quadrupled since to a total of $170 for the last four quarters. But the more interesting thought is that the table has not gotten bigger. When Tim spoke the iPad had just been announced but was not yet for sale. So we can't be sure if he thought it should be on the table or not, but it does not take up that much space.

    It would be fun to actually lay out all the Apple products on a table to see how big it would be. The trouble is that there are many things Apple sells which take up no space at all. Things like iTunes content or services and AppleCare.

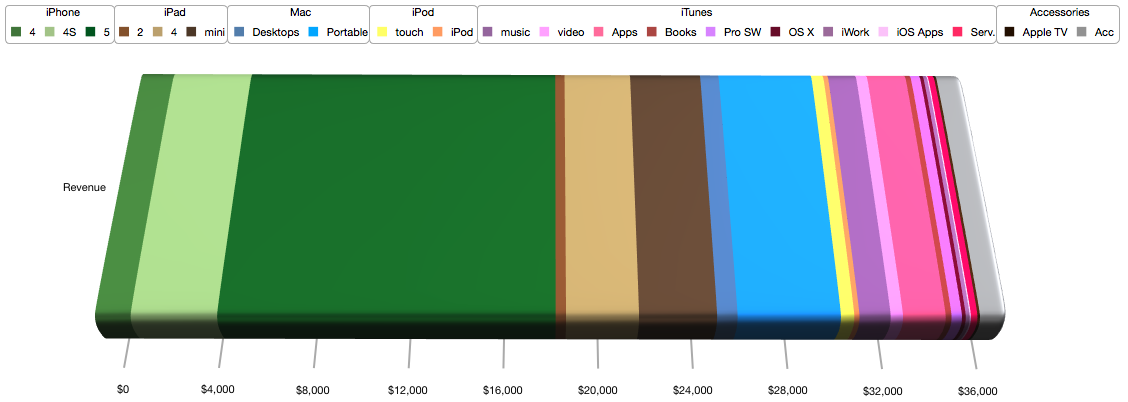
    So rather than trying to imagine a table full of Apple products (some of which are non-phyisical) I thought a more fitting analogy would be to allocate the revenues from these products to a table and thinking about how much space relative to each other the products would take.

    To make conversion easier, I picked a rather large table; 10 feet long, big enough to fit a small conference room. What would this table covered in product revenue look like?

    My estimate is that it would look like this:

    Screen Shot 2013-08-22 at 8-22-11.50.54 AM

    I color coded the product lines as shown in the legend: Greens for iPhone, Browns for iPad, Blues for Mac, Yellow for iPod, Red/Purples for iTunes and Grey for Accessories.

    At this categorization the table would allocate the following space to each category:

    • iPhone (Greens): 60 inches or about half the table.


      Product
      Inches
      iPhone 4
      4.7
      iPhone 4S
      11.4
      iPhone 5
      44.5
    • iPad (Browns): 21 inches


      iPad 2
      1.4
      iPad 4
      9.6
      iPad mini
      10.3
    • Macs (Blues): 5 inches


      Desktops
      2.7
      Portable
      13.6
    • iPod (yellows): 2.5 inches


      touch
      1.8
      iPod
      0.7
    • iTunes (reds), software and services: 15.5 inches


      music
      4.1
      video
      1.6
      Apps
      5.6
      Books
      0.8
      Pro SW
      1.4
      OS X
      0.5
      iWork
      0.5
      iOS Apps
      0.2
      Serv.
      0.9
    • Accessories (Greys): 4 inches.


      Apple TV
      0.3
      Acc
      3.6

    If this colorful table were used to support the actual products, where each product would have to fit within its color band, then the truth of one saying would become apparent: good things come in small packages.

  5. How will iPhones 5S and 5C be priced?

    Research · 175 comments

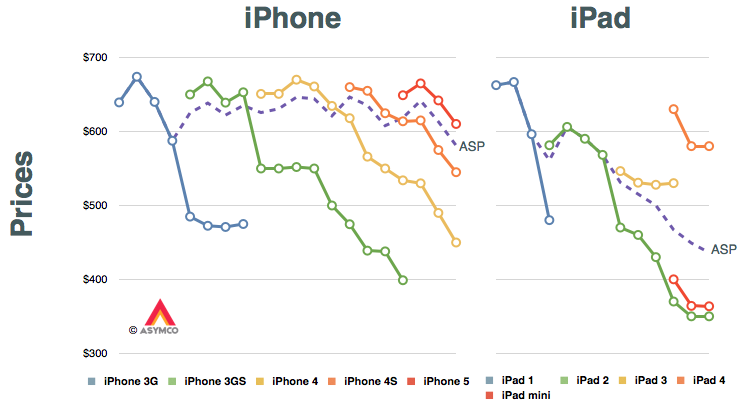
    The answer may lie in the way the iPad mini has been marketed. The pattern for iPhone pricing is pretty regular but that for the iPad shows a marked difference. The reason is, of course, that the iPad has already gone through a portfolio broadening. The following graphs tell the story.

    Screen Shot 2013-08-12 at 8-12-11.30.09 AM
    Screen Shot 2013-08-12 at 8-12-11.49.19 AM

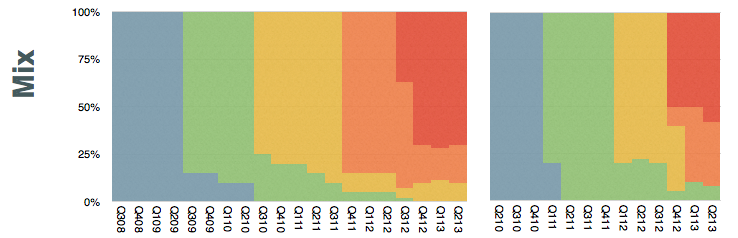
    The only data in these graphs that is provided by Apple are the dashed purple lines. They represent the average selling prices (ASP[*]) for the two product lines. I added assumptions about product mix (shown in the lower set of graphs) and thus generated prices for each product variant at a given point in time shown as  line graphs.

    If you look at the iPad, ignoring the legacy iPad 2 (which I presume sells mostly to educational institutions) the replacement of the iPad 3 was with a "bracketed" portfolio of the higher-priced iPad 4 and the lower-priced iPad mini. Note also that the mini reflects similar pricing to the legacy iPad 2.

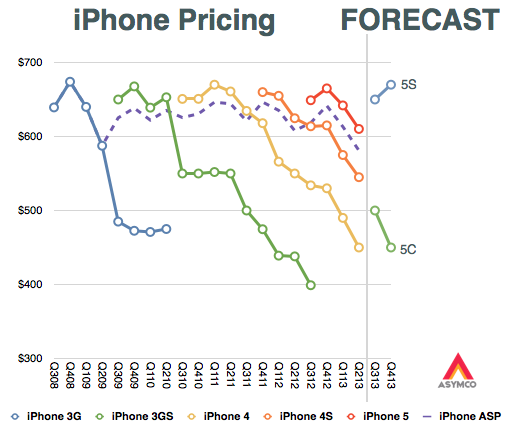
    My second assumption is therefore that the 5S and 5C will form a similar bracket as the new iPads did. I also assume that the iPhones 4 and 4S will be retired. This means that the 5C will take up the trajectory of the 4S while the 5S will take up the upper bracket around $650.

    Screen Shot 2013-08-12 at 8-12-11.44.05 AM

    The average pricing for the entire portfolio will depend on the mix. This is still highly speculative since we can't predict how the end-user (operator) pricing will be set for the 5C. Aggressive promotion and new market growth might skew the 5C considerably. On the other hand, upgrade promotions might move the 5S in existing markets.

    ---

    Notes:

    • These prices reflect blended average prices of all SKUs to the channel and do not necessarily reflect prices offered to end-users.
  6. Signs of US Android net user decline

    Research · 255 comments

    ComScore's latest survey  for US smartphone users showed that Android had 52% share of about 142 million users. That amounts to 73.84 million Android devices in use.

    ComScore's previous such survey showed that Android had 52.4% of about 141 million users. This amounts to 73.88 million Android devices in use. It also means that Android usage in the US went down for the first time.

    Screen Shot 2013-08-08 at 8-8-10.10.39 AM

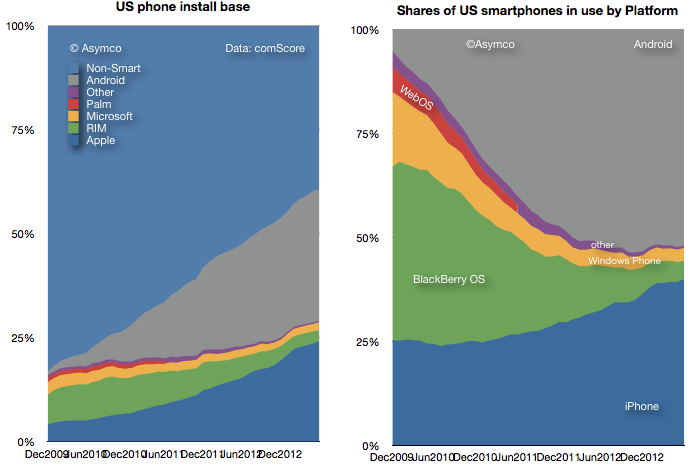
    The difference is surely within a margin of error so it's not something to declare definitively, but the pattern of Android "peaking" has been evident for some time.

    Screen Shot 2013-08-08 at 8-8-10.11.44 AM

    Even though share stopped growing about a year ago, Android continued to gain users as overall smartphone consumption increased. The last few months however have shown a slowing of new smartphone users and therefore we have this first instance of Android appearing to lose usage.

    Screen Shot 2013-08-08 at 8-8-10.12.35 AM

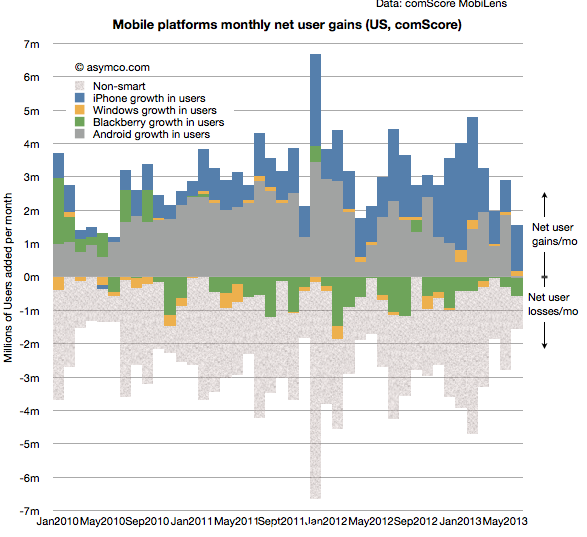
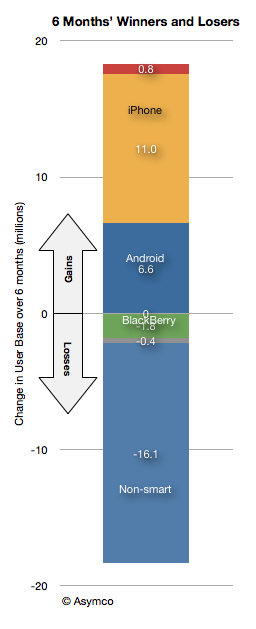
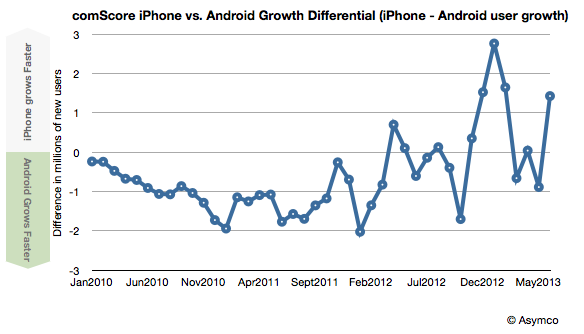
    Note that this has not been the case for iPhone as usage over the last six months is up by 11 million users vs. 6.6 million for Android.

    Screen Shot 2013-08-08 at 8-8-10.13.07 AM

    Indeed, iPhone gained more users than Android for the last 6 out of 8 months.

    Screen Shot 2013-08-08 at 8-8-10.16.36 AM
  7. iTunes Update

    Research · 29 comments

    In the latest quarter the iTunes group top line grew by 25%.

    Additional newly reported items:

    • Quarterly revenues dipped slightly to $4 billion (second highest after $4.1 billion last quarter).
    • iTunes Stores billings (i.e. gross content revenues) were $4.3 billion
    • Reached the best month and best week ever for App Store billings at the end of the quarter.
    • iTunes billings translated to quarterly revenue of $2.4 billion, up 29% from the year ago but flat q/q. Company reports “strong growth in revenue in both content and apps.”
    • New content added includes HBO GO and WatchESPN available on Apple TV. Apple TV catalog now includes over 60,000 movies and over 230,000 TV episodes.
    • Users have downloaded more than 1 billion TV episodes and 390 million movies from iTunes to-date. They are purchasing over 800,000 TV episodes and over 350,000 movies per day.
    • iOS developers have now created more than 900,000 iOS apps including 375,000 apps made for iPad. Apps created grew by 50,000 overall and 25,000 iPad apps.
    • Cumulative app downloads have surpassed 50 billion.
    • App developers are being paid at the rate of $1 billion per quarter.
    • App developers have been paid over $11 billion for their sales through the App Store (half of which was earned in the last four quarters.)
    • There are now over 320 million iCloud accounts
    • There are 240 million Game Center accounts
    • Almost 900 billion iMessages have been sent
    • Over a 125 billion photos have been uploaded and over 8 trillion notifications were sent.

    Some observations and estimates:

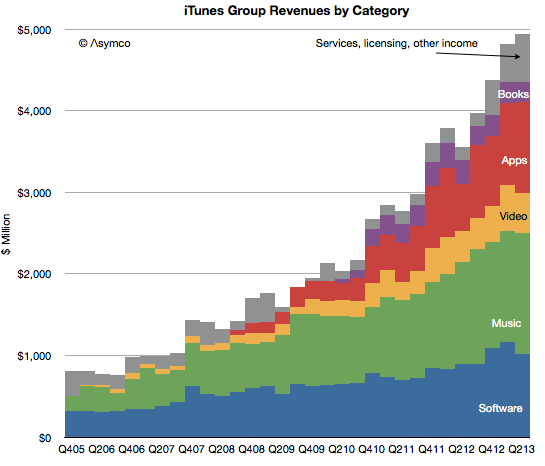
    • Music revenue growth remains at around 15% while video revenue growth remains around 25%
    • Apps continue to accelerate with a near doubling of revenues
    • Book revenues are contracting as pricing pressure is being felt
    • The software group grew moderately at 15% as Apple’s apps are reaching saturation within the iOS user base and as Mac sales stagnate.

    As a reminder, you can order the iTunes Business Review from the Asymco Store.


    Screen Shot 2013-08-05 at 8-5-4.21.54 PM
  8. The iPhone Stores

    Research · 29 comments

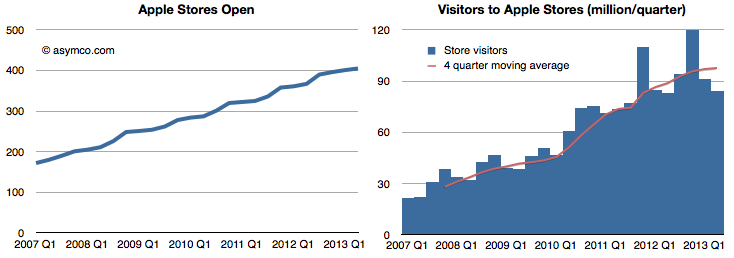
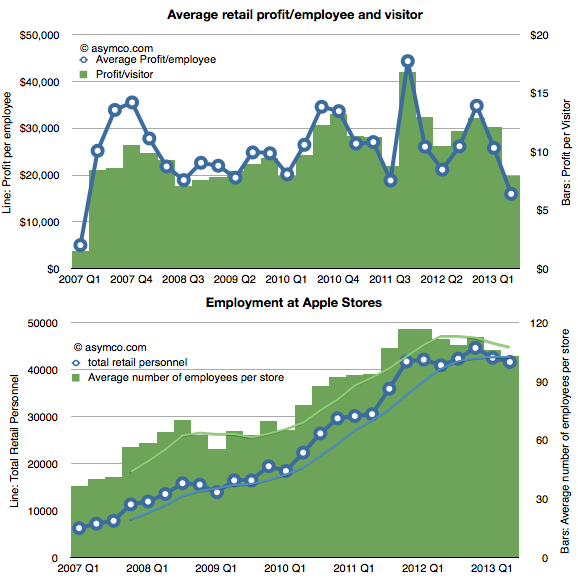
    Here are the latest performance figures for the Apple stores:

    Stores Open and Visitors

    Screen Shot 2013-07-30 at 7-30-2.17.25 PM

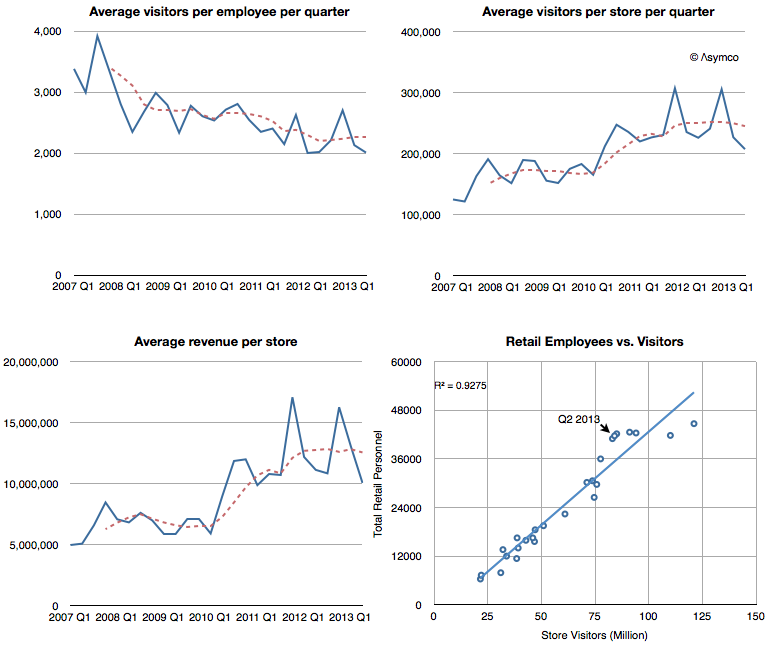
    Visitors per employee,Visitors per store, Revenues per store and Employees correlated with Visitors.

    Screen Shot 2013-07-30 at 7-30-2.15.23 PM

    Employment and Profitability (per Employee and per Visitor)

    Screen Shot 2013-07-30 at 7-30-2.17.48 PM

    The pattern that seems to appear is one of a plateau or peaking of sales, especially when values are seen on a per-store basis. Revenues, employment and visitors per store are all flat or slightly down when seen on a seasonally adjusted basis (trailing four period average).

    Profitability has been more steady over a long period, though more volatile in a short-term window.

    Seen in isolation, Apple Stores would appear to be coming to a point of quiescence.  But they should not be seen in isolation. Apple Stores mainly sell Apple products, so if Apple products slow then retail sales should also slow.

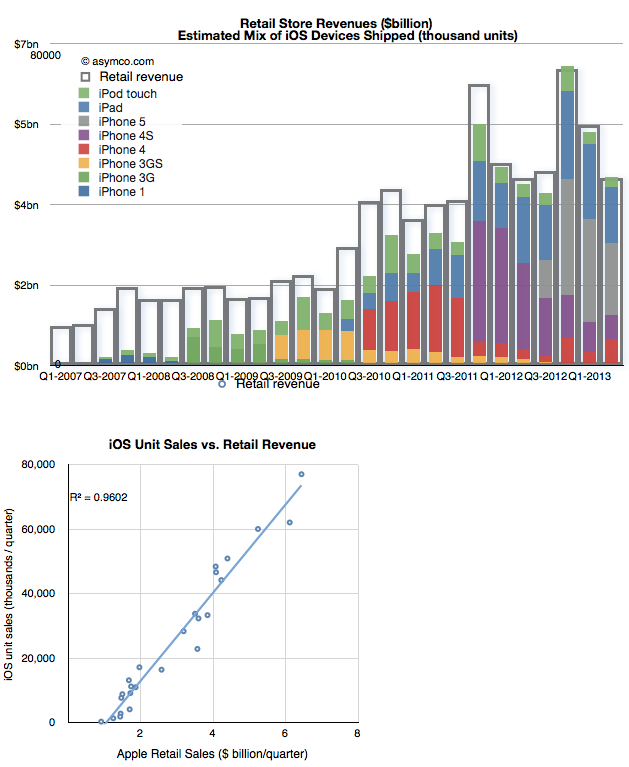
    Indeed, in 2007 Steve Jobs told Fortune that the Apple stores had been built to sell the iPhone and in 2010 Ron Johnson said the Apple stores had been built to sell the iPad. These statements were meant metaphorically but they are literally true when looking at what is actually sold. The following graph shows the relationship between iOS device sales and Retail revenues.

    Screen Shot 2013-07-30 at 7-30-2.17.56 PM

    The first chart shows the relationship plainly enough and the r-squared coefficient of 0.96 puts a finer point on it.

    So at the end of the day, the performance of the Apple stores depends on the performance of Apple's portfolio of products. It stands to reason that as iOS units slow, Apple stores should as well.

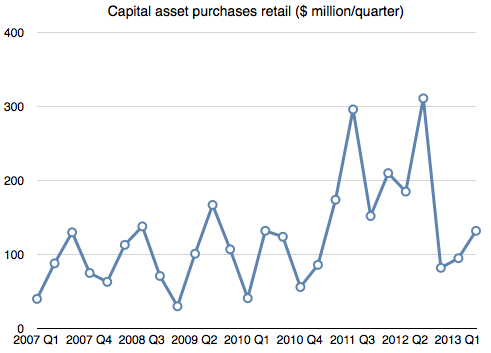
    This is something Apple management should be well aware of. Therefore, if Apple were confident in the future of iOS it would be investing in retail (as it would in other capital projects like manufacturing.)

    And that answer would be here:

    Screen Shot 2013-07-30 at 7-30-2.47.21 PM
  9. What's an Android user worth?

    Research · 130 comments

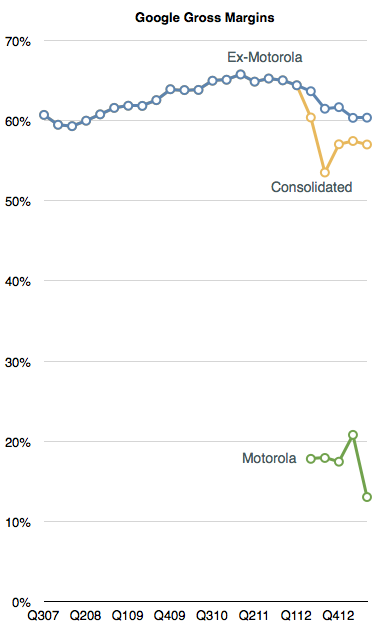
    Excluding Motorola, Google's gross margins have dropped for six out of the last nine quarters. They peaked at 65.8% in early 2011 but have now dropped to 60.4%. Including the drag from Motorola they are down to 57%.

    Screen Shot 2013-07-20 at 7-20-9.52.38 AM

    Gross margins include the effect of price, volume and direct costs of sales. Although sales have grown (see graph below), the pricing Google has been able to obtain (CPC) has fallen. The cause is unknown but there is a strong correlation between the growth in their mobile channel. For their part, management cites mobile as having an effect in reducing CPC though they caution that it's one of many factors.

    Screen Shot 2013-07-19 at 7-19-8.52.10 AM


    The elephant in the room is indeed the effect of 900 million activated Android devices (with 1.5 million added each day.) These nominal billion devices are a new channel that could be said to have doubled Google's addressable market in only the last three years. The effect of this doubling is perhaps partly underlying the top line growth shown above.

    How can we test this?

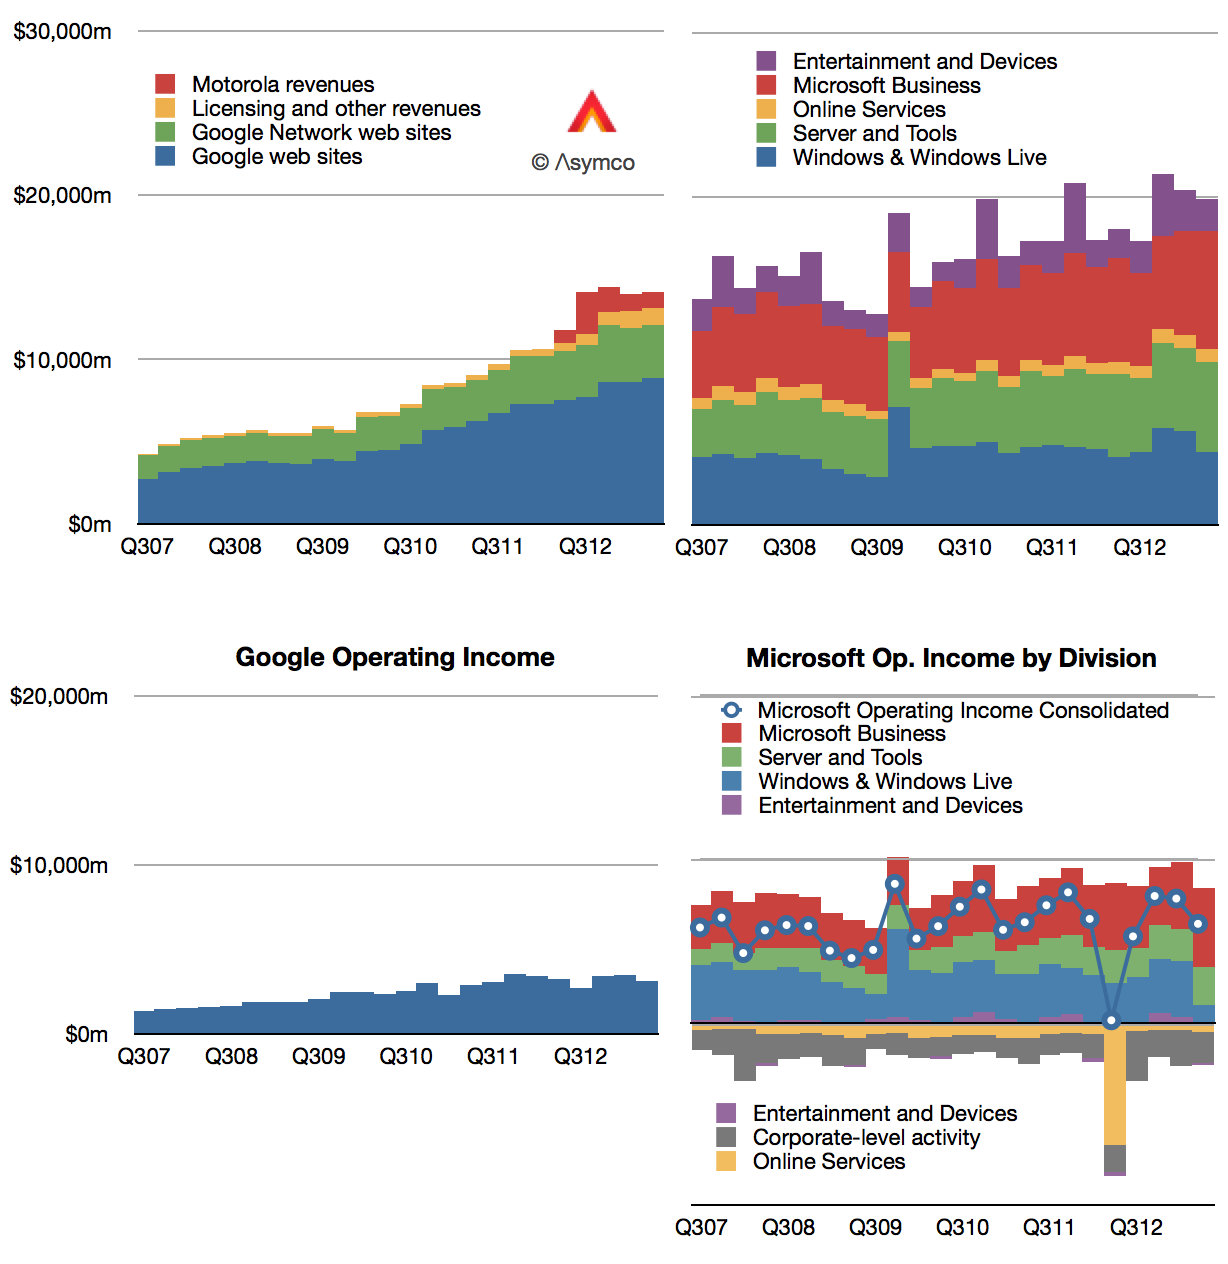
    I placed Google's performance alongside Microsoft's for a reason. Since Microsoft has had precisely zero benefit from any new mobile channels, and since its software is broadly tied to business spending (as is Google's), we can consider Microsoft as a control in what baseline non-mobile growth could be. From Q2 2010 to the present (the Android epoch), Microsoft's consolidated revenues grew by 24% (31% if we exclude Windows).  In contrast, Google's advertising revenues (excluding Motorola and licensing) have increased by a more robust 83%.

    So it's possible that mobile contributed to top line growth. The effect could be 50% over three years. The downside is of course that this comes from a doubling of the channel. The new channel is therefore half as engaging. In terms for bottom line, the effect would be seen as more subdued growth. Overall, income increased 32% for a nominal doubling of usage.

    Not that there's anything wrong with that.

    Expansion of user base usually comes with lower engagement and margins. I demonstrated the same effect with the vast expansion of iTunes customers.

    The only difference seems to be that markets reward Google's margin dilution but punish Apple's.

    Put another way, hypothetically, as she spends slightly less, the market value for an Apple user is disappearing while as he spends a lot less, the value placed on a Google user is increasing.

  10. The PC Calamity

    Research · 70 comments

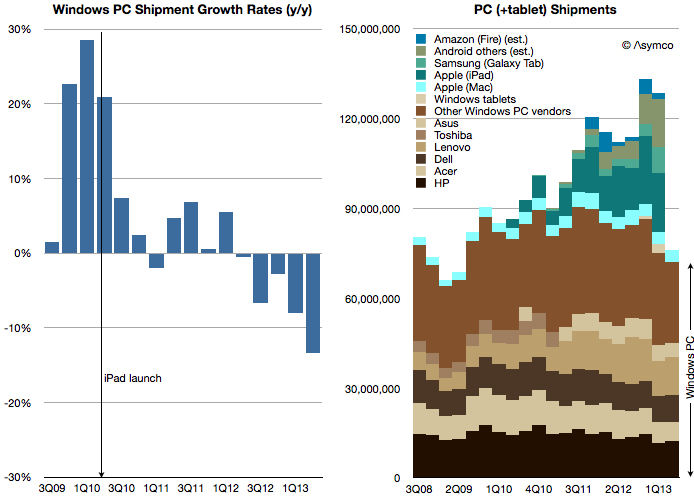
    As Intel has improved its products, their demand has decreased. Enormous efforts put into improvements are neither valued nor absorbed. The problem is not with the processors themselves but with the systems within which they are built:

    Screen Shot 2013-07-18 at 7-18-11.16.38 AM

    PC sales fell again last quarter and the contraction is likely to continue. We received affirmation of this as Intel cut sales and earnings forecasts and the crucial capital spending that creates supply in the longer term.[1]

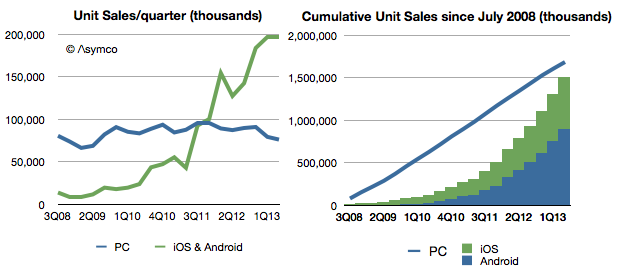
    At the same time, computing device sales have soared.

    Screen Shot 2013-07-18 at 7-18-5.07.35 PM

    Even excluding Android devices which don't register with Google's Play Store (and excluding Windows Phone devices), mobile ARM devices are selling at 2.6 times the rate of Intel-powered devices. Put another way, since the birth of Android nearly as many iOS and Android devices have been sold as PCs.

    In terms of install base, a computing category that did not exist six years ago has come to overtake one that has been around for 38 years.

    The calamity for Intel has been that they have had no part to play in the new category. Perhaps that is because they had every part to play in the old category.

    --

    Notes:

    1. Intel said it was cutting 2013 capital spending to $11 billion. The cut follows a reduction from $13 billion to $12 billion in April. Apple's budgeted capital spending for fiscal 2013 (ending September) was set at $10 billion.
  11. "Everybody has got a smartphone"

    Research · 63 comments

    … says UBS analyst John Hodulik, as quoted by the Wall Street Journal.

    No they haven't.

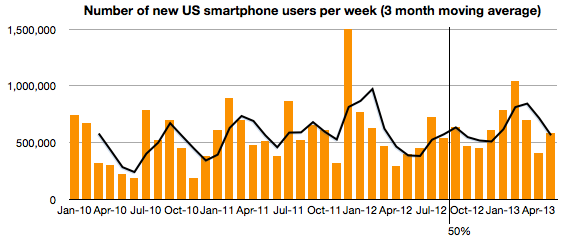
    According to the latest comScore survey data, 98 million Americans above the age of 13 don't use a smartphone as their primary phone. That's 41% of US mobile phone users.

    What's more, 2.5 million more people first started using smartphones in the three month period ending May vs. the three month period ending in April.

    The switching rate to smartphones is shown below:

    Screen Shot 2013-07-17 at 7-17-10.32.09 AM

    It shows the number of new-to-smartphone users who switched every week. It can be considered the "speed of adoption". The latest figure is 583k/week, above the 572k/week average maintained over the last 41 months.

    [I also added a three period moving average which shows a seasonal change in adoption. I also added a vertical line showing the point when 50% penetration was reached (August 2012).]

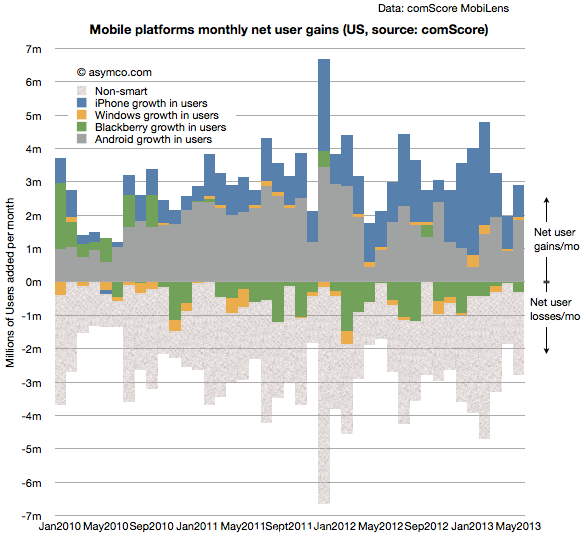
    The switching rate by platform is shown in the following graph:

    Screen Shot 2013-07-17 at 7-17-10.38.54 AM

    The data shows that churn between platforms (except for BlackBerry) is still negligible and that the majority of user losses can be attributed to non-smart devices.

    To summarize, with penetration now at about 60% in the US, the rate of adoption of smartphones is not slowing in any perceptible way.

    So not only is there no saturation, but there is no slowing of adoption of smartphones in the US, the most penetrated large market.

    Globally, the penetration of smartphones is less than half of that in the US. About 4 billion people are about to switch.

    Of course, they may not be willing to switch to what is currently offered to them in the market, but then again, the billion or so who adopted iOS and Android phones did not switch when the alternatives were BlackBerries, Palm, Symbian and Windows Mobile devices.