Asymco

Asymmetric Intelligence

Market

  1. Measuring the iTunes video store

    Research · 41 comments

    It's been five years since we had an update on TV show downloads and six years since we've had an update on movie downloads from Apple. In Q3 2008 Apple announced 200 million TV show downloads and in Q2 2007 2 million movies. That's a long period with no information making a tough extrapolation to the present.

    Nevertheless, I tried. My estimates for these two quantities were 963 million TV Shows and 108.2 million movies to date.

    So I was quite surprised to see that figures for both TV show downloads and Movie downloads were published today. The figures were 1 billion and 380 million respectively.

    My TV show forecast has proven to be very accurate but I severely underestimated movie download rates. Apple states that the movie download rate is 350k/day. My estimate  was only about 126k/day.

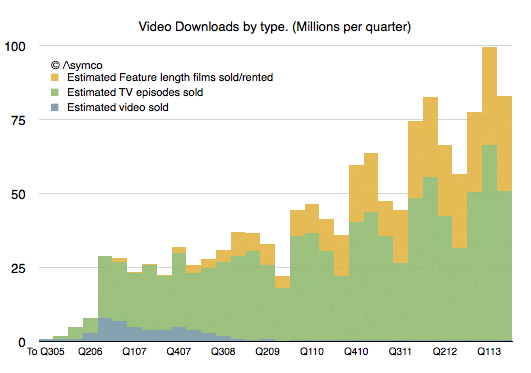
    After adjusting for the new data, the picture of downloads that emerges looks like this:

    Screen Shot 2013-06-19 at 6-19-6.20.31 PM

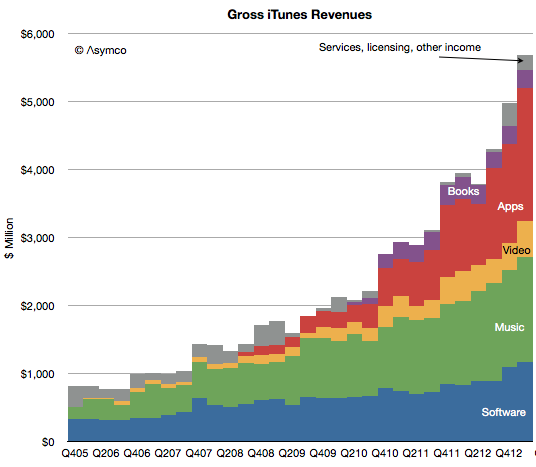
    The overall iTunes gross revenues by sub-component becomes:

    Screen Shot 2013-06-19 at 6-19-6.22.04 PM

    As a result, my new estimate for the rate of spending on iTunes video is about $1.75 billion/yr. This is much more substantial than prior estimates mainly because movies are much more valuable. A tripling of the download rate shows up as a significant rise in the profile of video vis-à-vis the other media types.

    Apps and software are firmly defined and music was somewhat clear. The upward adjustment in Video means that I have to reduce either Music or services. I presently am reducing service revenues but might adjust music as well.

    The overall picture of iTunes is becoming clearer every day. We have more information about number of users (575 million), what they spend on media and software and services ($20 billion/yr.) and, increasingly what they spend on each media type (about $9/yr on Software, $2/yr on books, $16/yr on apps $12/yr on music and $4/yr on video.)

    Screen Shot 2013-06-19 at 6-19-6.34.18 PM
  2. Measuring the latest iOS accessory market

    Podcast · 45 comments

    One of the most startling announcements during the WWDC 2013 was iOS in the car. The mockup that was shown seems to indicate the use of the car's in-dash display as an "external monitor" for an iOS device while control would come from inputs using Siri.

    The technical details were not released so it's hard to know the protocol used to accommodate this interface. However it seems that it will be generic enough that a number of launch brands signed up for the launch. The list includes Honda, Mercedes-Benz, Nissan, Ferrari, Chevy, Infiniti, Kia, Hyundai, Volvo, Acura, Opel and Jaguar.

    Is this a significant opportunity?

    Before we get excited, it's important to note that this will likely take a very long time. It won't even begin until 2014 and the number of new models may trickle into showrooms quite slowly. Consider that the time it took for automakers to universally support external audio input (mostly the trivial line-in) was about a decade.


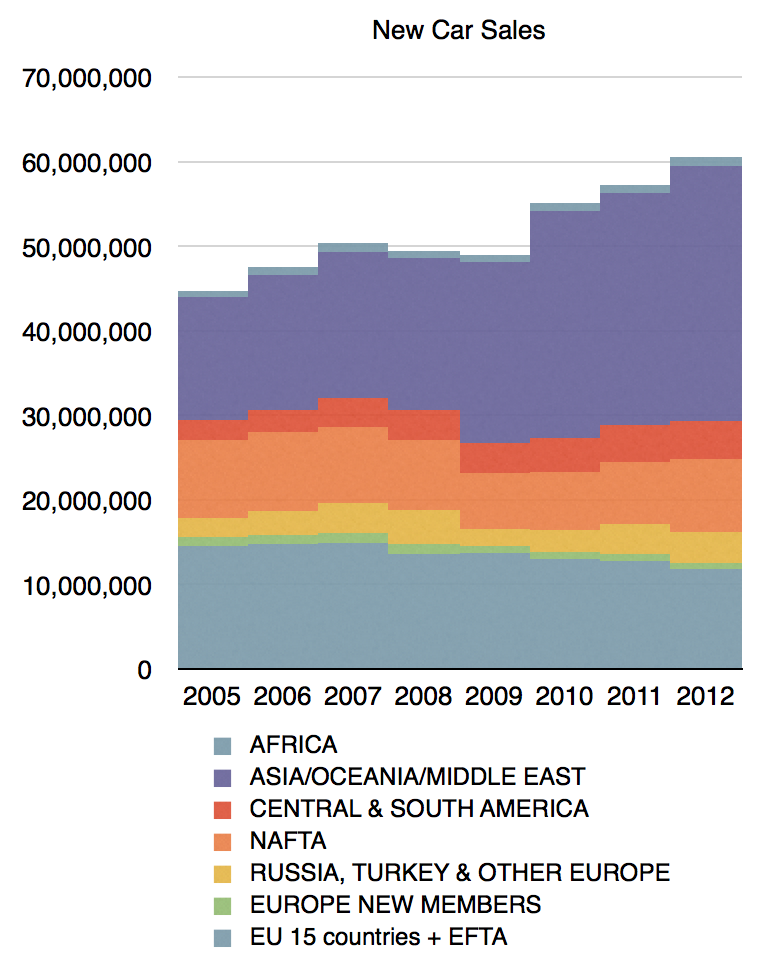
    To also curb our enthusiasm we need to realize that the car industry does not produce many units. In 2012 there were over 60 million cars produced (with the following regional mix:)

    Screen Shot 2013-06-11 at 6-11-6.02.32 AM

    In contrast, 60 million is about the number of phones sold every two weeks. In 2013 there will be more iPads sold than cars.

    In particular the companies mentioned had the following production figures in 2011:

    • Honda (including Acura): 2.9 million
    • Mercedes Benz (Daimler): 1.44 million
    • Nissan (including Infiniti): 4.5 million
    • Fiat (Ferrari parent): 2.4 million
    • GM (Chevy, Opel parent): 9.1 million
    • Kia: 1.6 million
    • Hyundai: 6.6 million
    • Volvo: 315k
    • Tata (parent of Jaguar): 1 million

    Including the parent companies and all vehicle types they produce, the total is about 30 million units, or about half of the world-wide production. Obviously, not many of the cars produced will have iOS in the car capability.

    Therefore the total unit opportunity is not very significant, perhaps less than 10 million a year. Is there a per-unit cost that compensates for this?

    This is harder to answer. The way Apple has been licensing accessory makers is through the MFi (Made for i) program. There used to be a flat 10% fee off of the retail price of the accessory sold. However, there may have been changes. The licensing fees are not public and it's quite possible that the price is a flat amount per unit and that it's a negotiable. It's hard to know what terms are being negotiated with automakers but my bet is that it's not likely to be a significant source of revenue per unit.

    So the total revenue from licensing the "Made for iPhone" trademark to automakers won't be significant.

    But it is significant for the car industry. The significance is that cars have finally risen to the role of being phone accessories. They have acquired the ability to participate in a computing ecosystem. During all these decades when the world has embraced the information society and intelligence has been embedded in the fabric of life, automakers have resolutely avoided being a part of it. Automotive information, connectivity and user experiences have remained in a Galapagos Syndrome-like isolation from reality. The reasons are rooted in the crisis of rigidity that plagues the industry, something I've touched on briefly in The Critical Path podcasts (e.g. Asymcar).

    So this is a hopeful development. If.

    If it actually moves at a slightly-faster-than-glacial speed.

    If sufficient cars get display systems (billions are produced for the pockets of  young and old, poor and rich; but cars have to be considered "luxury" to be graced with an LCD)

    If standards are adhered to.

    If all brands (which operate individually as autonomous divisions irrespective of group-level strategy) accept the notion.

    If these and many other conditions are met, it would allow, finally, the migration of autos to the status of information appliances and, eventually, to being hired for jobs that are currently left undone.

  3. Measuring US Mobile Platform Shares: Kantar vs. comScore

    Research · 34 comments

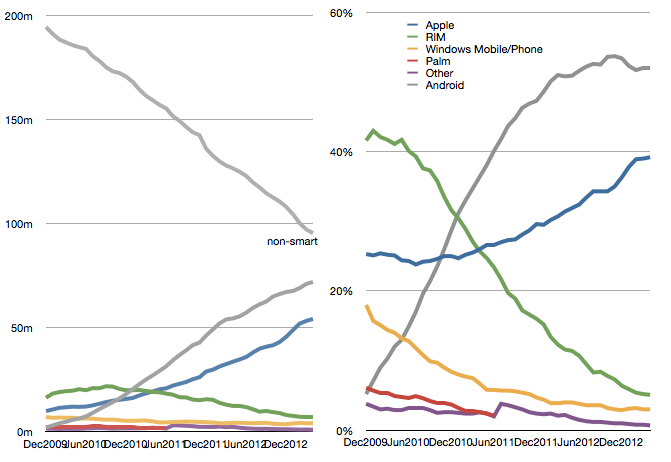
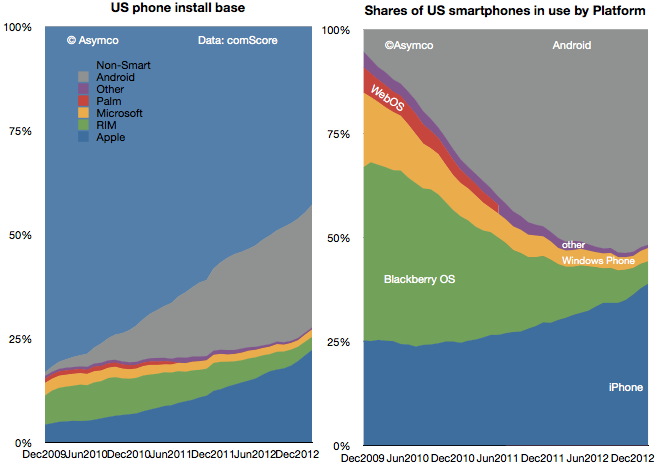
    The latest comScore US smartphone install base data is in and there are few surprises. iPhone has reached a new record high penetration (39.2%) and user base (54.3 million). Android has reached a new high in user base (72 million) but share at 52% is below the peak reached in November 2012.

    Screen Shot 2013-06-05 at 6-5-3.48.35 PM

    This pattern of gradual iPhone share gain in the US has been consistent for over two years even while Android has catapulted into an overall lead. The surprising thing is how Android seems to have peaked in share. There are still 95 million non-smartphone users and there seems to be headroom for growth even though the other platforms have been tapped out. But it does not seem that Android phones have any particular advantage over iPhone. My hypothesis remains that as price is taken out as a differentiation, the adoption of iOS is slightly higher than Android.

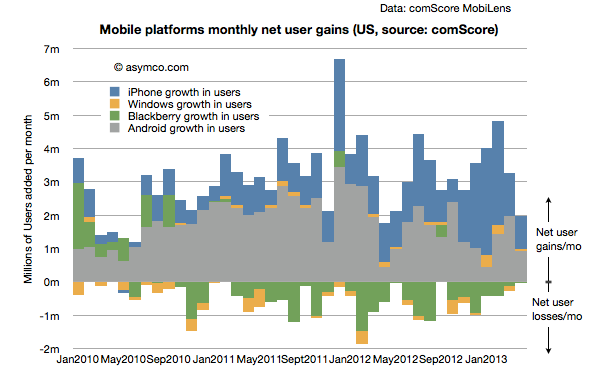
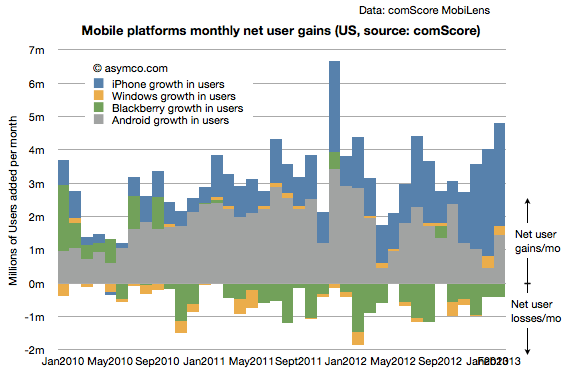
    Another measure of market performance is the implied net platform user gains which is shown below:

    Screen Shot 2013-06-05 at 6-5-3.23.55 PM

    It shows that iOS added more users in the last few months than Android.

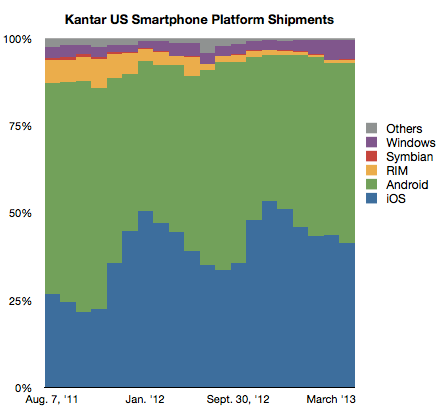
    The problem is that Kantar Worldpanel measures shipments and their share data shows a seemingly different picture.

    Screen Shot 2013-06-05 at 6-5-3.22.23 PM

    In their data Android is shown as selling more units during January through April while Apple sold more during October through December. Of course we don't have the absolute number of units so can't see the effect of higher holiday overall sales volume. Nevertheless, the balance of growth seems to be disproportionately in favor of Android relative to the data from comScore.

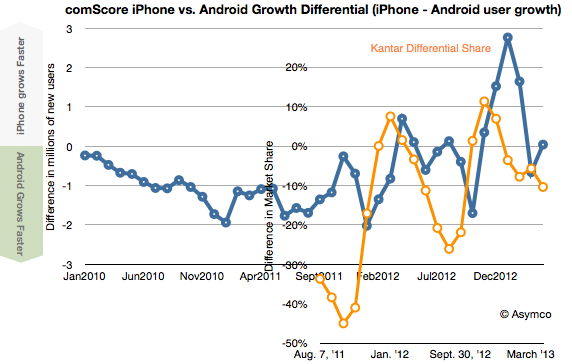
    To look at the situation more closely I measured the differential in user adds for comScore and the differential in market share for Kantar's data. Then I overlaid the two differentials so that months are matching, as shown below:

    Screen Shot 2013-06-05 at 6-5-3.51.57 PM

    There is a similarity to the frequency of oscillation with comScore data showing a delay (as would be expected since their data is sampling over a three month period). However, we are still facing a vertical offset where there is apparently more growth bias for iPhone in the comScore data.

    Possible factors which might be explanatory:

    • Methodologies used. comScore data excludes ages below 13 and non-personal devices (business expensed phones.) 
    • Replacement sales are invisible in comScore data since the user base does not change when phones are replaced (and old ones are discarded.)
    • Missing data from Kantar. Given their survey methods it's possible that their panels miss some market segments.
  4. Forecasting Windows market share

    Research · 80 comments

    Last week Frank X. Shaw, VP of corporate communications at Microsoft stated:

     ... most of the people around me were using their iPads exactly as they would a laptop – physical keyboard attached, typing away, connected to a network of some kind, creating a document or tweet or blog or article. In that context, it’s hard to distinguish between a tablet and a notebook or laptop. The form factors are different, but let’s be clear, each is a PC.

    Actually this "admission" that iPads are PCs is not something new. Steve Ballmer made the same assertion in 2010 pre-iPad (though calling them slates). Arguably, the notion that tablets are PCs has been dogma at Microsoft for over a decade and Windows running on all form factors has been a strategic guiding principle.

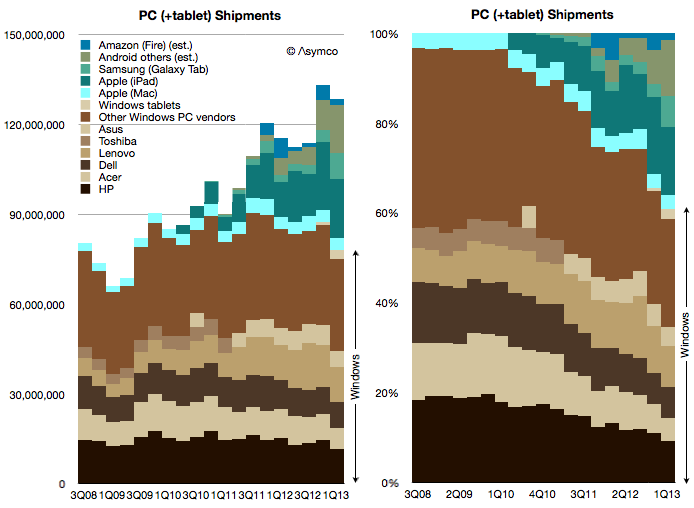
    Which is why I've always added the tablet data to the PC data to create a picture of the "personal computing" market. And this is what that picture looks like today:

    Screen Shot 2013-06-03 at 6-3-5.31.21 PM

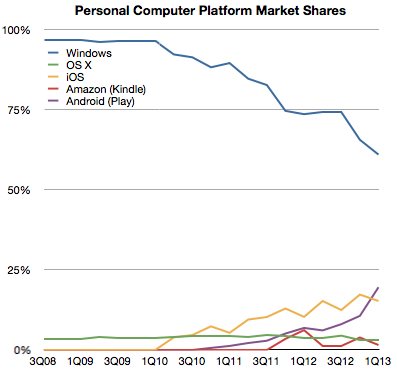
    Note how the share of various platforms has evolved over this brief time span:

    Screen Shot 2013-06-03 at 6-3-5.32.43 PM

    Seen this way, Windows has now reached 60% market share and it's likely to dip below 50% during this year. What happens beyond then is harder to imagine. If Windows tablets start growing as fast as the tablet market overall then Windows could stabilize in share. But if Android and iOS tablets follow their phone brethren in growth then it will be far harder for Microsoft to maintain share. But is that cause for concern?

    Not necessarily.

    The total computing market[1] is likely to expand to over 4 billion users with 1.5 devices per user in the next five years. That expansion implies that 20% share equals more than one billion devices, making such an ecosystem "good enough" for the average developer. It certainly has been good enough for Windows developers to date and they have kept hiring it throughout the new mobile app revolution.

    So even if Windows dips to only 20% of the world's computing market it will still be perfectly "viable" for some time to come.

    --

    1. I define the computing market as the total number of devices which have (a) a CPU (b) a broadband connection (c) a native application execution environment which is open to third party apps. This definition implies the presence of an "ecosystem" which is bound specifically to a platform.
  5. 100 billion App downloads

    Research · 35 comments

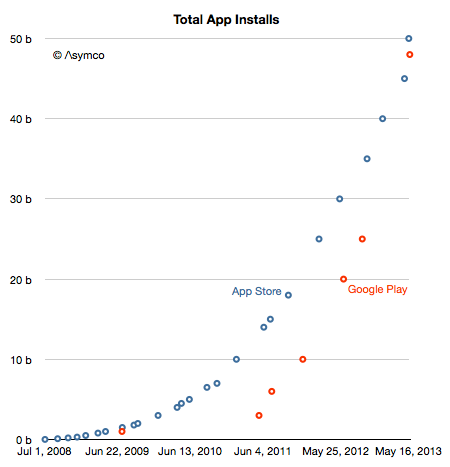
    By the end of May there will be 100 billion mobile apps installed on iOS and Android devices.

    Screen Shot 2013-05-31 at 5-31-9.45.21 PM


    Not bad for a five year old medium.

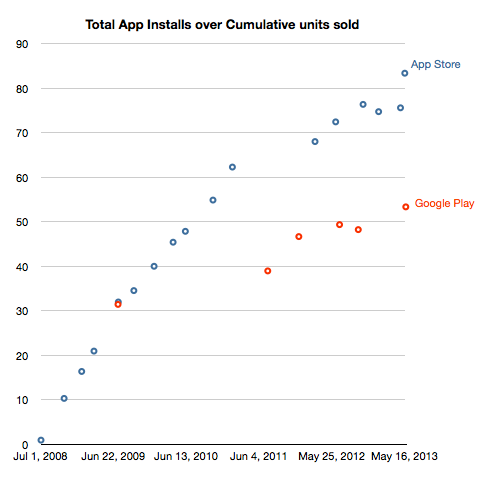
    With respect to attach rate, the total downloads/install base are currently 83 apps per iOS device sold and 53 apps per Android device activation. The history of this is shown below:

    Screen Shot 2013-05-31 at 5-31-10.18.03 PM

    The sheer weight of Android units will generate more downloads but on a per device basis the iOS devices do seem to consume more apps and the gap is not narrowing. What would be valuable would be the revenue per app on Play (the figure for iOS is about $0.23). That, as far as I know, remains unknown.

  6. Tim Cook's answer to my first question

    Research · 114 comments

    Tim Cook was asked the first question (on the iPhone portfolio). His answer is paraphrased here:

    We haven't so far. That doesn't shut off the future. Why? It takes a lot of really hard work to do a phone right when you manage the hardware and software and services in it. We've chosen to put our energy on doing that right. We haven't been focused on working multiple lines.

    Think about the evolution of the iPod over time. The shuffle didn't have the same functionality as other products. It was a really good product, but it played a different role — it was great for some customers it was strikingly different than other iPods. The mini played a different role than the classic did. If you remember when we brought out the mini people said we'd never sell any. It was too expensive and had too little storage. The mini proved that people want something lighter, thinner, smaller. My only point is that these products all served a different person, a different type, a different need. For the phone that is the question. Are we now at a point that we need to do that?

    …

    At a macro level, a large screen today comes with a lot of tradeoffs. When you look at the size, but they also look at things like do the photos show the proper color? The white balance, the reflectivity, battery life. The longevity of the display. There are a bunch of things that are very important. What our customers want is for us to weigh those and come out with a decision. At this point we think the Retina display is the best. In a hypothetical world where those tradeoffs didn't exist, you could see a bigger screen as a differentiator.

    Full interview here, answer begins around minute 37.

    Here is how I interpret the answer:

    • The iPhone portfolio may still arrive. It hasn't so far because the cost/benefit is not there for Apple. On one hand it would take a great deal more sourcing effort and risk while dealing with constraints in production. On the other it would not not offer meaningful additions to the customer base. At least so far. The economics and the demand may change (or have changed) and the time will come for a broader portfolio.
    • The comparison to iPod is not entirely appropriate because as a music player, the iPod had a relatively small set of jobs to do. It was hired for exercise, escapism, isolation, etc. It was not hired for apps and services which extend the medium itself. In other words it was not a computer. As a computer, the iPhone has a near infinite set of jobs to be done and it's the hundreds of thousands of apps which help it perform them. But as a result the iPhone needs to conform to the dynamics of ecosystems and that means consistency of APIs and user experience. It cannot vary in terms of input methods, or be below minimum requirements of screen size or memory and power.
    • Because of the rapidly expanding job space, Apple believes the iPhone was not "good enough" for all these years. The improvements shipped for each generation were all "meaningful" in that they were valuable and absorbable. Users would use the new features (like better screens, cameras, battery, etc.) and they were willing to pay for them (as evidenced by the sustained high average price).
    • On the question of what the extension might be, changing screen size is one dimension but it has to be balanced by performance gains that don't detract from other dimensions. Engineering is all about compromise and consumers pay Apple to make these compromises in an intelligent way. Apple does not come to an answer to the question of balance by launching many products and seeing what works. It cannot afford to dilute its brand with a long list of failures. Other brands may not be affected by trial-and-error approaches to the market but they are discounted by the customer accordingly.


  7. My questions for Tim Cook

    Research · 252 comments

    Next week at AllThingsD's D11 conference in LA, Apple CEO Tim Cook will be interviewed by Kara Swisher and Walt Mossberg.

    Here are some questions I'm hoping they will ask:

    1. Why is the iPhone not sold as a portfolio product? Meaning, why, after six years, is there no iPhone product range being updated on a regular basis. Having a portfolio strategy is not only followed by every phone vendor but also by Apple for all its other product lines, including the iPad, which came after the iPhone. In other words, please explain why the iPhone is anomalous from a product portfolio point of view.
    2. There are more than 800 operators world-wide so why are there only about 250 of them carrying your phone? Competitors large and small (from BlackBerry to Nokia to Samsung) have cited relationships with more than 500 operators so Apple is being uniquely selective. My question does not stem from a lack of patience: this total number of iPhone distributors has not increased markedly for over a year. Are you limiting distribution through conditions placed on operators (like the availability of sufficient quality data services) or are operators finding the distribution agreement too onerous (e.g. too high a minimum order quota)?
    3. In 2012 Apple's capital spending has reached the extraordinary level of $10 billion/yr, higher than all but the most capital-intensive semiconductor manufacturers. This is unusual for Apple as it was less than $1 billion in the year before the iPhone launched. It's also unusual for Apple's competitors in phones, PCs or tablets. It's on a level matched only by semiconductor heavyweights. What is the purpose of this spending and what should we read into it leveling off at $10 billion for 2013?
    4. Depending on one supplier is an operational faux pas, and yet Apple has found itself in that situation with Samsung for mobile microprocessors. It may be excusable in PCs with Intel having an architectural monopoly but it's not excusable for a chip that you designed yourself and purchase in massive quantities. Why did you give Samsung such a concession, especially knowing their potential as a competitor vis-à-vis alternative suppliers who had no such potential? Does the answer have something to do with the previous question?
  8. The allure of iTunes

    Research · 130 comments

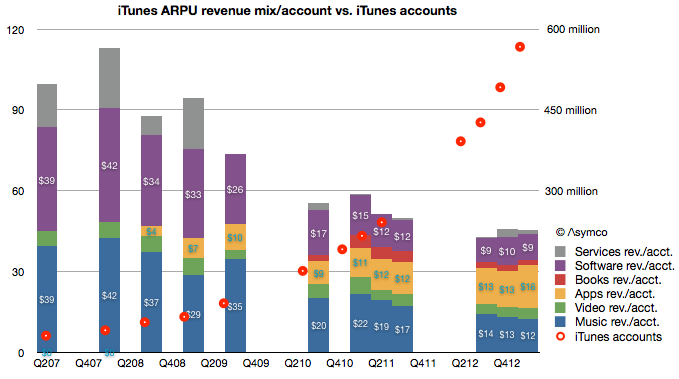
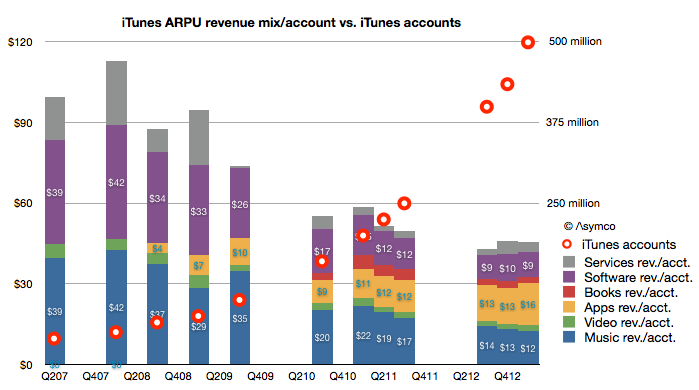
    My estimate of last quarter's iTunes gross revenues suggested a spending rate of $40 per iTunes account. It would make sense to consider how that figure changed over time. The following graph shows the pattern:

    Screen Shot 2013-05-14 at 5-14-9.49.40 AM

    You can read each bar in the graph as the total "ARPU" or average revenue per iTunes user[1].

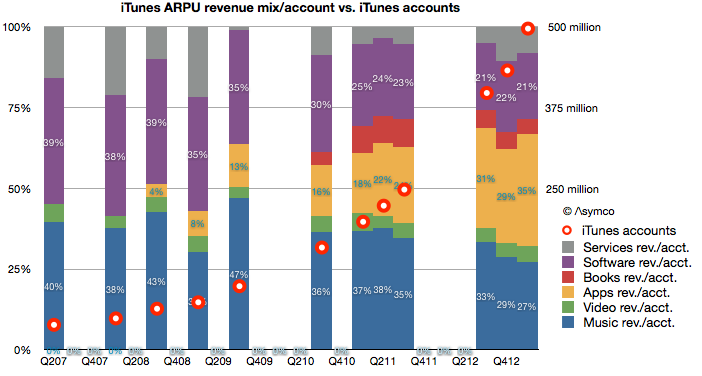
    I overlaid a graph showing the total number of accounts as reported by Apple to the (retroactively) estimated revenue structure. Account totals are measured with the right axis and ARPU with the left.  Note that I also broke down each component of iTunes as currently defined (Music, Video, Apps, Books, Software and Services.)[2]

    The time frame covered is from Q2 2007, or the quarter prior to the iPhone launch. A few patterns emerge:

    • When there were no iOS devices (and hence no iOS apps) the revenues of iTunes consisted mostly of music sales. Those revenues were, on a per account basis, roughly comparable with Apple's Software revenues.
    • As iOS devices proliferated, the number of accounts (and users) grew. They doubled in the first two years (2007 to 2009) and doubled again in the following year (2010) and doubled again the following year (2011) and doubled again in the following 18 months. This rate of growth was accompanied by a reduction in the iTunes ARPU of about 50% (from $99 to about $45).
    • The reduction in ARPU has moderated in the last few quarters. ARPU fell 10% from $50 to $45 during the last doubling of accounts (from 225 million iTunes accounts to  500 million accounts.) In contrast ARPU fell 20% from $74 to $58 during the penultimate doubling (from 100 million to 200 million)
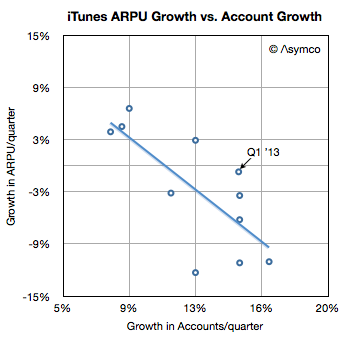
    • However, growth in accounts is broadly inversely proportional to growth in ARPU. In other words, the faster the growth in users the faster the decline in ARPU. The recent moderation in ARPU erosion is also coupled to a moderation in user growth (most recent doubling took 18 months vs. 12 months for previous doubling.) This is as would be expected as a broader, later user base tends to consume less than a narrow, early base. This can be seen in the following scatter plot:
    Screen Shot 2013-05-14 at 5-14-10.35.02 AM
    • When seen as a percent of mix, Apps have grown to be the largest component of iTunes spending. Apps have 35% "share of wallet" while music has dropped steadily from 40% to 27% (or $39 to $12/yr.) This is shown in the following graph.
    Screen Shot 2013-05-14 at 5-14-10.34.45 AM

    As apps have grown to consume more and more of users' time it stands to reason that they should consume more and more of users' wallets.

    And as accounts reach one billion, we can begin to think about the disruptive impact on other media types. Whereas video, books and music are targeted to smaller user bases, apps are broadly consumed. Developers like Rovio or Supercell can offer their products to billions while TV producers can only hope for millions. Apps are becoming the universal medium for entertainment and iTunes the universal distributor.

    Talent is catching on to this faster than those who manage and distribute their work. The inevitable result will be a mass migration of talent away from the established content industries. Old media won't fade due to a loss of users. It will fade due to a loss of talent.

    --

    Notes:

    1. An account is not necessarily a user so perhaps more appropriately the acronym should be ARPA (average revenue per account). Unfortunately that acronym is taken.
    2. The complete model is available for purchase through Asymco Store.
  9. Making rain

    Podcast · 72 comments

    The following is a slightly edited transcript of a portion of the Critical Path podcast #79. I am reproducing it here for the sake of brevity and focus of discussion.

    ---

    I'm going to try to put together an analogy together here that maybe will help us think through the Facebook Home and the Google Fiber issue.

    I've been thinking a lot about how to illustrate Google's business model. The problem is that discussion has been polarized: Two camps have formed. One camp suggests that Google is a benevolent entity that does great things and only asks that we indulge their hobby of a business model called advertising. Fundamentally they are about pushing the envelope on technology, making wonderful things happen.

    That is one camp. I call them the utopians. It may not be a nice thing to call them but I frame it as being exceedingly idealistic.

    The anti-utopian camp is one that suggests that Google is an advertising company primarily, and fundamentally and overwhelmingly. And anything they do technologically is in support of that. The implication is that Google is sinister and manipulative, bent on getting away with as much privacy extraction as possible.

    I believe that the anti-utopians dismissing Google as an advertising company sounds a bit incomplete. It's not incorrect. It's not erroneous. It's just not a complete story.

    And also the utopian view that they do everything for us out of the goodness of their hearts and that advertising is something that they are reluctant to do, saying in effect, "We only do it because it earns us enough money so that we can do good deeds." That too is not an accurate picture. Google is a business and its business management team is hard nosed and knows what they're doing and they are not purely idealistic in that sense.

    And so the question could be where across this spectrum does Google lie? Possibly it moves around between these points. Where they are becomes a question of motivation and what they want to become.

    But this is only one dimension. It does not help us answer the question of Home, or Fiber or Reader or Blink. Their actions seem contradictory. Holistic or selfless in one case, greedy and capricious in another.

    Let's step out of this spectrum and try to think of different ways which can describe the situation.

    I propose a way to think about it as: Google tries to make a business succeed through having a huge amount of _flow_ in terms of data, traffic, queries and information that is indexed. So think about this idea of them tapping into a vast stream. The more volume that is flowing through the system the more revenue they generate.

    As so given this very rough analogy I try to sharpen it up by saying: imagine it more as a river. And even more than a river, as a watershed, a river basin. Perhaps a giant basin the size of a continent. The business is, let's say, capturing fish at the mouth of the biggest river, before it exits into the ocean at its delta.

    And so your job (as Google) is to catch fish mostly at one point. It's the most efficient way to catch fish because you have the most flow of water at that point and building nets is not trivial.

    But in order for you to improve your business, to create more opportunity, presumably, you want to essentially have more water flowing.

    And so how would you do that? Think of the Mississippi river. If you've got a net down at the bottom of the river, the question is how would you engineer, through civil engineering, or shaping the earth itself, a way of catching more fish.

    The answer I think, in terms of the way Google might be thinking, is that they want to create more sources of water. So they would look to connect tributaries and lakes. "How about having another river join our river?" Let's make sure that we have "everything east of the Rockies" flow into our river system.

    Now, think of it this way: After you've gotten all the tributaries, what are the remaining sources?

    First, you'll want to make sure that no-one can dam or stop the flow of water into your main channels. And so you become extremely anxious about people building dams. That's the number one concern.

    So your strategy becomes one of "how do we avoid dam building"?

    That's one part of your strategy.

    The other thing you could do to improve your business would be to make it rain more. So there's the question in your mind of: If we had more rainfall, then everything will flow more rapidly and we'll get many more tiny rivers forming and joining together into our main river.

    Android and the Fiber business and even Facebook fit into this analogy rather well. In this context more rainfall means more people using the Internet. If you have more people you'll have more rivers and you'll have more water and hopefully more fish. Fiber means the water will flow more rapidly: you're essentially dredging the riverbed.

    But the two are very disconnected (rain, dredging and fish). So your strategy amounts to not really worrying about the ratio. You don't create incentives to people who make rain in the form of fish catch quotas next quarter.

    In other words, your performance as a manager of cloud seeding efforts should not be measured in fish.

    Leadership should instead simply put out the mandate of "Go out and make it rain".

    So that's the notion of Google going out on these projects and doing all these "great things" for us. They make it rain. The Internet expands. There is minimal censorship.

    By the way, censorship is a dam. Being blocked out of a country is a huge dam. It's actually more like building a mountain range that diverts water flow away from your watershed.

    And so they have these notions of how to prevent these things from happening.

    So it sounds like they are doing good things. It sounds like asking for it to rain; they want to make sure that people don't divert resources; they want to make sure that there are no barriers between the raindrop and getting access to the channel to the ocean.

    So it sounds like they're doing all the good things like a good civil engineer. Like the US Army Corps of Engineers who developed the irrigation, flood control, energy generation and waterway transportation of the United States.

    Google seems to be the world's "internet civil engineer". They are building all these things to make sure that we have good water (i.e internet) supply. That we have plenty of navigable channels. That's the analogy.

    But let's not forget that the only reasons those things are happening is because they are catching fish at some point down the Mississippi.

    From that point of view you have to ask yourself: do they deserve this concession? Because they are ultimately affecting the environment to such a degree; and the environment is the internet; and the whole scope is how the world operates.

    That is where people have to step back and ask themselves: Even a group of civil engineers that have all the best intentions may realize that they didn't think of all the consequences of their actions. A lot of the criticisms may come decades later. From people who'll note an effect on the environment. Dams get silted, a lack of floods reduces nutrients to crops which then need fertilizer, which has a whole other set of problems.

    That is when you have to reflect more deeply on what is right and what is wrong. So saying, as the City Council of Austin might: thank you for coming and paying for installing broadband for us. Fine, but we just don't know what the unintended consequences might be. It all _sounds_ good but we don't know if it _is_ good.

    And similarly, in the case of Facebook, there is a subtle hijacking going on where Android creates more rain, and Facebook and Amazon are essentially putting down nets and catching fish upstream. They're not damming the tributaries. They're not putting up mountain ranges and saying they'll make sure the water flows away from the Mississippi. But rather they are putting nets and saying "Thanks for the rain". They took advantage of what amounts to a public resource. Here the failure of anticipating consequences falls on Google. But they could not have possibly foreseen all that? Or could they?

    Then there is the question of measuring success. It's complicated and hard to measure performance. Even Google's own performance. We don't really know if the cloud projects work. We don't get to run this as an experiment that can be tweaked as data comes in.

    Google does not report performance. When they go off on these rain making projects, it's natural to ask how many fish were caught as a result. Is that incremental new rainfall causing more fish to get caught. And Google won't say anything about the profitability of rain making. They will never give you a profit and loss statement for all these projects: the dam eradication project, the project dredge a channel, the project to seed clouds. They will say that these are projects that will result in only one thing, which we do measure, which is the number of fish we catch in the delta of the Mississippi down by New Orleans. But so far although rainfall seems to be increasing exponentially there are not that many new fish.

    So that's where we struggle as analysts: is rainmaking good? Is the dam destruction process working? We can't answer these question. And we don't even know if Google themselves can. They might think of it as a strategic thing: it's always better to have more rain than less and more water flowing. End of discussion.

    To borrow a phrase from Zuckerberg, it's above my pay grade to know what all the consequences are. I have opinions as environmentalists have opinions and sometimes they have some data to back up those opinions. For instance whether a dam project is a good thing on balance. But they are bound to have partial answers because the cost/benefit analysis is definitely missing a lot of the costs and missing a lot of the benefits as well. You can't put a number on a lot of these things.

    That's where we are today. Google and Android are forces which are are very powerful but which are, to a large degree, uncontrolled, even by their own managers.
     

  10. Reasons for iOS outperformance in the US

    Research · 145 comments

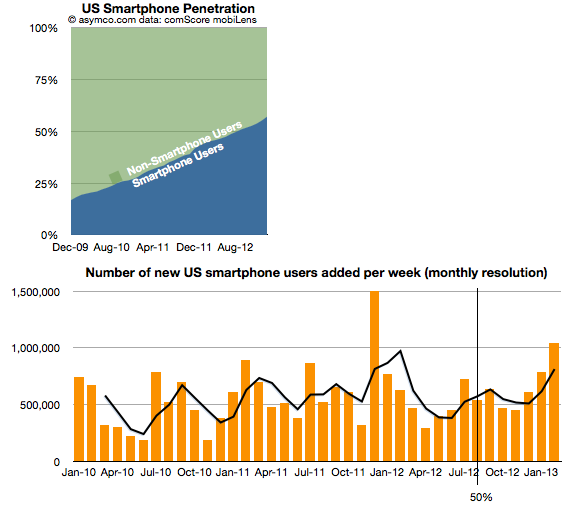
    The comScore mobiLens survey for the US ending February 2013 shows continuing rapid expansion of smartphone usage in the US. Even though the 50% penetration threshold was passed seven months earlier, the rate of new smartphone users was second highest ever recorded with over 1 million new-to-smartphones users every week during February.

    Screen Shot 2013-04-05 at 4-5-4.15.52 PM

    Overall penetration increased to 57% with nearly 2% of the population switching in one month. Using the average growth rate for the last six periods, the US could see 80% penetration in another 19 months or by Q3/Q4 2014.

    It remains to be seen if the consistency of growth which was preserved from 20% to 60% is maintained between 60% and 80%, but all indications so far are that it will be.

    The growth in smartphones has been driven by the two dominant platforms: iPhone (iOS) and Android. Together they now make up 91% of the user base with about 40% for iPhone and 51% for Android.

    Screen Shot 2013-04-05 at 4-5-4.19.14 PM

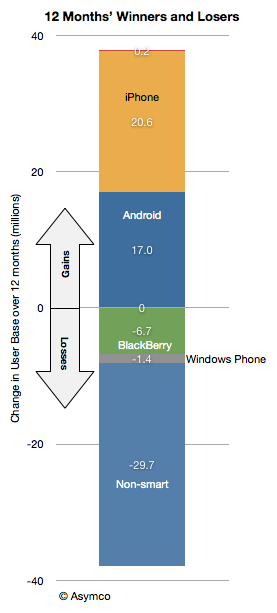
    Android alone gained 17 million users in the last 12 months while iPhone gained 21 million users.

    Screen Shot 2013-04-05 at 4-5-4.20.02 PM

    iOS user gains have out-paced Android for the last four periods which resulted in a decrease in Android share of users. A reduction in Android share was also visible in the spring of last year but the current decline is not only longer but more pronounced.

    Screen Shot 2013-04-05 at 4-5-4.22.13 PM

    The reason iOS is growing more rapidly may be due to three factors:

    1. Broader distribution with three out of four major operators carrying the phone
    2. Availability of three product variants with $0 starting prices.
    3. Increasing awareness and use of apps and content ecosystems due to network effects.

    As distribution is about to increase with T-Mobile being added to the carrier list the growth in iOS share is likely to continue even as the market expands.

  11. The cost of selling Galaxies, updated

    Research · 63 comments

    Thanks to @jtk0621 via twitter I was able to obtain a quarterly view into Samsung's SG&A expenditures by cost category.

    The value of this data is in being able to understand why Samsung SG&A as a percent of sales remains fairly constant. To recap, the discrepancy with Samsung's SG&A is that it has grown in proportion to rapidly rising sales. Normally, when sales grow, SG&A grows but when sales grow very rapidly, SG&A grows a bit more slowly since it's primarily a function of headcount and hiring is necessarily organic and hence slower as a process.

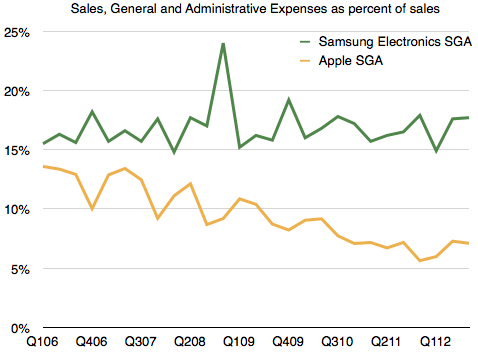
    The contrast is shown in the following comparison between Apple's SG&A and Samsung's SG&A as a percent of sales. [For more detail on Samsung revenue composition see: The Cost of Selling Galaxies].

    Screen Shot 2013-04-02 at 4-2-3.09.39 PM

    Apple's SG&A has declined as a percent of sales, as one would expect, but Samsung's hasn't.

    I have hypothesized that the reason for this might be in the practice of "outsourcing" many marketing functions. As Samsung expands promotional efforts, it does so partially by hiring people but even more so by farming out a lot more work. In this way, if and when sales subside, it can pare costs. This practice ensures that it's not exposed to a huge cost structure that is hard to control. The downside to this approach might be obtaining "quality" marketing as oversight is still depending on inside teams who still have limited resources.

    To test this hypothesis, I looked at the types of costs it reports and divided them into two categories:

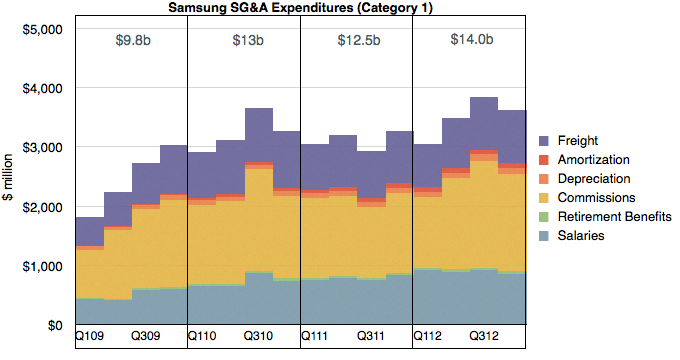
    Category 1 are what might be considered "internal" costs which are in function of employees or operations. These costs are:

    • Salaries
    • Retirement Benefits
    • Commissions
    • Depreciation
    • Amortization
    • Freight

    I graphed these costs over time below:

    Screen Shot 2013-04-02 at 4-2-3.12.09 PM

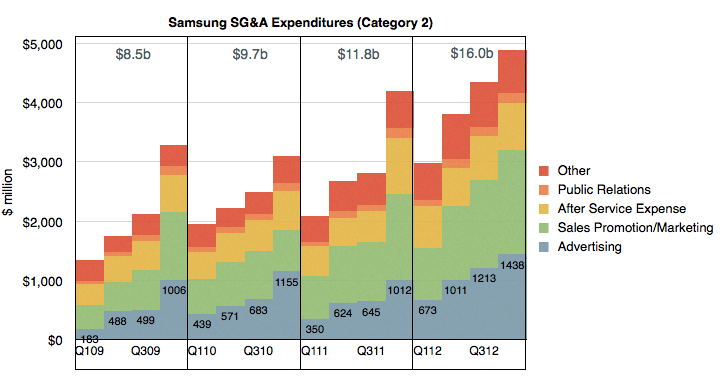
    Category 2 costs are those which can be "outsourced" and are in function of budget items. These are:

    • Advertising
    • Sales Promotion/Marketing
    • After Service Expense
    • Public Relations
    • Other

    I graphed Category 2 costs below:

    Screen Shot 2013-04-02 at 4-2-3.12.58 PM

    In both cases I created year-sized buckets summarizing these expenditure categories.

    It becomes apparent at first glance that through the period shown (2009 through 2012) Category 2 costs grew much more rapidly than Category 1. In 2009 Category 2 were less than 1 but the order was reversed in 2012. On a yearly basis Category 2 nearly doubled while Category 1 grew by about 40%.

    When seen in this context, the hypothesis is proven. The growth in Samsung SG&A has been driven by a vast expansion of primarily Advertising and Sales Promotions.

    It's hard to get an appreciation of the scale involved due to the lack of comparable SG&A category reporting from other companies.  What we do have however is that US companies typically report their advertising spending on a yearly basis.

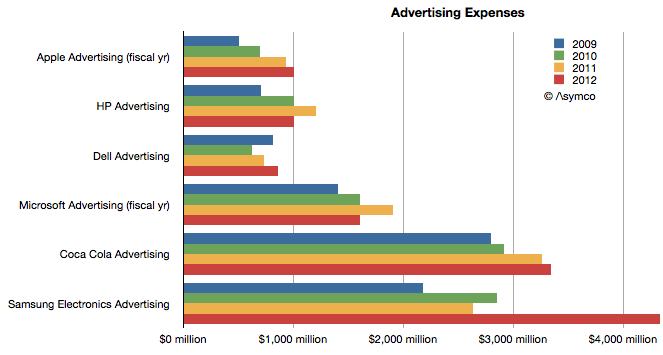
    So taking only the Advertising figure from Samsung Electronics, we can get the following comparison with Apple, HP, Dell, Microsoft and Coca Cola.

    Screen Shot 2013-04-02 at 4-2-3.20.48 PM

    In this context we can see that while both Apple and Samsung grew their  advertising almost at the same rate, doubling their budgets during the last four years, Samsung Electronics has a far higher ad budget. More than four times higher, actually.

    Regarding Sales Promotions however, the comparison is far harder to make. I haven't any way to guess how much Apple spends relative to the $5.3 billion Samsung spent.