Asymco

Asymmetric Intelligence

analyst

  1. Surprise

    Research · 46 comments

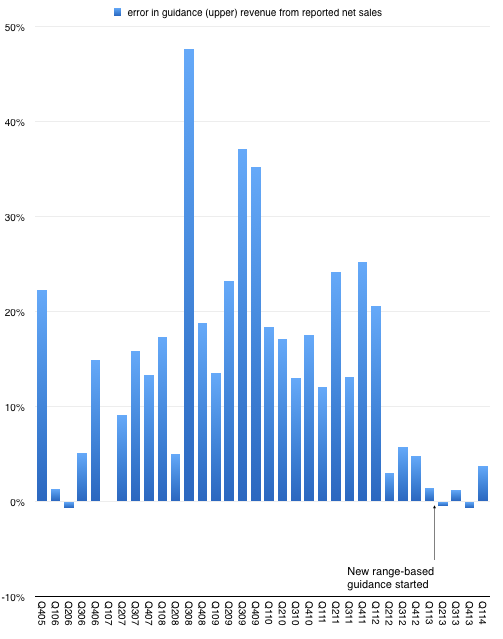
    After n quarters of predictability, Apple surprised with sales performance that was 3.74% above the top of their guidance. This may not seem significant but since instituting a new range-bound guidance method in Q1 of last year the company reported revenue within about 1% of the top of the range.

    This is in stark contrast to the wide variance in prior years. The following graph shows the "error" in guidance as the percent difference between reported sales and guidance ((Upper end of range in quarters where a range was given.)).
    Screen Shot 2014-04-25 at 4-25-10.18.06 AM

    So prior to last quarter we were lulled into thinking that guidance was very nearly perfectly predicting the company. As I tweeted, it took the "sport" out of trying to do any forecasting. All an analyst had to do is tweak the main product growth figures to hit the sales target and then subtract the (generously provided) operating expenses and (also provided) tax rate to get the earnings. Only unknown to getting to an estimate of EPS was how many shares would still be outstanding. ((The company itself would not know shares outstanding as their buying was opportunistic during the quarter.))

    Knowing Apple also means that average selling prices are also very rigidly set in stone so the degrees of freedom in analysis were becoming highly constrained.

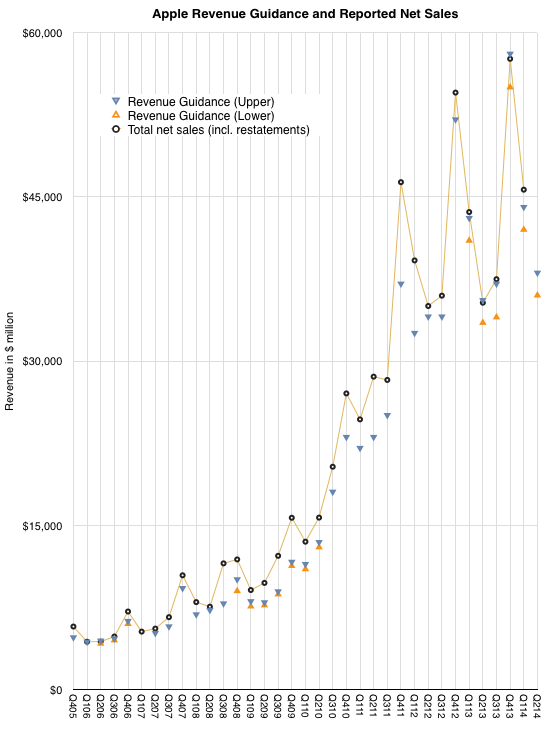
    But just when you think you spotted a pattern, it changes. The company surprised with performance outside the band. The following graph shows the estimate ranges it has given and the actual revenues delivered. ((Next quarter is also pencilled in.))
    Screen Shot 2014-04-25 at 4-25-10.19.24 AM

    So what happened?

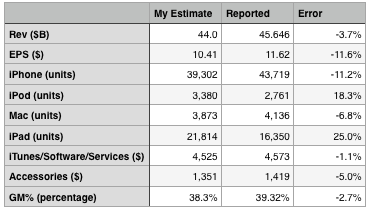
    The answer seems to be better iPhone performance. The following table shows my expectations, which were tuned to return revenues exactly at the top of the guidance range.
    Screen Shot 2014-04-25 at 4-25-10.25.16 AM

    On product shipments/sales I underestimated the iPhone and Mac and overestimated the iPad and iPod. I estimated iTunes accurately and underestimated accessories by 5%. I also generally got the blend of margins fairly close, being 1 point too low on gross margin.

    The bottom line was that the Revenue and Earnings surprise could be accounted for through a significant outperformance on iPhone which offset a less significant underperformance on the iPad.

    The iPhone grew sales by 14% which more than offset a drop of 13% in iPad sales and was enough to allow net sales to grow by 5%. Since the company guided nearly flat growth, that 5% was a big surprise.

    Now one could ask whether 14% growth in the iPhone revenues is a meaningful change in the long-term evolution of the category. This is a difficult question. The way the iPhone is positioned makes it a great success in the premium segment of the market but it does not place it in competition with the perhaps 80% of the market which seems to be defined by a lower price point.

    However let's not forget that pricing is correlative to the market but it may not be causal. Purchase decisions are complex and price is one aspect of that decision. But there are many others. Availability, channels, service, brand all play parts. The error of many analysts is to conclude that price and price alone is causal to behavior. That may be so with commodities, but let us not forget that these products and their uses are newly created and how value is perceived has been changing rapidly. Buyers follow a learning curve in terms of discovering the uses and value of products. These learning curves can be modeled and usually show several years (sometimes decades) for most populations between early and late adoption.

    We don't know where the iPhone is on the learning curve for any particular region and that means we can still be surprised by how it grows.
  2. Renaissance Session: Opportunities

    Research

    Horace Dediu is an analyst with a focus on the mobile phone industry and especially Apple. Blogging at asymco.com, he often posts surprising facts that confront the conventional "wisdom" of other analysts, who are often predicting doom-and-gloom for Apple.

    We asked Horace to share his thoughts on technology, change, and how to anticipate the next big thing.

    via Renaissance Session: Opportunities.

  3. Google's three Ps

    Research · 185 comments

    A company is nothing more (and nothing less) than three things: people, processes and purposes. In the language of the software engineer these would be inputs, algorithms and specifications. In the language of classical business analysis they are assets (or resources), organization structures and business models. In military theory, these are logistics, tactics and strategy.

    This is the trinity which allows for an understanding of a complex system: the physical, the operational and the guiding principle. The what, the how and the why.

    When approaching any analysis problem, these questions form the foundation of causal inference. What is it, how does it work and why does it exist?

    When analyzing nature the sciences often help with the what and the how but rarely address the why. ((Religion attempts to answer the whys which science leaves as unanswerable.)) In contrast, man-made systems (e.g. systems of law, religion and commerce) require an answer to the why as there is a presumption of a will in their creation and preservation. The why allows ultimate judgement on the merit of an enterprise. The why may escape us but it's assumed to always be there. For instance, in criminal law the motive is often a crucial piece of evidence but it's not always found. In business, the motive for action or for organization is a crucial piece of the puzzle which often explains the what, who and how, but here the ultimate why is usually profit. This the characteristic of a for-profit business, the purpose is explicit.

    Some companies try to define their purposes beyond profit but they are often too vague or merely speak of values represent a quality not causality.

    This is the case with Google. The problem isn't only that "don't be evil" isn't a priority or a purpose, but also that its resources are not applied to cohesive goals. In fact, there seems to be no interest in pursuing a direction aligned with generating income.

    This is not in itself a bad thing. The notion of operating as a learning (vs. a deliberate) organization, informed but not driven by a goal, is the best approach when seeking new markets or discovering new needs and new business models. The difference with Google is that there seems to be no expectation of business model discovery. In other words, that the learning is not for any purpose other than learning itself.

    This might be noble but learning for its own sake has not been attempted by public, for-profit organizations ((The Bell Labs story in an interesting possible exception but on deeper inspection it was the by-product of a  government sanctioned monopoly and hence a ward of the state)) since there is an implicit fiduciary responsibility to generate profit and unrestricted experimentation, unguided by profit, is unlikely to ever learn the needs of markets.


    The evidence I note supporting this is in the persona the company maintains, both internally and externally. There is no representation of themselves as a "business seeking profit" or even as a commercial entity. It's not simply because their business model is embarrassing. It's because all business models are embarrassing.

    The representation is one of a research laboratory succeeding against difficult problems. Very similar to a successful academic or industrial laboratory sustained by grants from a benevolent (but messy) organization. Google becomes the embodiment of "big science" and "the world's laboratory" unfettered by politics and unsoiled by commercial interests.

    There is a business in Google but it's a very obscure topic. The "business side" of the organization is only mentioned briefly in analyst conference calls and the conversation is not conducted with the same team that faces the public. Even then, analysts who should investigate the link between the business and its persona seem swept away by utopian dreams and look where the company suggests they should be looking (mainly the future.)

    There are almost no discussions of cost structures (e.g. cost of sales, cost of distribution, operations and research), operating models (divisional, functional or otherwise) or of business models. In fact, the company operates only one business model which was an acquisition, reluctantly adopted.

    It's as if the management is not only uninterested in its own profit model but deeply scornful of it. For all the technology innovations the company can claim, it has not had one internally sourced business model innovation.

    But is this wrong? Again, we need to ask if Google breaks with convention then maybe convention needs to be broken. This is the radical bet underlying the Google thesis: are business models necessary? This is in fact a bet many VCs are implicitly placing within the current start-up culture. The notion of making a profit or even having an interest in doing so seems passé. This notion is directly traceable to the Google ethos as it acts as the source of acquisition funding and is driving the agenda of VCs and entrepreneurs. This is leadership by example and the example is one of blissful ignorance of market constraints.

    But we have to go back to the profit model, even if analysts, observers and the company itself sweep it under a rug. The reason is that this laboratory runs only as long as the grant money keeps coming. No bucks, no Buck Rogers. So far the money rains down from heaven, but that rain is not infinite nor permanent. The answer seems to be diversification, even the creation of a conglomerate. In other words, the answer seems to be that if enough great technology is developed or acquired, then a business model will appear (think about it as a probability problem) and the vulnerability of revenue sources is managed. Clever? Convenient? We'll see.

    But that's not the only problem. The deeper problem is in us knowing their intentions. The absence of a purpose rooted in profit makes Google resistant to analysis. There might be a purpose, known only to the founders ((or not known at all)), but it's one that is potentially naive, amoral or too abstract to be useful. Shareholders are aware of this and have agreed to entrust control to only three individuals. The purpose of the organization is in their hands alone and reflects their priorities. Bearing in mind that the road to hell is paved with good intentions, they must be brave indeed.

    This would not be too troubling if the effect would be restricted to the company stakeholders. The trouble lies in that organization also having de-facto control over the online (and hence increasingly offline) lives of more than one billion people. Users, but not customers, of a company whose purpose is undefined. The absence of oversight is one thing, the absence of an understanding of the will of the leadership is quite another. The company becomes an object of faith alone.  Do we believe?

  4. Dark Matter

    Research · 84 comments

    Benedict Evans explains well the problem with measuring Android tablets. There are no reliable data collected because many of the devices are invisible through the regular, measurable channels:

    • There are no firms which report their shipments
    • They are not sold through retail chains which normally are sampled in the US and Europe (NPD and GfK respectively.)
    • They don't show up in browsing or ad transaction data
    • Google Play statistics are missing most of the activations since they are not sold as bona fide Google-sanctioned Android.

    The only measured statistic happens to be component shipments. Items such as screens, CPUs or perhaps memory might be visible to market analysts. It's therefore tempting to add up tires manufactured to determine what's getting sold in auto dealerships.

    But it's also hugely problematic.

    Before we go into that rat's hole, I want to re-visit my original criticism for market analysis based on device attributes. When the iPad was new it was famously labeled a "media tablet" by Gartner and excluded from being counted (and hence compared) with PCs. This created an implicit signal to the analyst's clients to ignore the entrant as irrelevant.

    That actually accelerated their demise (and the revenue prospects for the analyst).

    In contrast to that exclusion--of a clear and present danger based on an arbitrary definition of form factor--the analyst who defines categories of products purely on the definition of their components is guilty of the same sin.

    Snowing the audience with irrelevant comparisons is just as bad as withholding relevant comparisons. This is explicitly asked of witnesses: to tell the truth, the whole truth and nothing but the truth. The "nothing but the truth" means the exclusion of irrelevance.

    The correct approach is to identify which devices are comparable (and thus in the same category) based on the jobs they're hired to do. If a tablet overlaps considerably in the work it does with a PC (e.g. browsing, email, media play, and other applications) then they should be considered comparable. If a tablet does nothing that a PC does or nothing that an iPad does (e.g. no browsing, email, apps or ecosystem activity other than piracy) then they should not be considered comparable.

    Which brings me back to the question of what these dark matter "Android tablets" actually do.

    To answer I want to recall another "dark matter" technology that seems to have gone largely unnoticed but was exceptionally popular. This was the VCD or Video CD. It was an alternative to the DVD without the licensing and DRM overhead it entailed. It was extremely popular in Asia as a way of not only buying but also sharing video content. The cost of content was a fraction of sanctioned versions, essentially taking the role that mass-copied VHS had in previous years.

    The "job to be done" was to enjoy video content cheaply and conveniently for the equivalent of pennies a day. A job very similar to what we think of as cable TV today.

    These devices and discs were largely invisible mainly because they did not exist in economies which adopted protected DVDs and because the content consumed did not hit against any databases that tracked consumption. Nevertheless there might have been hundreds of millions of these devices sold and billions of discs viewed.

    Now we are in a situation where devices whose primary purpose is to watch video content (cheaply and conveniently) are being counted. By their counting, their implicit competitiveness is asserted. But it means nothing if they are not hired for the same jobs. In fact it misdirects attention.

    Sometimes these "low end" devices do grow up to swamp the higher-powered alternatives with good enough functionality. That is the innovator's dilemma for low end disruption. But in some cases they don't because other factors are at work. Because ecosystems have complex multi-sided markets and because regulations and channels and consumer behavior conflict with the technical specification.

    For this reason the VCD did not "disrupt" DVD or grow up into a Blu-Ray equivalent that caused Hollywood to crumble. It faded away as an anomaly.

    Whether the dark matter Video-only Android device will come to swamp the iPad will depend not on just volume shipments in select geographies. It will depend largely on the ecosystems built around it. The ecosystems of VCD were largely unsustainable because there was no value placed on the content itself. The value chain did not strive to sustain the technology. When something better came along, it got dropped.

    In contrast, content-based value chains sustain technologies which keep the revenues coming. And we can measure this revenue.

    You don't need to look too hard for that in tablets. Apple states it quite frequently: total payments to developers.

  5. How many smartphones did Samsung ship in Q2?

    Research · 62 comments

    50.2 million.

    That's the estimate from IDC. So why bother asking?

    Because that is an estimate. Of the 104 million Android phones shipped in the quarter (itself an estimate from another, possibly different methodology), I could only account for 7 million actually reported. That figure comes from a close reading of an investor presentation from Sony. HTC does not report their shipment numbers. It stopped some time late last year. Neither does Motorola now that it's a part of Google. Huawei is silent except for setting targets and ZTE published a press release citing IDC's estimate of its own shipments.

    But most glaring of all is the absence of any mention by Samsung of its performance. The company stopped reporting any data on either overall phone shipments or of smartphones within that total since Q3 2011. We may have been able to estimate Samsung if we had more competitor actuals, allowing us to back into a figure. But we don't.[1]

    Which leaves us with IDC's estimate[2]. But the problem is that since the industry is growing so quickly it is very sensitive to assumptions. Consider how difficult it is for consensus estimates for Apple's iPhone shipments to come near the actuals--and that's for one quarter, and knowing all the previous quarters with precision. The absence of visibility into the assumptions made by market analysts (or their methods) should lower confidence in the results.

    Consider that IDC specifies 50.2 million Samsung smartphones, implying an accuracy down to 100,000 units. Is this accuracy believable?

    There is reason for doubt.

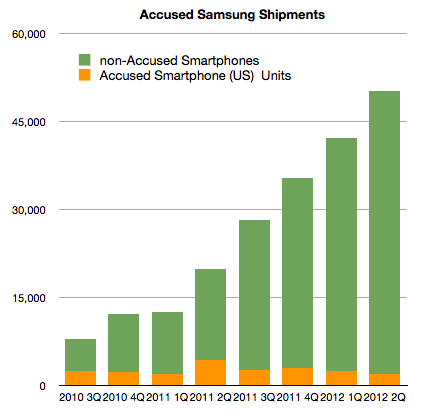
    I start with the following graph:

    It shows the estimates for Samsung global shipments (latter four quarters are estimates without the benefit of company reports.) I separated the component of shipments that Samsung reported as part of its submission to the Samsung v. Apple trial in California. Note that this (orange) segment consists of most US smartphone shipments. It's not all US Samsung shipments. It notably excludes the Note, the latest Nexus and the Galaxy SIII.

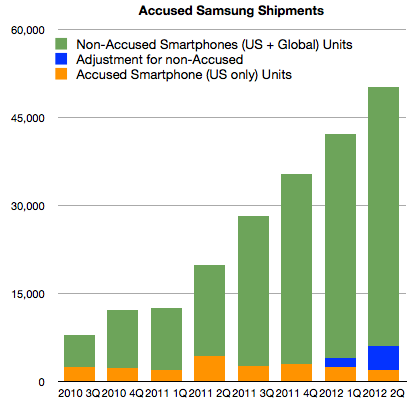
    Without these "non-accused" phones, it would appear that Samsung's US volumes dropped to 4% of global totals from a 10% average[3]. In order to return to 10%, the US totals would need to be adjusted as shown below:


    I added 1.5 million units in Q1 and 4 million units in Q2 (to account for Galaxy SIII).

    So far this seems consistent with the total estimated global shipments of 50.2 million from IDC. US units would result in 12% of global shipments.

    However, there is more data we can test against. First, we are also given pricing for the US phone portfolio, or at least we have revenue per unit sold. This allows us to get an idea of what revenues can be obtained for the smartphones in the US, and possibly world-wide[4]. Knowing prices for smartphones and knowing global sales (which Samsung reports) and finally knowing global total phone shipments allows us to price the average non-smart phone.

    Excluding the non-accused smartphones, the average revenue per smartphone in the US for Samsung in Q2 was $339. Adding in the estimated Galaxy SIII (4 million) at an average price of $470 gives a new "ASP" of $413.

    This is where the analysis goes off the rails.

    If we assume the global ASP is equal to the US ASP and knowing everything else about the mix of smartphones (54% of total) and revenues (as reported) yields a negative ASP for feature phones. Assuming the revenue figure is correct, either the number of smartphones is wrong (50.2 million) or the global ASP ($413) is wrong. The total phone number is also an analyst estimate which can be called into question.

    There are many assumptions being multiplied here so I have very low confidence in the result, but we should ask "what do you need to believe" in order for the 50.2 million figure to be real. The following scenario for example has to be true:

    1. Global Samsung phone shipments total 93 million units (which means 42.8 million feature phones sold as well as the 50.2 million smartphones).
    2. 6 million smartphones shipped into the US, equivalent to about 50% increase y/y, roughly in-line with market growth
    3. 4 million Galaxy SIII shipped (but not necessarily sold through) at an ASP of $450. This results in a US total smartphone ASP of $413
    4. The global smartphone ASP is significantly lower (at 80% of the US or $330)
    5. Global revenues of $18.14 billion is essentially all from phones
    6. Global feature phones will have an average price of $36

    If these conditions are met then it's possible that 50.2 million Samsung smartphones did ship.

    The figure for feature phone ASP is difficult to accept as it would be lower than Nokia's. Also, the low global smartphone ASP is also difficult to accept but it might be possible to find a scenario with the above variables which makes the 50.2 million figure believable.

    Unfortunately this is an unsatisfying analysis. I could propose another figure to answer the question in the title, based perhaps on more "believable" assumptions. But I have no means to defend my assumptions. The only option I have remaining is to caution that the total smartphones shipment estimate for Samsung remains precarious. The new evidence from the US trial places more doubt on it but it is not enough to disqualify it entirely.

    ---

    Notes:

    1. This cone of silence over 93% of the most popular mobile platform is somewhat puzzling in contrast to the perfect information we are used to having about iOS, BlackBerry and even Symbian. It seems that the more open a platform, the less is revealed about its market performance. This extends to the licensed Windows Phone whose shipments are only revealed through Nokia's reporting of Lumia shipments.
    2. In the PC market, vendors also selectively publish their units. The norm is, however, not to. As a result IDC et. al. are the only sources for global market data. However, the PC market can be sampled more easily than the phone market. PC retail measurement methods are more reliable compared with all the points of sale for phones.
    3. Note that Apple sells about 30% of iPhones in the US.
    4. Apple's pricing world-wide is very consistent with pricing in the US which makes sense from a channel management point of view. One would not want to create incentives for cross-border arbitrage of phones.
  6. Waiting for Godot

    Research · 46 comments

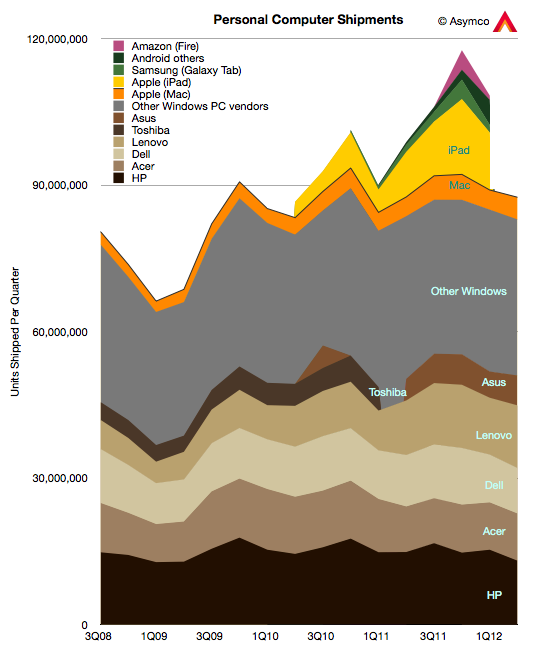
    Gartner has published preliminary PC unit sales for Q2. The data from Apple's Mac sales has not been published yet but based on some estimates, we can draw a partial picture of the personal computer market.


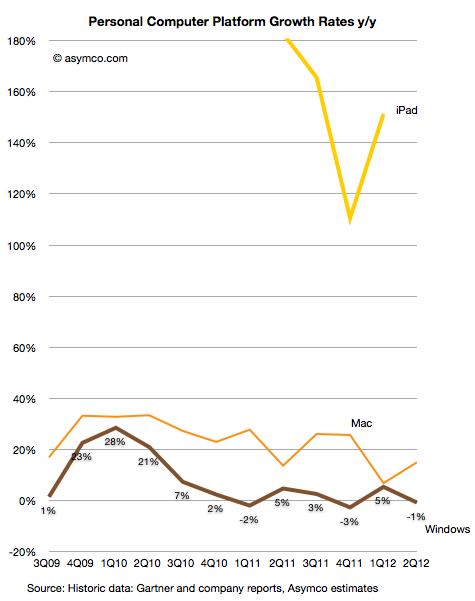
    My estimate is that the Windows PC market fell by 1% while the Mac market grew by 15%. Gartner reports an overall flat market. I'll leave out the iPad for the time being, and show the growth of the Mac vs. Windows:


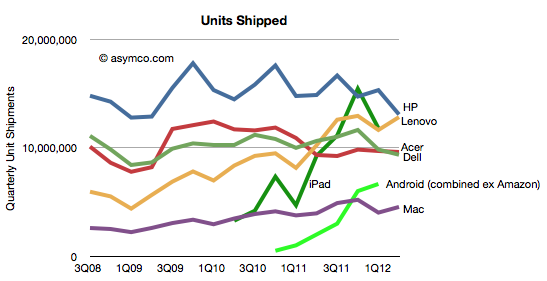
    In terms of individual vendors vs. each other, the patterns are as follows:

    It's perhaps a bit early to tell, but if the Windows PC market continues to slow or contract, it may be possible that HP and Dell will cede their market share leadership positions to Lenovo and Acer. Already "Others" account for as many units as HP and Dell put together.

    If we are to believe the analyst community reflects consensus, the industry, in the aggregate, continues to treat the potential for disruption from devices as unlikely. There always seems to be a wrinkle, a quirk, or an exceptional circumstance that is to blame. I won't get into all the excuses given by analysts for the slowing of PC sales but will point out that there's been a series of initiatives put forward by the industry to act as "catalysts" for growth. So far they have not worked. The current expectation is that Windows 8 will reverse this trend.

    Perhaps. But perhaps the relief, if it comes at all, will be temporary.

    [UPDATE: Due to a data error, the drop in Windows was overstated in the initial version of this post as 10%. It's been corrected to a drop of 1%]

  7. Shipped and sold: A brief introduction

    Research · 42 comments

    Markets are difficult to measure. Mainly because the information is not easy to obtain and that which is obtained is not made public. Collecting, analyzing and filling in the gaps is big business with many firms involved in selling it.

    However, with all the analysts and companies selling and promoting their "numbers" it's important to understand the difference between the methods used. There are for instance at least the following measurements:

    1. Units sold to end users. For example NPD or GfK data of retail transactions. Also Gartner's estimates for phone units sold.
    2. Units sold to the channel. For example units recognized on income statements usually reported by companies. Also IDC's estimates for phone units sold.
    3. Units in use. For example comScore and Nielsen survey data.
    4. Units "activated". The measurement Google uses to describe Android performance.
    5. Intent to buy. For example ChangeWave surveys of early adopters.
    6. Utilization rate. For example browser statistics.

    Each measurement tells a different story about the market but the best story is told when all data is analyzed in a combined integrated market review.

    Before diving into that it's important to understand the difference between the first and second measurements or the difference between shipped and sold.

    What does "Sold" mean?

    Let’s say that you sell a phone to another party. What constitutes a sale? The sales agreement? That you shipped it? That he wanted it? That you were paid for it?

    What if he changes his mind and returns it? Is it still a sale? What if a manager's bonus depends on these sales? What if the company’s share price depends on these sales? Is there a way to rig the accounting?

    As it turns out, yes there are; many ways. Unethical and fraudulent practices happen surprisingly often. A classic instance would be: A customer is shipped ten phones, though he only wants one, and he gets paid to ship the other nine back, after the close of the year.

    The sales manager records ten times the sales he actually made, making ten times the commission and the company’s stock price rises. To compound the offense, the manager could also tip his friends to short the stock at the end of the year, leaving investors “holding the bag” when the inevitable correction follows.

    There have been so many cases of this kind of accounting fraud that the FASB (GAAP), SEC, and IFRS have placed a very stringent definition on “revenue recognition”. This means that although you can sell all you want, the company can only recognize the proceeds and profit in the financial statements according to strict rules.

    In the case of hardware (Sales of Goods), the customer must receive it (“delivery has occurred”), and like it enough to not return it (“amount to be refunded”), and be able to pay for it (“collection is probable”). If some are projected to be returned or unpaid, that percent is subtracted from total revenue. In the case of software (Sales of Services), it is generally accounted for over a time period. And because it is customary to send the customer upgrades, the revenue must be spread out over the time the service is provided. (“upgrade rights … 24 to 48 months.”)

    It gets complicated when a piece of hardware has upgradeable software. The rules used to stipulate that the hardware, in its entirety, must be accounted for as a service and have subscription accounting. This is how Apple had to report sales during the first few years of the iPhone. It still defers some revenues for its hardware, mainly on account of iCloud, but the vast bulk of hardware revenue (96%) is now accounted upfront, recognized upon the product's acceptance by customers. 4% is for software upgrades and is accounted for over a specific lifetime of the product (24 months in the case of the iPhone).

    What does "Shipped" mean?

    The discussion so far implies that if a product that is accounted for as "Sold" on an income statement does not mean that it's in the hands of an end user. These "revenue recognized" products are sold to a distributor, typically for a phone that's an operator.

    These sales satisfy the requirements for financial reporting as revenues booked. But they are not in the hands of users. Nor are they "activated" and they don't generate page views that are measured by web analytics companies. Most analysts and companies now use the phrase "Shipped" to describe these revenue-recognized units though it's also common to hear "sold".

    When a product sells to end users it's sometimes called "sell-through". It's counterpart is "sell-in" which is sales to the channel distributors.

    A big gap between sell-in and sell-through might imply large amounts of in-channel inventory. This is product that is sitting either in stores or in warehouses or on trucks in transit. If sales are steady, the inventory is measured in time as in "weeks of inventory". This means that the excess is expected to be sold within a fixed time frame if shipments were to end. The smaller this amount, the better or "tighter" the operations are. Inventory, as Tim Cooks says, is fundamentally evil. It eats capital and erodes profitability.

    Sometimes miscalculation of sell-through could result in vast amounts of inventory that has to be returned by distributors. That inventory is either written off or sold at fire sale prices resulting in a "write-down". This happened recently with both the HP TouchPad and with the RIM PlayBook. This special charge against income is a one-time (usually) incident but it can also affect a firm's reputation with channel partners for a long time. This type of failure is very costly.

    Therefore what matters most is to keep the difference between Sell-in and Sell-through as small as possible. However, it can't be too small. Sometimes if Sell-through is too fast, you get stock-outs which means that there is more demand than supply and sales opportunities are missed. This has happened many times with iPhones and iPads. This is also an unwanted situation (unless there was too much inventory in the channel during the previous period and thus it was being drained in the current period.)

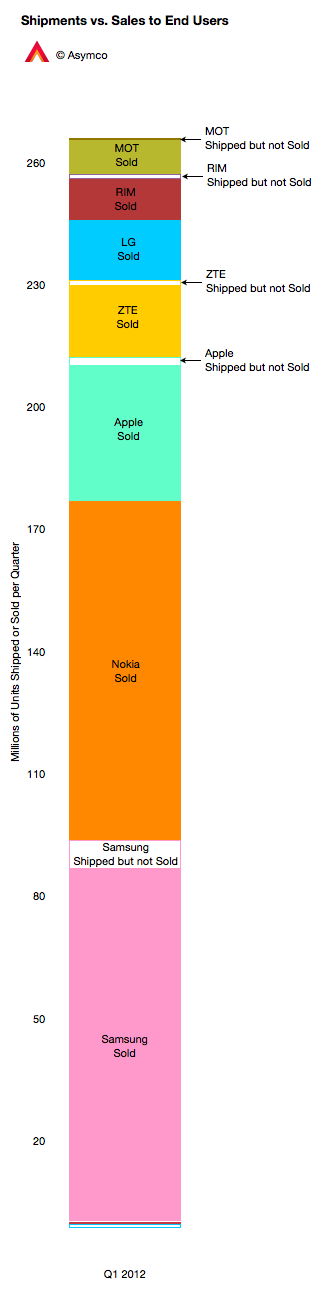
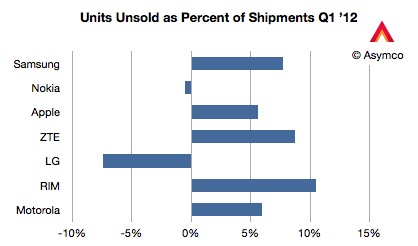
    The chart to the left shows how the phone market looked for various vendors last quarter. I compiled the data based on Gartner's "sales to end users" and IDC's "shipments" data. Two vendors had higher sell-through than sell-in (Nokia and LG) probably because they were draining excess inventory. The others had channel inventory of between 5% and 10% of units shipped.

    This ratio is shown below in a chart comparing the largest phone vendors.

    Management is often rated for performance on this metric, as they should be, since it's a measure of operational skill. However, there are many factors that affect overall performance.

    New product launches, windows of opportunity related to seasonal buying patterns, anticipating macroeconomic slowdowns, even natural disasters and legal challenges can affect this metric.

    Understanding the overall market requires an appreciation of this distinction but also an understanding of all the other metrics listed above and what stories they tell.

    ---

    Notes: My thanks to Michael Dediu for input on this discussion.

  8. What did I get right (and wrong) about the fourth quarter?

    Research · 40 comments

    I've been publishing my estimates for Apple's business performance for a few quarters (see here, here and here). My estimates have been collected along with those of dozens of others by Philip Elmer-DeWitt at the Fortune Apple 2.0 blog.

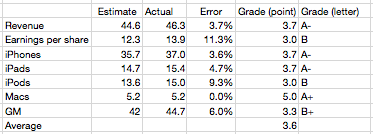
    I've also been scoring my performance and discussing the causes of errors. Here is the analysis for the fourth quarter 2011.

    My estimate for Mac growth was very precise. It was based on a 27% growth estimate. It turns out that growth was well within historic range and thus quite predictable.

    iPhone and iPad error was very modest at less than 5%. This led to a very low error on Revenues (as I also did not expect ASP to change).

    I was too pessimistic on the iPod, expecting 30% decline and 13.6 million units. In reality the business declined by only 21% and Apple still sold 15.3 million units at an average selling price of $164.

    Due to an underestimate on margins which are highly sensitive to iPhone margins my gross margin estimate was off by 6%. This led to a relatively poor EPS error of 11%.

    Nevertheless, the "grade point average" for the quarter was 3.6 which is nearly an A-. This is an improvement from the B- from the last quarter.

    Because the accuracy was good, there is little to be learned from the quarter. Perhaps the most important observation is that the iPhone recovered from two outlying quarters. The second quarter where it overshot expectations and the third quarter where it undershot. These were hard to predict because the product went through a delayed transition which whip-sawed both production and sell-in.

    What we saw in the fourth quarter is a  return to the predictable historic growth of nearly 100%.

    To give a perspective on the performance of other analysts, a motion chart showing their errors is here.

    See also the video PED published of the same data here. (This video was produced from the same motion chart shown above, selecting bars instead of bubble as the chart type).

    Notes:

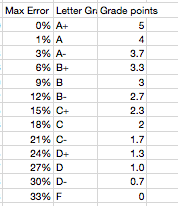
    1.  The scoring of the error is according to the following table:
    1. The results can be seen for all the other analysts as a table here (with data since mid 2008).
  9. Predictions for 2012

    Research · 54 comments

    I have none to offer.

    It may sound strange to hear me say that I don't make predictions even though I often talk about how things will change and even provide some forecasts. The difference is one of degrees. A prediction to me is a very specific, time-sensitive and materially valuable recommendation. An observation about the future is an imprecise, intuitive hunch based on pattern recognition. It's mushy. It's theoretical. It's the difference between saying a company is great and recommending to buy its stock with a price target in a time frame.

    But it gets even weirder.

    One of the recurring themes in Apple analysis has been that independent analysts, as a group, have been, on average, more accurate in quarterly forecasting than highly paid Wall Street Analysts. Many have asked why.  I believe that the answer is because independent analysts are theorists who make observations while professionals are data gatherers who make predictions.

    First, we should understand the reasons why each group does what it does.  Wall Street sell side analysts are rewarded for making Buy/Sell recommendations that cause clients to retain the services of the firm they work for. They are not paid to be accurate with specific forecasts in fundamentals. They are paid to predict how stocks move. The objective is not to be accurate in the quarterly but to support the "call" or prediction. The disconnect from accuracy comes in trying to sustain the call with a "conservative" forecast.

    For example,  an analyst with a "Buy" recommendation (and a prediction in the form of a price target) thinks Apple could ship 30 million iPhones this quarter and generate EPS of $10. But he also thinks the stock looks cheap even if they only ship 28 million iPhones and report EPS of $8.50. In this scenario he's incentivized to publish the lower (less accurate) number. That way he supports his prediction. By dampening expectations, the stock rises on the "surprise".

    Because an analyst sells predictions, he self-censors what he believes.

    Contrast that with the motivation of an independent analyst (aka blogger). His motivation is to (presumably) gain a reputation of accuracy and insight. He sells his reputation as a keen observer. Precise predictions or recommendations can turn out wrong quite often. Getting caught with these errors exposes the independent to instant negative feedback. The risk is far greater than the  opportunity.

    So here is the difference: Analysts have an incentive to put forth a version of the future that supports their call on the stock. Bloggers have an incentive to put forth the most accurate version of the future. By taking the prediction out of the picture, accuracy in describing the future improves.

    So I don't have any predictions or recommendations. I just hope to help you see patterns that lead you to making your own predictions.