Asymco

Asymmetric Intelligence

analyst

  1. Apple's commoditization discount

    Research · 81 comments

    When asked where Apple's growth will come from, most analysts or observers will cite new products. As long as there are new products, then there is growth. Conversely, if there are no new products, then there will be no growth. This is such a commonly held belief that it's axiomatic: Apple is being valued based on short-term foreseeable growth.

    To be more precise, analysts value the wave of growth of every new product and heavily discount the post-growth phase assuming commoditization. There is no value assigned to Apple for extending market reach to the mass market.

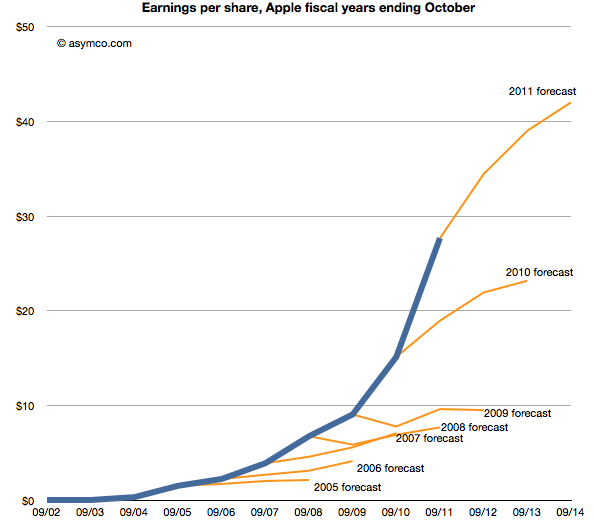
    Consider: Analysts currently forecast an operating income (or EBIT) of $43.3bn for 2012 and $49.7bn for 2013. That implies growth of 28% in 2012 and 15% in 2013. These growth rates are modest in light of Apple's recent historic growth and especially 84% in 2011 on EBIT level. Much of this growth has been due to iPhone which quickly captured 4% market share in four years. To suggest 15% growth in 2013 is to suggest that Apple will not increase its phone market share by an appreciable amount. The implicit assumption in that growth figure alone is that Apple will remain a niche player.

    Bear in mind that 15% growth is so low as to be half the the growth in the Mac business and below the likely growth in the overall phone market. Considering the risk premium on equities, this growth forecast assumes essentially a no growth scenario. But even with no growth, Apple's cash flows are huge and thus they should add up to some significant present value. Since we know the value as reflected in the current price, we can work backwards to determine the discount rate being applied to those future flows. In other words, we can calculate how risky Apple's existing product cash flows are seen to be.

    Based on  assumptions originating from analysts' consensus, we can construct a simple model that will approximate the discount the stock market puts on Apple's future cash flows. Let's have a look at an adjusted Gordon or dividend discount valuation model on EBIT basis:

    Shares are valued based on the projected future cash flows of a company. Discounting EBIT with Weighted Average Cost of Capital and subtracting growth will yield enterprise value (= market capitalization - cash).

    Applying analysts’ assumption of close to zero growth to Apple's post 2012 EBIT means EBIT stays constant for 2013 and beyond. Let’s solve for the implied capital costs. Right away we can eliminate growth (g) as it equals zero. EBIT reflects operating cash flow since in a zero growth scenario CapEx will equal deprecation and there are no changes in net working capital. As Apple has no debt but a cash surplus, WACC will be equal to cost of equity[1].

    Solving for capital cost (WACC) with available analysts' EBIT estimates reveals a discount rate of 15%.

    But let’s remember that analysts have consistently and by a large margin missed Apple's financial performance. So let’s dial in a more aggressive estimate of around $56bn of EBIT for the fiscal year 2012. The discount rate goes up to 19% and implies an EBIT multiple of 5.3x.

    In other words, Apple's cash flows for a zero growth scenario are being discounted at a rate of 15% to 19%. This places the company in an extremely risky category of investment. It is certainly not something that can be categorized as a value stock.

    The discussions on this blog regarding Apple’s valuation have been insightful, but only danced around the triangle of price, earnings and growth. When the growth forecasts are considered vis-a-vis current pricing, the assumptions built into 'consensus' forecasts for Apple are condemnations of the company.

    They present a view of a company that is extremely vulnerable and can neither preserve its current cash flows nor find new sources of growth. It is, quite plainly, a company doomed to commoditization.

    ---

    Notes:

    1. Or one can even assume that cash has a positive effect lowering costs of equity (less indirect bankruptcy costs).
  2. Interactive Apple Analyst Data

    Research · 31 comments

    As the quarter is now at an end, it's time to once again review the performance of Apple's most highly paid observers. The data set linked includes published quarterly forecasts starting quarter ending June 2008 to quarter ending September 2011. Thanks to Philip Elmer-Dewitt who collected and processed the data over several years.

    Apple Analyst Data | asymco. (Requires Flash)

    As with previous interactive data sets, this is based on Motion Charts "gadget" in Google Docs. Try selecting the Motion Charts tab at the bottom of the page and hit the play button.

    The way this is set up now is that the origin (0,0) represents actual performance (labeled as "Oppenheimer"). Every bubble is an analyst's performance measured as a distance from actual. The further the location of a bubble from origin, the worse the error. Placement above zero (or to the right) indicates over-estimation for Revenues (and EPS). Placement below zero (or to the left) indicates under-estimation. Color of bubble represents affiliation (professional or amateur). Size of bubble is iPhone unit error.

    You can change the axes, chart type (tabs in upper right), size, colors, and track individual analysts' performance (by checking a name checkbox). Or just download the data and analyze on your own by selecting from the Data tab.

  3. Who is being reasonable now?

    Research · 49 comments

    Last week Horace wrote about the apparent "reasonableness" of analyst Apple estimates. He explained how the consensus for Apple's growth was always deeply pessimistic because its performance could be argued to be anomalous. It was just too good to be true. We reproduce the chart here:

    The estimates look like characteristic "tell-tales" of a company running strong into the wind.

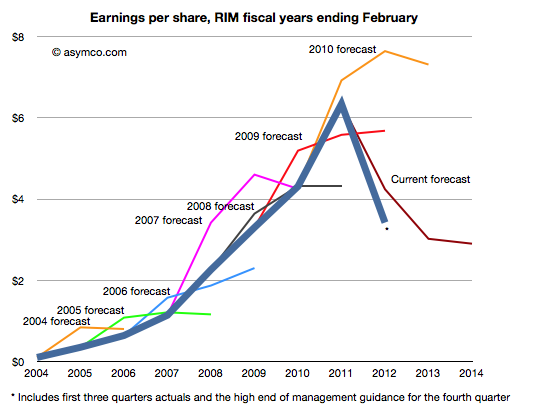
    This conservatism in the face of rapid growth sounds "reasonable" but is it always practiced? And what about the ability of this conservative strategy to predict dramatic changes in growth? To test, we started to look at the predictions for RIM. RIM has also enjoyed strong growth over a similar time frame as Apple. How did analysts predict its performance? The following chart was prepared using the same technique as the one for Apple[1].

    Surprisingly, the "tell-tales" look very different.[2] For every year we looked at the first year estimates were over-optimistic with a decline expected after one or two years. This pattern is remarkably consistent within the RIM data and remarkably inconsistent when compared to Apple.

    It's as if there was nothing in common with the methods used. This is perhaps appropriate, but the "quality" of predictions are not much better. With RIM they were too optimistic in the short term and too pessimistic in the medium term. With Apple they were far too pessimistic consistently.

    More worrisome, the 2010 forecast did not offer any hint of the dramatic decline which followed only a few months later. And after three quarters of really bad news, the consensus is still higher than what will likely happen (ensuring an uninterrupted string "misses").

    The study of these two companies' forecasts is a study in contrasts. We can say that the forecasting is disturbingly consistently inaccurate but we can also say that there seems to have been a bias of pessimism for Apple and optimism for RIM. We can only guess at the cause, but the consistency of bias points to something institutional.

    ---

    Notes:

    1. The three year forecast consensus (sourced from Bloomberg) was sampled one month following the end of each fiscal year. This should offer the analyst enough time digest the year passed and deeply contemplate the future.
    2. If we may stretch the analogy, these are indicative of an imminent stall.


  4. Hiding in plain sight

    Research · 67 comments

    Guessing the next Apple product has become the parlor game of choice for a whole generation of technology journalists and analysts. The premise of the game is that given a track record of breakthrough products, there is always another one just around the corner. Being the one to predict this next breakthrough product creates credibility and demonstrates the domain knowledge of the predictor. If the prediction fails to materialize there is consolation in dismissing the actual announced product as disappointing, unsophisticated or, worst of all, uninteresting.

    Most often, these guesses are as much a reflection of the analyst as they are an analysis of the company. Too many predictions are designed to impress or demonstrate the imagination or knowledge of the predictor. They typically anticipate a giant leap of functionality, power or market re-structuring. They envision revolution not evolution; a cutting of the Gordian knot not a polishing of ugly rocks.

    Yet nearly all of Apple's launches have been sustaining improvements in existing products, technologies or platforms. To name just a few:

    • The iPad is an evolution of the iPod touch
    • The iPod touch is an evolution of the iPhone
    • The iPhone uses OS X and Objective C from the Mac
    • OS X came from NeXT
    • The app store market model came out of the iTunes store
    • The iTunes store came from iTunes which came first to the Mac as a media sync tool for the iPod
    • etc.

    John Gruber explained the process last spring as it relates to many of Apple's launches. Although the iPhone did introduce a new user input method and experience that takes consumption in a new direction, its building blocks were there for all to see for many years. The iPhone is a natural evolution of the computer with a handy little "Phone" app.

    Likewise, the iPod came seemingly out of nowhere but by watching the original launch you see it as part of a "media hub" strategy that envisions the Mac as a personal server. The very products which ended up disrupting the Mac/PC began as extensions of their victims.

    You can trace the DNA of almost all of Apple's products to previous products. If Apple did not have these foundations, the slow-motion revolutions would not have happened. Rather than a deliberate big bang, Apple's disruptions are the result of a discovery process. A test, iterate and improve loop. This is why they seem obvious after the launch but also why they seem to be such an anti-climax.

    Therefore, the challenge of predicting Apple's next product should be tackled not only through an act of imagination but by carefully projecting the current products and understanding where they can evolve.

    So it is that I approach the question of Apple's TV disruption. My working assumption about the next Apple TV is that it already exists. It's none other than the existing Apple TV, improved.

    Here are the clues or hints I noted:

    • It uses iOS and the hardware from the devices that run it. It originally ran a PC architecture and shared a kernel with Macs.
    • It has been integrated with iTunes media stores (with the notable exception of the iTunes app store)
    • It has begun to introduce channels other than downloads (ESPN, Wall Street Journal) thus establishing its own distribution for traditional content
    • It is a global product, depending only on the Internet protocols and independent of the balkanized cable standards
    • Through AirPlay it is integrated with Macs and Apple devices.
    • Through display mirroring, iOS devices can use the TV as an external monitor and can even change their own behavior when doing so

    This last point is intriguing. I have not seen discussion of this feature, but if using an iPad 2 or iPhone 4S with iOS 5 and an Apple TV with the latest software updates it's possible to have an iOS device become a controller for TV-based game experiences. Developers are already using the API. When using a pinball game with screen mirroring, the device becomes a controller while the action takes place on the big screen. Switching display mirroring off bring the action and control back onto the small screen. There are still problems with lag and the processors are over-taxed on high frame rates, but the APIs are already there for developers. (I could also mention the potential of new a Bluetooth standard for better wireless response).

    What these signals point to is Apple defining the TV as an iOS portfolio product. This means integration with iTunes, including an app store. This, in turn, means unleashing developer/creative talent through new monetization opportunities. This means new user experiences in discovery. This means FaceTime-like communication through the TV. This means many other things but mostly it means that the TV will be a platform product.

    The only challenge is a (currently lacking) smooth interface. Perhaps that's where voice comes into the picture. But whether that is built-in at the next rev of the product or not is not the story. The story is going to be the sustaining improvement in the original Apple TV. A wonderfully asymmetric product begging to be ignored. A product that because of its apparent lack of success, effectively hides all its secrets in plain sight.

  5. Apple's Guidance Deficits

    Research · 94 comments

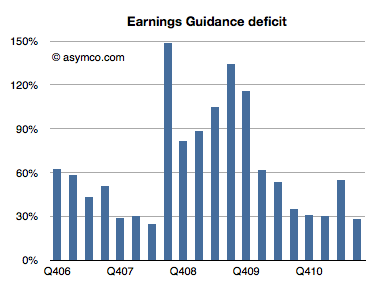
    Every quarter Apple's management issues a "guidance" or forecast of their own earnings in the following quarter. Over the years, this figure has been nearly useless because not only is it not accurate, the error itself has been wildly variable. I plotted what I call the Earnings Guidance Deficit for Apple based on the formula (Actual EPS diluted - Guidance)/Guidance.

    The higher the value in the bars above, the more the company underestimated (or under forecast) its performance. Note that during the recession the company routinely offered guidance at half the level they actually delivered. After the recession they returned to a more reasonable ~30% under-reporting.

    The problem with this analysis is that there is such a high volatility in this factor that we can't count on it to predict where earnings will fall. Even if we saw a range bounded at 30% to 60% the usefulness of this would be very low as that is far worse than the range that analysts can get through other means (Deagol's accounting of analyst error). The best thing we can say is that the range seems to be bounded by 30% and 150%.

    Rather than using this history for precision, perhaps it makes more sense to assume that the lower bound offers at least some limit to the possible value of next quarter's earnings. Maybe it can give us a "sanity check" for our own estimates.

    For the next quarter Apple guided $9.30 per share. If we assume a 27% "deficit" which is at the lower end of the range above then the earnings are likely to be about $11.8.

    That's equivalent to an 84% growth in earnings year/year. It would also imply $33 for the 2011 calendar year. At the current share price of $384 that implies a P/E of 11. That happens to also be the P/E for Apple at the trough of the recession in January 2009.

    In other words, if the stock price does not rise (or falls) from the current level by the time earnings are reported in late January, then the P/E for Apple may drop to less than 11 on growth of 83%. That's a sanity check all of its own.


  6. The other tablets

    Research · 89 comments

    Analysts have to count things in order to measure value. It sounds easy but it can be tricky. As I pointed out with PCs vs. iPads, if you count an iPad as a PC you can get into a lot of trouble with your clients. But if you don't you end up directing them away from confronting an existential threat. Only very rarely is a market report published in contradiction to widely held sustaining beliefs. More often than not analysts bow to the source of their paychecks and in so doing show their rear end to the truth.

    This comes up again now with respect to how to count tablets. Consider that there is little difference in architecture, software or design between an iPhone and an iPad. They run the same OS, use the same microprocessors and have similar communication methods, inputs and sensors. However they are considered completely different products and counted as part of separate markets. The only physical attribute that differs is the screen size. So we have to conclude that the size of the screen is a huge determinant factor in deciding whether a product is a tablet but not a smartphone (or music player).

    But what about tablets themselves? Their screen sizes vary widely. A 10" screen is certainly a tablet device, but a 4" screen certainly isn't. Where is the boundary exactly? It seems that a 7" device is still a tablet but a 5" may not be. The Dell Streak 5 device is presumably not a tablet. The arguments then descend into an arbitrary definition of tablet based on whether it fits in one hand or in a bag of a certain size.

    This begins to sound academic. Why should it matter what size is or isn't a valid tablet? Buyers are not in the market for screen sizes. They are in the market for products that can be hired to do jobs or address pain in their lives. So as far as consumers are concerned, these categories are meaningless. If you want to design something you'd better segment according to jobs to be done.

    However, buyers are not the target audience for the analyst. Nor are product designers (hopefully anyway.) Part of the reasoning of offering market research is that it presumably helps ecosystem participants (vendors, developers, retailers, etc.) decide where to invest their time and money. They are the target audience. They don't spend their lives reading tech blogs. For them it's important to understand "which way the wind is blowing" and that's where an analyst should be helpful with data.

    But then if we are to measure ecosystems, we have more difficulties.

    The iOS ecosystem is pretty well understood. Apple publishes the number of devices it sells and the number of apps on its store and downloads, etc. We can assume Microsoft will do the same with Windows 8 as they do already for Windows in general.

    For Android, it's a challenge. Google measures activations, but that may not cover the actual units sold. Google admits that it does not know how many Android devices are sold or even how many are for sale. It's in the nature of open source that it's not controlled and hence not measurable.

    But analysts still try. Consider the estimate that about 27% of all "tablets" shipped are Android. That's not something Google helped with. Google can report the number of activations of a certain version of the OS, but they themselves don't know what the device looks like or what size screen it has. A device vendor can put any version of Android on a device of any size. To find out how many tablets run Android, you need to try to estimate "bottom up" by adding the output from various vendors.

    However, it's clear that a large number of these devices are not exactly Android. Consider what  Kevin C. Tofel writes for GigaOm:

    I asked Strategy Analytics to clarify both of those points and received the following email response from Neil Mawston, the analyst who wrote the report: ”Yes, the press release refers to shipments, not sales. All sub-versions of Android are included. Yes, the B&N Nook Color tablet is included in the tablet figures.”

    So the B&N Nook is counted as an Android tablet and part of the 27% share of Android. But Google itself does not count the B&N Nook as an Android tablet. It's not something that can even use the Android brand. From Google's own documentation:

    We define an "Android compatible" device as one that can run any application written by third-party developers using the Android SDK and NDK. We use this as a filter to separate devices that can participate in the Android app ecosystem, and those that cannot. Devices that are properly compatible can seek approval to use the Android trademark. Devices that are not compatible are merely derived from the Android source code and may not use the Android trademark.

    In other words, compatibility is a prerequisite to participate in the Android apps ecosystem. Anyone is welcome to use the Android source code, but if the device isn't compatible, it's not considered part of the Android ecosystem.

    So to summarize, whereas the Nook is counted as an "Android tablet" it...

    • cannot be called an Android device without violating the trademark
    • may or may not compatible with Android Apps
    • does not include Google Services like Google Maps
    • cannot license the Android Market client software or brand
    • is not considered to be a part of the Android ecosystem by Google

    All this is also true for the Amazon Kindle Fire and whatever Baidu, Alibaba and other Google competitors will be selling. Furthermore, Google can define compatibility and therefore what "being Android" means arbitrarily and can change that definition at will. It can even withdraw compatibility on the basis of business priorities.

    It matters because these devices might end up very popular (see Amazon's reporting of Fire's pre-orders in its quarterly earnings call) and in aggregate could even be the majority of "Android tablets".

    The result is that most analysis of the Android ecosystem (and by comparison, all mobile ecosystems) depends on classifying as Android devices those that compete with Google, and indeed, with Android. For the purpose of assessing value, growth and opportunity for third parties such reports fall short.

    So what should be done?

    The solution is simple: Count as Android devices those that are allowed to be called Android as per Google's own definition. It makes clear that developers can reliably sell their software through the Android Market. It makes clear that those devices are designed to use Google services and it makes clear that those devices are not designed to compete with Google.

    Those devices which are using "derived" Android source code and are not compatible (as per Google's definition) and are not allowed to be called Android by their vendor should be called something else. Maybe "Android-like" or "Android derivative" or "Non-Google Android" or just "Other".

  7. More media tablet hype

    Research · 66 comments

    The iPad is still only slightly more than a year and a half old. Forecasting unit volumes has proven very difficult. But more than that it's proven very difficult to appreciate the impact on the market it's disrupting, PCs.

    For some people this is obvious, but what if you don't live and breathe disruptive theory? What if you don't watch every data source like a hawk for hints of change? What if you are not even a technologist. How would you form an opinion on the effect of the iPad on PCs?

    There are many industries and sectors about which I know nothing. If you asked me to analyze a market like industrial lubricants, I'd probably start by reading the consensus opinion put forward by the leading market analyst, an expert in that particular sector. That would form the baseline.

    In the PC sector, that opinion is formed by Gartner (and IDC and Forrester perhaps). Gartner will get a lot of citations and its stats and opinion forms the baseline view. It may not be right, but we can expect it to be the "consensus". This is because Gartner surveys a lot of data and interacts with a lot of insiders in the industry. They collect and weigh these inputs and put out what is likely to balance them all.

    If Gartner says that the iPad is a "media tablet" that is not a PC they may be wrong. But they are also repeating what the PC industry is saying. So I value Gartner as a reflection of the consensus. If there is a significant gap between Gartner and what I conclude to be reality then there is an interesting opportunity as well as evidence of incumbent ignorance.

    Let's then look back on how Gartner has been reporting the iPad's rise and the PC's decline.[1]

    Q2 2010

    "The consumer PC market registered double-digit shipment growth, but consumer mobile shipment growth slowed. This was due in part to slower growth of mini-notebooks," Ms. Kitagawa said. "Surging popularity of Apple's iPad temporarily cannibalized mini-notebooks, as well as consumer notebook sales to some degree. It is not certain at this stage if the cannibalization will continue with the current price point of media tablets."

    Q3 2010

    "Media tablet hype around devices such as the iPad has also affected consumer notebook growth by delaying some PC purchases, especially in the U.S. consumer market. Media tablets don't replace primary PCs, but they affect PC purchases in many ways," Ms. Kitagawa said. "At this stage, hype around media tablets has led consumers and the channels to take a 'wait and see' approach to buying a new device."

    Q4 2010

    “U.S. holiday sales were not fantastic for most PC vendors, but the professional market did show healthy growth during the quarter,” Ms. Kitagawa said. “Media tablets undoubtedly intensified the competition in the consumer market. These devices do not replace primary PCs, but they are viewed as good enough devices for these who want to have a second and third connected device for content consumption usage. Mini-notebook shipments were hit the most by the success of media tablets.”

    Q1 2011

    "Weak demand for consumer PCs was the biggest inhibitor of growth," said Mikako Kitagawa, principal analyst at Gartner. "Low prices for consumer PCs, which had long stimulated growth, no longer attracted buyers. Instead, consumers turned their attention to media tablets and other consumer electronics. With the launch of the iPad 2 in February, more consumers either switched to buying an alternative device, or simply held back from buying PCs. We're investigating whether this trend is likely to have a long-term effect on the PC market."

    Q2 2011

    Overall shipments of media tablets took place late this quarter and volumes remained low, minimizing any impact of the media tablets for PC substitutions in the second quarter of 2011

    Q3 2011

    "The main contributor to the weak consumer PC market in the U.S. was intensified competition for consumers' money," Kitagawa said "Media tablets and smartphones took center stage in the U.S. retail sector, and the expectation is for continuing demand for these devices throughout the holiday season."

    I've added emphasis for the key words describing the impact of the iPad (referred to as "media tablets").

    Note how the message changed over time. At first the effect was thought to be temporary (presumably due to "hype"). Three months later the "hype" was leading to "hesitation" in the channel. Three more months and there was "a hit" on Mini-notebooks but only for those needing a second or third device for "consumption". In the fourth report it seems that "consumers" (vs. business users) are really interested in this. The fifth report suggests that the effect is "minimal". The latest report suggests that this is a "localized effect".

    An external observer (or paying customer) reading this must conclude that five quarters in, these media tablets are having some effect but most probably a transient one. By keeping tablets separate from PC's Gartner is implicitly stating that the two products do not compete. If they have an effect it's on the discretionary spending by consumers. Similar to the effect game consoles or consumer electronics may be having on PCs.

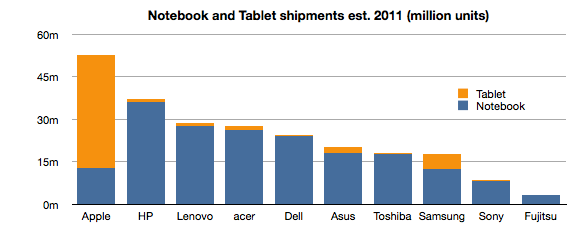
    However, if tablets were added to notebook totals the chart for 2011 would look like this:[2]


    Notes:

    1. The quotes are from periodic reports (every quarter) from the same analyst at the same firm using a consistent set of measurements about the market. In order to ensure the same context, I've selected the comments from press releases published using the same template.
    2. Source: Digitimes Research, compiled by Digitimes, October 2011
  8. RIM and the lamentation of the analyst

    Research · 83 comments

    RIM shipped 10.6 million Blackberries and 200,000 PlayBooks in the last quarter. Management noted that their sell-through was significantly higher for Blackberry (13.7 million) but seems to be very weak for PlayBook as the prior quarter saw 500k units shipped. Additional PlayBook units this quarter probably mostly went into new channels in Asia and there were no additional sales into North America or Europe.

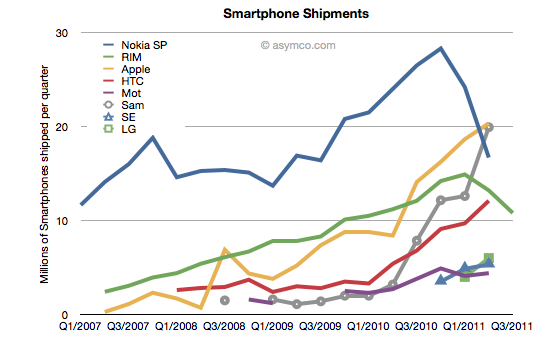
    The figures for units are very poor. How poor depends on the frame of reference. Consider the shipment chart below:

    In terms of the competition, 10.6 million units is less than half what Apple or Samsung sold in its prior quarter. It's also less than what HTC sold. RIM's volume rank will likely go to fifth place as a smartphone vendor.

    In terms of its performance relative to its own history, the Blackberry volume dropped by 11% year-on-year and 18% sequentially. This is the second quarter that shipments shrank.

    In terms of market share, we'll have to wait for the competitor data over the next six weeks but the market has been growing at an average of 77% for four quarters so any continuation of this trend would imply RIM's share dropping to single digits.

    Finally, the biggest shock has been the decline in profitability. It seems that operating margin dropped from 21% to 13%. The company did incur some one-time charges for recent layoffs, but even without that charge, the margins would be around 16%. This is most alarming. The reason for such drops is that as volumes decrease fixed costs don't decrease as rapidly or at all. The company still needs to keep sales, administration and engineering staff around and they become a larger part of the operating expenses (vs. the component costs which vary with volume of goods sold).

    This effect is well understood by financial analysts and the stock price shows it with a huge drop.

    But stepping back to look at the picture above, there is a clear turning point in the company. You can see the elbow in the curve for volumes whose effect is felt so deeply. What's curious is why the pivot occurred when it did. We can point the finger to competition as the cause. But why was there no effect in the company's fortunes when the competition actually emerged. It's been years since the iPhone and even Android entered the market. Yet we see an impact on Nokia and RIM individually at apparently arbitrary points of time.

    This is the lament of the analyst: you can clearly and accurately state what will happen but when remains a mystery. It's the elasticity between obvious causes and their effects that makes this an inexact science or not a science at all. In retrospect, you can say that Nokia's pivot was triggered by its public execution of Symbian, but that assumes that it was preventable--which we know is not the case. But what caused RIM's change of growth, exactly? Why did it happen this past spring? Why didn't the company volumes begin to decline as iPhone and Android boomed in 2009 or 2010? For quite some time RIM seemed immune to competitive pressure. We all were made fools as we called its imminent demise. Then, as Steve Jobs would say, boom!

    ---

    Footnote:

    Piecing together RIM's performance is becoming more difficult each quarter. The data being presented is increasingly obfuscated by irrelevant detail while major information is omitted. This last management presentation was full of holes, namely:

    • We have no idea of device pricing. Valiant efforts have to be made to piece together that aspect of the business. Matt Richman does a good job but it still requires some guesswork regarding PlayBook pricing to back out Blackberry pricing.
    • Management detailed where Blackberries were selling-out but only detailed sell-in for the PlayBook. Obvious spin.
    • They are cherry picking the data they present and each quarter it's a different story making pattern recognition impossible.

    This leads to an erosion of trust. Observers are faced with the problem of increasingly guessing what is happening each quarter. For instance, regarding pricing I prefer to include service revenues in the analysis of device sales because device+service is what is being bought by the user and vendors which can offer services as part of the device get a justifiably higher value for the product--value that I think needs to be considered as advantageous. Nokia and Apple also account for services (though not apps) as part of device sales and it makes it more convenient to compare these businesses.

    Given RIM's smokescreen, this quarter I decided to stop trying to guess Blackberry pricing and used Operating Income/Units sold as the average selling price.


  9. Is LG about to exit the phone market?

    Research · 74 comments

    LG's market position seems precarious. I first noted LG's predicament about a year ago: LG dreams of smartphones [Updated] | asymco

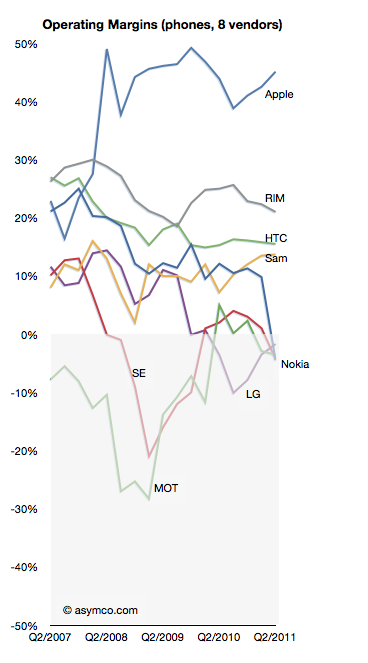
    LG lost profitability in Q3 2009 and has not recovered it yet nor can it say when it might.

    In a recent article on analyst reactions the prospect of LG's exit from handset sales is raised:

    LG's handset division is the company's biggest capital sinkhole and the shares have more than halved this year, making it the worst performer even when compared to HTC and Nokia.

    "Selling the loss-making business is probably what investors want," said Harrison Cho, an analyst at KB Investment & Securities. "But even with that option, LG wouldn't get much from the sale. They should have sold it long ago before the overall landscape got tougher."

    "They simply missed the boat," said Cho.

    The dire business outlook had already pushed LG shares below their book value to a record-low multiple of 0.9 times its book value, much cheaper than Research In Motion's 1.6 times, Nokia's 1.1 and HTC's 8.2.

    That's a huge discount for a company that is also a global brand in television and home appliances.

    Analysis: LG faces tough choices for mobile phone division - Yahoo! Finance

    As I like to point out it's unlikely that management failure is the sole cause for this problem LG finds itself in. If it were, then why did Nokia, Sony Ericsson and Motorola find themselves in trouble at the same time?

    But putting aside the causes, the prospect of another tier one vendor becoming a victim in a booming market speaks volumes. Only Samsung remains largely unscathed, though I believe they are not immune. The shift in profit capture that I have been documenting is plain proof that the industry is undergoing permanent structural changes.

    As the chart to the left illustrates, the plunge into negative margins is difficult to reverse. The only advice for LG today (besides breaking itself up) is:

    "What LG can do at this point is keep doing what it can do best; keep upgrading its hardware offering, differentiate them and then diversify away from Android to Microsoft's Windows phones," said Jung Kyun-sik, a fund manager at Eugene Asset Management in Seoul.

    I suspect however that diversifying into multiple platforms will not be particularly differentiating as every other vendor will do the same.

  10. If Cash is King, Apple's is an Emperor [Updated]

    Research · 84 comments

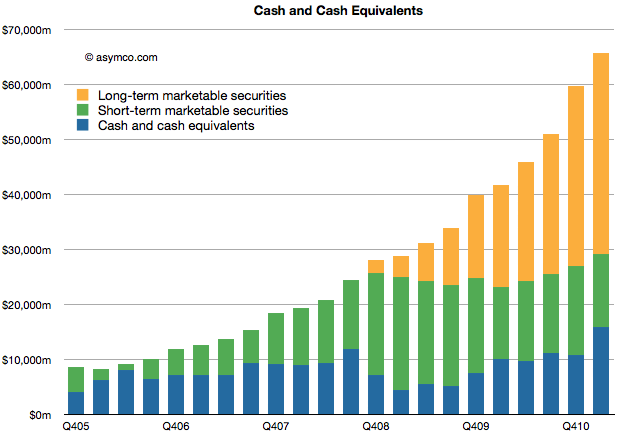
    Apple's cash for short-term and long-term marketable securities totaled $65.8 billion at the end of the March quarter. Cash increased by $6.1 billion.

    The increase in cash is net of approximately $900 million for prepayments and capital expenditures related to the strategic supply agreements that Apple announced last quarter.

    The following chart shows the historic cash, short-term and long-term liquid assets Apple holds.

    As in previous quarters, the securities Apple holds are:

    • Cash
    • Money market funds
    • U.S. Treasury securities
    • U.S. agency securities
    • Non-U.S. government securities
    • Certificates of deposit and time deposits
    • Commercial paper
    • Corporate securitiesMunicipal securities

    Although the asset classes are all liquid, those with longer maturity dates are classified as "long-term" securities (orange area in chart above) and are often not counted as "cash" in many financial databases.

    The enormity of the overall size of this cash can be put into several perspectives:

    • The funds are big enough to place Apple's CFO office in the top 100 largest fund managers in the world and larger than any hedge fund manager.
    • Cash growth in one quarter was higher than the market cap of many companies. For example, if pre-payments were added back, the cash increased by about the market cap of Motorola Mobility.
    • Current cash is worth more than Nokia, RIM and Motorola Mobility's market caps, put together.
    • Apple's cash is worth half of Google's enterprise value.
    • About two years ago, in January 2009 the stock traded at a price of $78 with at least one analyst placing a target of $70 on the stock. Today Apple's cash is worth $67 70/share.
    • If you owned $100,000 of Apple stock, $19,000 of that would be cash and only about $80,000 would be "at risk" capital.
    • If Apple had no revenues, the current cash would sustain operations (SG&A and R&D) for over 7 years or until the middle of 2018.

    When analysts cite limits to the rate of Apple's growth on the basis of the "law of large numbers" I wonder if there is an implied limit to how big this cash pile can grow. By looking at the chart its size seems to be growing faster all the time.


    [Updated] The cash per share figure was wrong. It is $70/share.

  11. First quarter PC forecast: Windows down 2%, Mac+iPad up 250%

    Research · 100 comments

    Charles Arthur of The Guardian writes that PC sales "may have passed their peak".  That's a powerful, concise statement. It's backed up by a quote from Gartner's Mikako Kitagawa:

    "This was the third consecutive quarter of mobile PC shipment declines in the US"

    IDC even lays part of the blame to something called "media tablets"[1]:

    "While it's tempting to blame [PC] decline completely on the growth of media tablets we believe other factors [...] played equally significant roles."

    But there are several problems with both IDC and Gartner's analysis of the market. It's hard to make out causality from their data. There is separation by vendor but not by operating system and there is exclusion of devices hired to do the same jobs as PCs.

    For this reason, I need to do my own analysis. I retrieved Gartner's public statements on the overall market and layered actual Mac and iPad units sold. I also added my estimates for the Q1 2011 quarter just ended to complete the picture.

    We can now get an understanding of how the industry behaves with and without various platforms. The chart at the left gives the various growth rates of the market with platforms isolated from each other. I apologize for the shape of the chart but the scale does not permit a concise visual.

    Including the iPad, the total PC growth is shown by the blue line. It shows that the market peaked during the recovery but is now slowing considerably.

    The green line shows the PC industry excluding both the Mac and the iPad. Although it might include Linux or computers sold without an OS, the label "Windows PC" is a fairly close approximation. It shows that the market excluding Apple entered contraction this quarter and is out of sync with overall economic recovery and growth.

    The red line shows the behavior of the Mac franchise. It's well ahead of the overall market with 2x to 3x the growth. This has been a pattern for over 18 quarters.  I had some thoughts on this in a November 2010 hypothesis.

    But the most telling line is the orange line which includes both the Mac and the iPad. In an industry where growth is usually measured in single digits, the iPad business brings growth in three digits.

    This near tripling of unit sales is symptomatic of fundamental change that cannot be ignored. Although some analysts contend that the iPad is not causal to the decline in other PC sales, teasing out platforms data seems to show a divergent view.

    The bottom line is that Windows-only computer units are down 2.0% while OSX-based computer units are up 272% (this excludes both the iPhone and iPod touch).

    Correlation is not causation but tests or surveys where substitution can be proven do exist. For example, a recent survey shows that 77% of users reported that their PC usage decreased after getting a tablet. It also showed that 28% considered their iPad as their primary computer.

    So coupling the sales data with the usage data does point an accusatory finger for the decline on the iPad.

    In addition, some vendors are being hit harder than others which also hints at where substitution is happening. For example, IDC reports that Acer US unit shipments fell 42% in the first quarter and 16% globally (Gartner's numbers are less dramatic but in the same direction). Since Acer is known for its netbook computers it's another telling sign of possible substitution (Acer's own management has indicated as much.)

    So the weight of evidence is beginning to be conclusive: the iPad is the new PC. It should be clear by now that the iPad moves computing into new contexts so it does not yet substitute the PC market but extends it and increases consumption. Substitution is happening in low-end grazing type of usage, a place where the PC was ill-fitting anyway. Incumbent vendors might actually be relieved that the lower margin netbook is finally being supplanted and they can concentrate on the higher end.

    --

    Notes:

    1. Analysts like to call the iPad a "media tablet" but the same AdMob survey shows media consumption to be one of its least popular uses.