ABI Research estimates that AOSP (or forked Android) is the fastest growing mobile operating system with a total share of units shipped of about 20%. This is not surprising considering that most Chinese vendors don't include standard Android into their products. Indeed the current leader in China, Xiaomi has its own take on Android and includes a unique UI and set of services. This is also not a new pattern, Amazon's fork of Android has been in development for many years and powers the second most used tablet in the US.
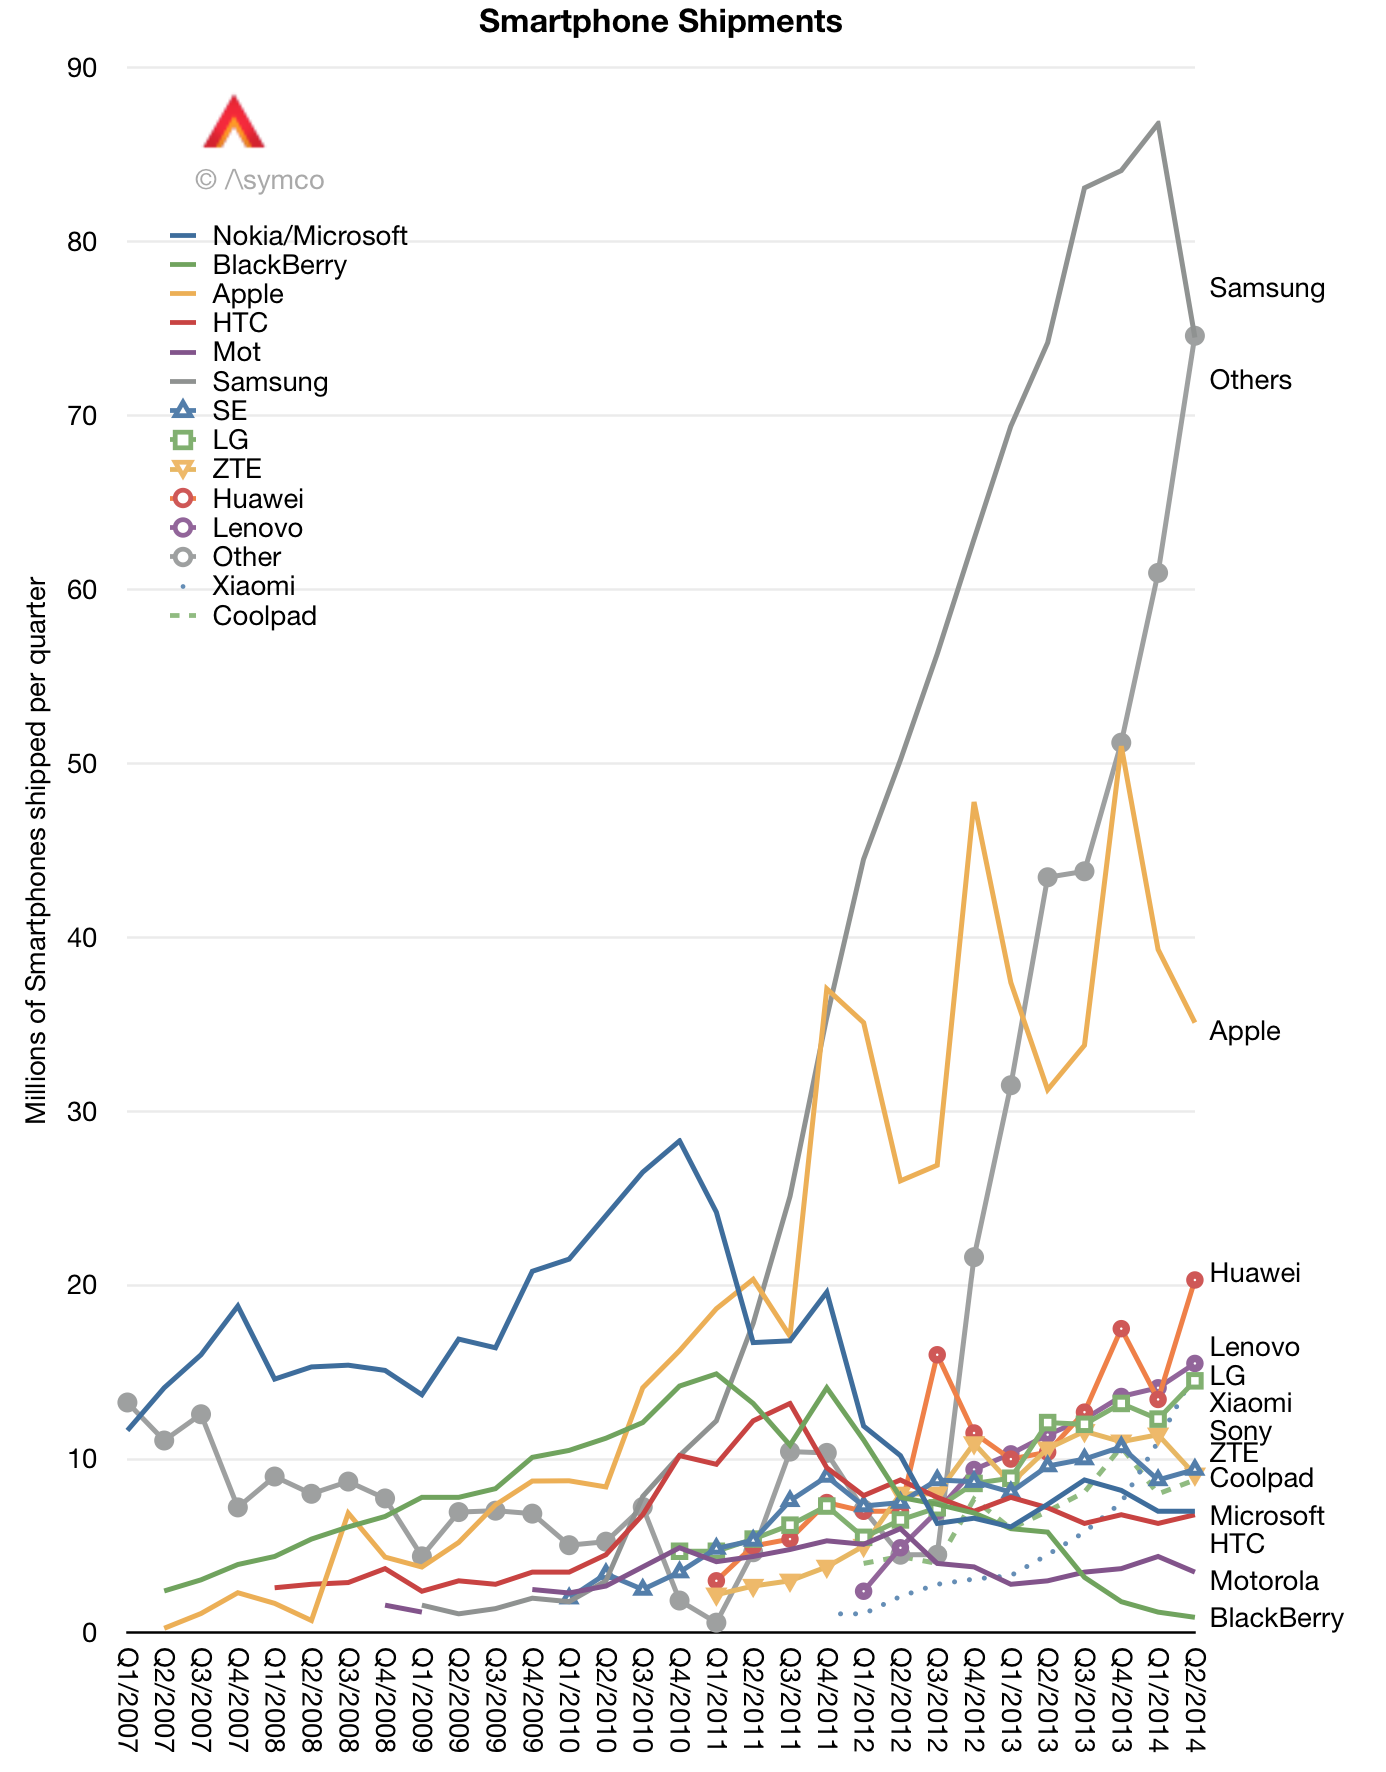
If one looks at the volumes of smartphones shipped by vendor, the most rapidly growing (Huawei, Lenovo, Xiaomi, ZTE, Coolpad and "others") are likely to be using forked versions of Android.
The reasons for this are many: a reluctance to deal with Google's obligations, Microsoft's IP licensing costs ((which even Samsung seems to be eschewing)) , potential litigation, politics (including bans on Google services in certain markets), etc. But the most likely reason is flexibility. Vendors competing on price and localization are looking to move quickly against each other and can't wait for blessings from above. Belonging to some "Alliance" and all that it entails is just too much to ask for companies that are, so to say, delicate.
The result is that the "more open" version of Android is beginning to threaten the "less open" version of Android. China is already lost to OHA but India where penetration is still very low is up for grabs. Into this fray Google launched "One" a more low-end friendly version of sanctioned Android, hoping to retain opportunity.
The value of a singular Android version is not just being Google-friendly but also being better managed and more BOM-friendly. Google is trying to solve the control issue with ease of use, but still retaining control There will be alternatives however which are both easy and "open" ((or Free as in speech)). It seems that there is an opportunity for a hardware-independent vendor to take AOSP and provide a complete solution to local phone brands so they don't need to expend efforts on integration. A non-Google One, so to speak.
Why it's likely is that openness in software makes sense when parts of the stack become commoditized. Google took advantage of the commoditization of operating systems (i.e. Linux) to deliver non-open services on top. However, it's inevitable that some of those very services will also be commoditized and therefore that the portions of the stack which sustain Google will be forked as well.
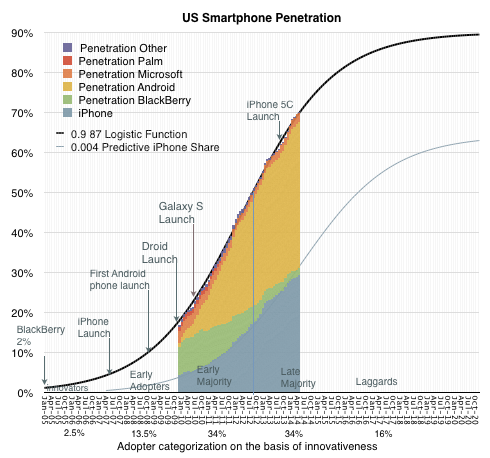
Seven years after the iPhone was launched, 70% of the US population is using smartphones. Smartphones existed before the iPhone so the category is older than seven years but as far as adoption goes this is nearly the fastest ever.
The CD Player reached 55% in seven years and the Boom Box about 62%. If measuring the period between 9% penetration and 90% ((which I consider the "economically attractive" period of growth)) the smartphone in the US will have a lifespan of about 9 years starting in 2008. Before this period, the product was largely experimental and participating vendors ((Palm, BlackBerry, Nokia)) mostly failed. After this period most products will be "commoditized" with decreasing margins and increasing consolidation.
The rapidity of growth is all the more remarkable given the penetration is at the individual, not household level. The total user base is therefore over 270 million rather than the 115 million usually targeted by consumer technology, nearly 60% more purchases. This is also remarkable because the product has a shorter lifespan of use (two years) than is typical for other consumer technology products ((e.g. TVs, Refrigerators, Radios, etc.))
We are therefore now in the "Late Majority" phase of the US market. This is not a surprise. The inflection point in the market occurred in mid 2012 so we've been in this phase for two years already. It's not therefore controversial to predict two years of continuing though decelerating growth.
As Geoffrey Moore explained, the marketing of technology products needs to be varied as we get into different phases of the market. Innovators (first 2.5%) need to be sold on the premise of novelty itself. Early adopters (next 13.5%) seek status and exclusivity. Early majority (34%) seek acceptance and Late Majority (34%) seek pragmatic productivity. Laggards (last 16%) seek safety.
One aspect of this adoption cycle that is misunderstood is the role of pricing. The assumption is that pricing matters more as adoption increases. This is misunderstood because pricing always matters and therefore it never matters. Pricing is one of many elements of marketing mix and at any time there are product choices across a wide spectrum of pricing. Pricing is also a signal which can be elaborately obfuscated through bundling and unbundling.
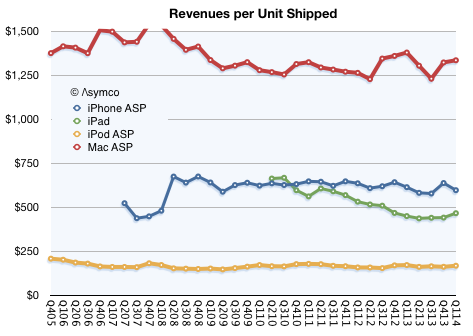
One way to illustrate this is to consider how Apple products behave in the late phases of markets. Apple products have notoriously firm pricing.
The revenue per unit of Macs, iPods, iPhones and iPads remains stubbornly consistent. This is not to say that each unit sold is the same price. The company tweaks "the mix" of mid, low and high products to keep the average selling price constant. But fundamentally the average remains constant which means that regardless of market phase, Apple retains its margins.
So as we look forward to the last two years of growth for smartphones, how will Apple fare?
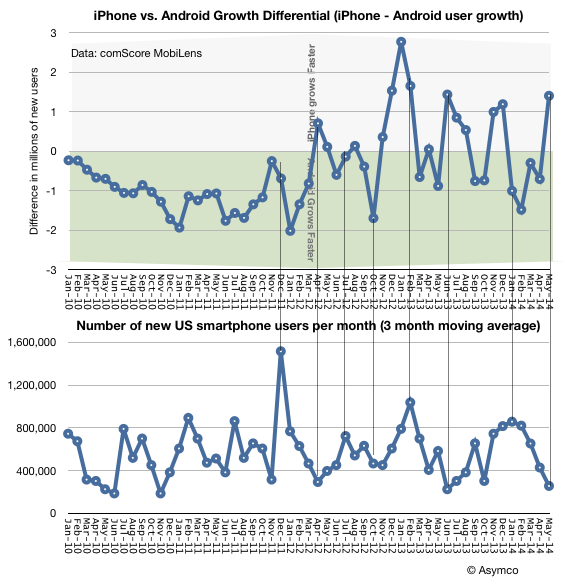
There are weak signals that it will do rather well. I looked at two sets of data for clues: the number of new-to-smartphone users being added each month relative to the increase of usage of either iPhone or Android.
[Edit: The title of the second graph above should be "Number of new US smartphone users per week (3 month moving average)"]
What I'm looking for is a relationship between the rate of adoption of the overall product and the rate of adoption of iPhones. I measured the new-to-smartphone users as the change in user population (per week) and the preference for iPhone as a growth differential. ((iPhone growth in millions of users minus Android growth in millions of users. Positive data points suggest iPhone grew faster in a period and negative points suggest Android grew faster.)) The data shows no perceptible correlation between adoption rate and preference for either platform, however when looking closer there is a periodicity to the addition of users, especially starting in 2012.
The range is not insignificant, ranging from ~300k users/week to well over 1 million. The periods of growth of users could be due to new product launches or incentives and promotions done by the mobile operators. Whatever the reason, there is some flux.
If we look at the corresponding adoption differential in platforms the relationship seems to be that peaks in adoption are matched to Android preference and troughs to iPhone preference. This might seem logical: after the 50% saturation point, when promotions are run by operators, non-consumers are drawn in and they tend to adopt the "low-cost" product.
However, this is also paradoxical. Why, when we are in a late stage of the market, does the iPhone do well when users are not incentivized to adopt? The graph above shows that as we crossed 70% adoption, 1.4 million more users adopted the iPhone than Android.
Even if we look out to the last six months, iPhone added 15.5 million late majority users while Android added 14.2 million. If promotions decrease for the "late late majority" and laggards then would the iPhone do even better relative to Android?
The only answer seems to be that "low cost" is not what's driving this market. But then again, it never did. Towards the end of the "pre-smartphone" market the most wildly popular voice phone in the US was the RAZR. And it was a premium product.
iPad sales were unexpectedly slow in Q1. Tim Cook explained it as follows:
iPad sales came in at the high end of our expectations, but we realized they were below analysts' estimates and I would like to proactively address why we think there was a difference. We believe almost all of the difference can be explained by two factors.
First, in the March quarter last year we significantly increased iPad channel inventory, while this year we significantly reduced it.
Second, we ended the December quarter last year with a substantial backlog of iPad mini that was subsequently shipped in the March quarter whereas we ended the December quarter this year near supply demand balance.
We continue to believe that the tablet market will surpass the PC market in size within the next few years, and we believe that Apple will be a major beneficiary of this trend.
Tim Cook went on to say "over two-thirds of people registering an iPad in the last six months were new to iPad"
In a later discussion, Luca Maestri said:
As Tim explained earlier, our iPad results and the comparison to the March quarter last year were heavily influenced by channel inventory changes. Specifically, this year we sold 16.4 million iPad into our channel and sold through almost 17.5 million, reducing our channel inventory by 1.1 million units.
Last year, we sold over 19.4 million iPads into our channels and sold through 18 million, and therefore increased channel inventory by 1.4 million units. As a result, the year-over-year sell through decline was only 3% compared to the sell-in decline of 16%.
We exit the March quarter with 5.1 million of iPad channel inventory which left us within our target range of four to six weeks. iPad continues to lead all other tablet by far in terms of user engagement, size of ecosystem, customer satisfaction and e-commerce.
In a later Q&A:
Steven Milunovich - UBS Securities: Tim, I understand that the iPad is not as weak as it appears on a sell-through basis, but still it's relatively flat over the last year in terms of sell-through. What are your thoughts in terms of why that is and can that accelerate with Office on the iPad going forward?
Tim Cook - CEO: It's a good question. Let's talk about iPad a little more than we did in the comments.
When I backup from iPad, here is what I see. It absolutely has been the fastest growing product in Apple's history, and it's been the only product that we've ever made that was instantly a hit in three of our key markets, from consumer to business including the enterprise and education.
And so, if you really look at it in just four years after we launched the very first iPad, we've sold over 210 million, which is more than we or I think anyone thought was possible at that period of time. It's interesting to note that that's almost twice as many iPhones that we'd sold in a comparable period of time, and over seven times as many iPods as we'd sold in the period of time.
So, I think it's important to kind of to put that in perspective. We've come a long way very, very quickly. Looking at it by market a bit, which I think is important. I think Luca mentioned a little bit of this in his comments. In the education market in the U.S., we have a 95% share. So the focus in education is on penetration, is on getting more schools to buy and my belief is the match has been lit, and it's very clear to the educators that have studied it is that student achievement is higher with iPad in the classroom than without it. So I'm confident we've got a really great start in education far beyond the U.S. now. This is happening in many, many parts of the world.
In the enterprise market, we're seeing virtually all, 98% of the Fortune 500, they're using iPad. We're seeing – according to Good Technology who looks at activations of tablets – the latest data we have from them is that 91% of the activations of tablets in enterprise were iPads. So this is also an astonishing number and many of those enterprises are writing apps that are key proprietary apps for running that business, and this is great for that company because they're more productive as a result of that. So once again, just like in education in a way, what we have to do in enterprise is focus on penetration, it has to be deeper and broader.
But in terms of having people begin the process, beginning writing apps, we're doing a pretty good job of that. In the retail market, if you look at the U.S. as a proxy, the NPD numbers for March just came out a few days ago and we had 46% share and embedded in that 46%, there's a lot of things in there that I personally wouldn't put in the same category as iPad, and that are weighing the share down. It's certainly a market we wouldn't play in and in a type of product you would never see an Apple brand on. So, we feel like we're doing well there.
Office; I believe does help. It's very unclear to say how much. I believe if it would have been done earlier, it would have been even better for Microsoft frankly, there is a lots of alternatives out there from a productivity point of view, some of which we brought to the market, some of which many, many innovative companies have brought. But I do see that Office is still a very key franchise in the enterprise, in particular. I think having it on iPad is good, and I wholeheartedly welcome Microsoft to the App Store to sell Office. Our customers are clearly responding in a good way that it's available. So, I do think it helps us particularly in the enterprise area.
The other things you look at on iPad that are just blow away its customer [satisfaction], is 98 [percent]. There is almost nothing in the world with a 98% customer sat and the intention-to-buy numbers look good with two-thirds of the people planning to buy a tablet or planning to buy an iPad. The usage numbers are off the chart, far and exceeding Android tablets, four times the web traffic of all Android tablets combined.
So, when I backup from all of these, I feel great. That doesn't mean that every quarter, every 90 days is going to be a number that everybody is thrilled with. But what it means to me is that the trend over time – over the arc of time, that things look very, very good, that iPad has a great future. And of course the thing that drives us more than any of this are the next iPads if you will, the things that are in the pipeline, the things that we can do to make the product even better, and there is no shortage of work going in on that nor any shortage of ideas.
So when I backup from all of this, I can't help but still be extremely excited about where we are. I think we did a reasonable job of explaining what we think the disconnect was between what we had expected, which we hit it at the high end of our expectation and the street's view of this one. I believe the vast majority of it is that first thing was just channel inventory that maybe we should have been even clearer on last quarter to take into account. But I'm very bullish on iPad.
That's quite a long set of explanations for was essentially was a flat quarter for the iPad. I can't add more to this, but I do want to focus on the bold part of the quote above. "But what it means to me is the trend over time – over the arc of time, that things look very, very good".
How can we see the long arc of time?
The tool I've used for this is the measure of penetration. Historically products which become "mainstream" or widely adopted follow an S-curve during that adoption. The curve is remarkably predictable given a limited set of points. I've discussed how the adoption of smartphones is predictable in the US, EU5 (( And UK specifically and several broader global regions)) and how even particular platforms might be predictable in the context of rates of adoption.
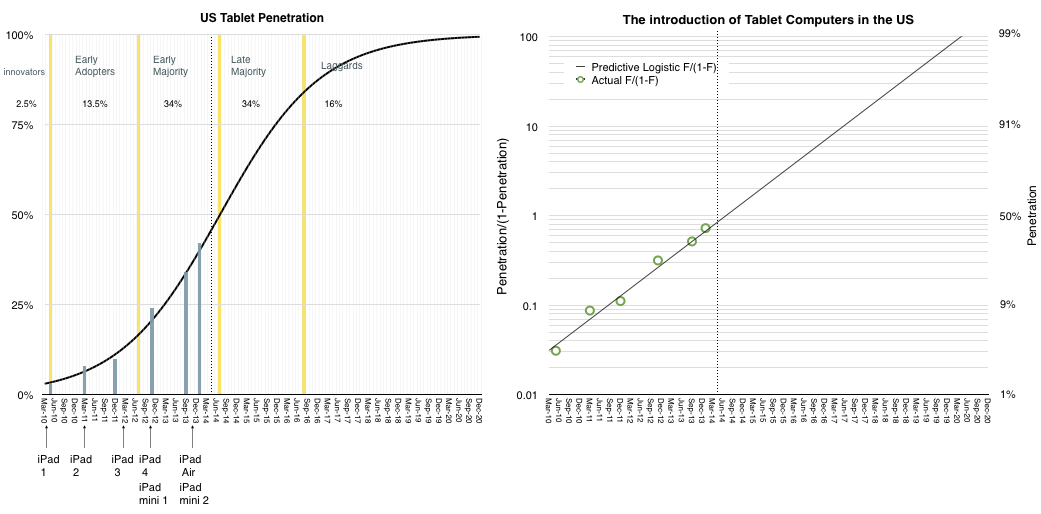
We are fortunate that data also exists for tablets. The Pew Research Center's Internet & American Life Project has published a short history of tablet adoption in the US. I've plotted this data and imposed an S-curve on the data which fits it rather closely.
The results are shown below:
In the graph on the left, the blue bars represent actual measurements of penetration (18+) while the black curve represents a best fit for the adoption rate.
Note that I've added the launch dates of all the iPad models and sectioned the curve into adopter categorization on the basis of their willingness to adopt.
I've also drawn a dotted line on the point where we are in the present.
In the graph on the right I've also duplicated the data using the transform of penetration to log scale penetration/(1-penetration). This shows the relative fit of the data in a more visually comfortable way.
The usual caveats apply:
This is US only
These are adults only
The iPad is not the only competing product
Nevertheless, this is a fairly strong proxy for the market. First, because the US has been leading adoption of almost all consumer product categories in history. Second because adults are a representative sample of users and third because iPad is market share leader.
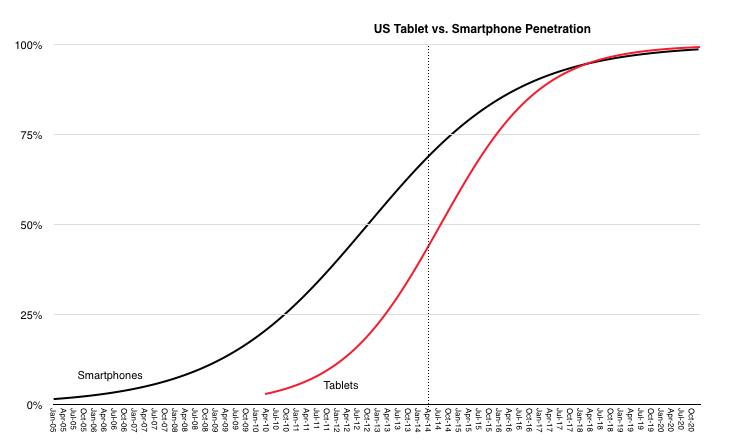
What the penetration data shows is an extremely rapid rate of penetration. In comparison with the smartphone, the tablet is rising much faster. This is shown below:
They are likely to saturate at around the same time but the tablet started much later.
So how does this explain the slowing iPad sales?
It's possible that saturation for tablets could come well below 100% and that we are on a different curve than the model above. However, the ubiquity of the product and broadness of appeal, even within non-consumer (i.e. education and enterprise) makes it difficult to reconcile. In addition, the penetration data is self-evident. It's improbable that penetration goes to 42% as it just did, and then stops suddenly. These decelerations of adoption have been observed historically but they are usually explained by cataclysms such as wars and economic contractions, neither of which are affecting the US right now. If a product solves an important "job to be done" then it gets adopted in a predictable way by a given population.
The anecdotal evidence provided by the company and others coupled with the survey data collected for the population of US users implies that the iPad is solving numerous important jobs and is therefore continuing on a predictable trajectory and that a discontinuity has not occurred.
Management started by saying the iPad sales volume was not surprising to them and that they have not changed their long-term expectations. The penetration data seems to support their confidence.
Barcelona, Spain - Today at Mobile World Congress, Nokia unveiled five new affordable handsets including a new family of smartphones debuting on the Nokia X software platform. Based on the Android Open Source Project AOSP, and backed by Nokias deep ties with operators, the Nokia X platform gives AndroidTM developers the chance to tap into, and profit from, a rapidly expanding part of the market.
Today's announcement is consistent with the declaration of Nokia is engaged in a "war of ecosystems." Note that this is in contrast to "a war of platforms" or a "battle of operating systems" or a "competition of devices."
Devices are commoditizing, operating systems are commodities and the Android platform is a commodity. Value will not be captured in any of these technology modules. Ecosystems are another matter. It's where Facebook (and its acquisitions) reside. It's where Google lives and it's where iTunes has been for a decade.
Nokia's adoption of AOSP as an operating system is consistent with the ecosystem strategy set forth three years ago, and is also consistent with Microsoft's competitive strategy.
Which is why I believe Microsoft is not only comfortable with this development but had agreed to it over a year ago when work on this initiative was already well under way.
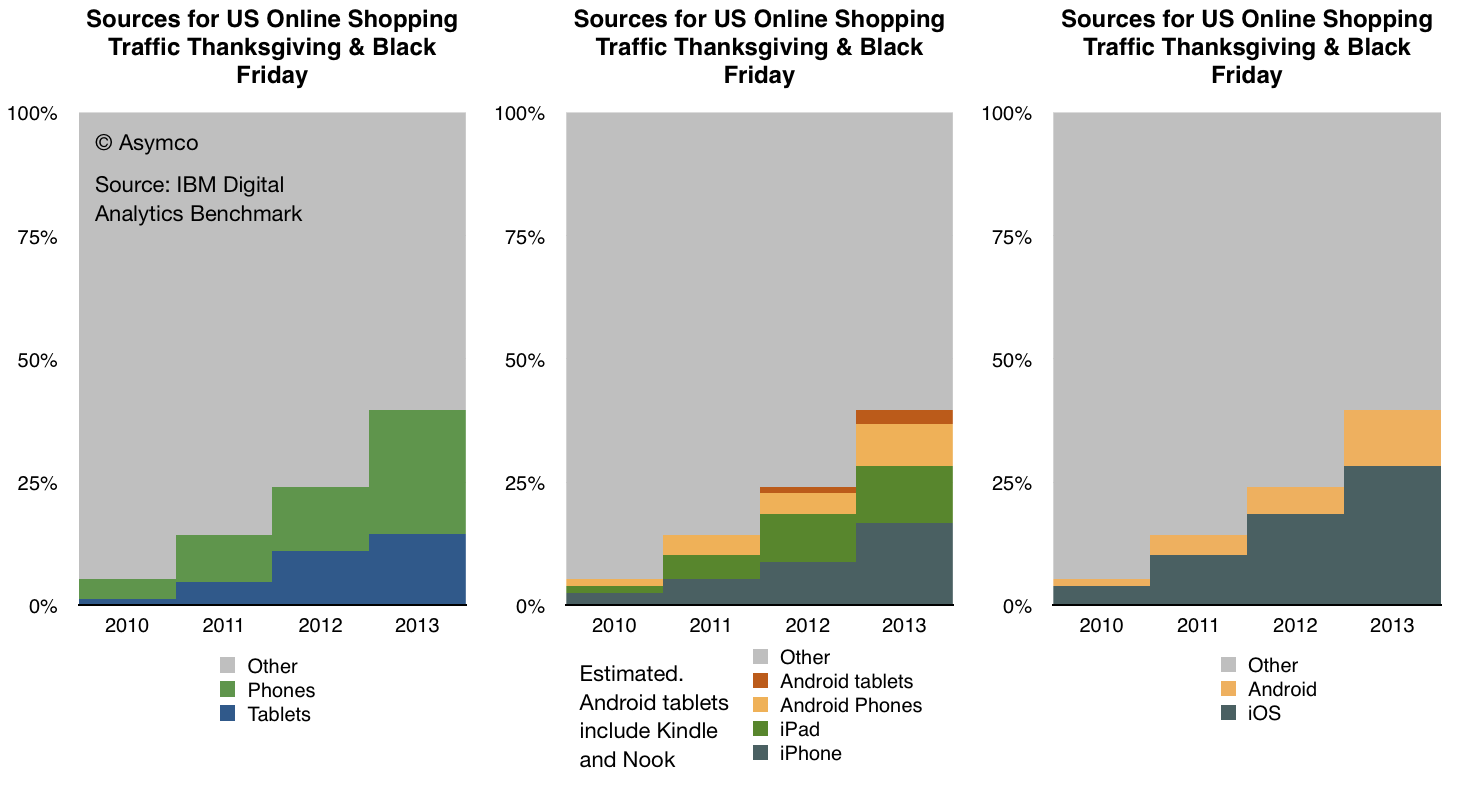
IBM Digital Analytics Benchmark (report is here) has published, for the fourth year in a row, US online shopping traffic data with a split between mobile and fixed online traffic. It reveals a pattern of consumer behavior which is quite startling: people seem to prefer to shop using mobile devices.
The data is shown below:
In terms of sources of traffic, mobile devices (including tablets) have increased from about 5% of all online traffic to 40% in four years. Last year the volume was 24% implying that 16 points of share were gained in one year. If that is extrapolated to next year then more than half of holiday shopping traffic in 2014 will be on mobile devices.
Put another way, next year less than half of users will hire a PC for the job of online shopping.
If this conversion from PC-based shopping to device-based shopping follows a logistic substitution curve then the conversion to devices will probably be 90% complete in another 5 years or by 2018 or 2019. I see no reason why this particular job to be done (shopping) should not be considered a proxy for other jobs as well. Therefore it's not a stretch to imagine that the transition to post-PC consumption will also be practically completed by 2020.
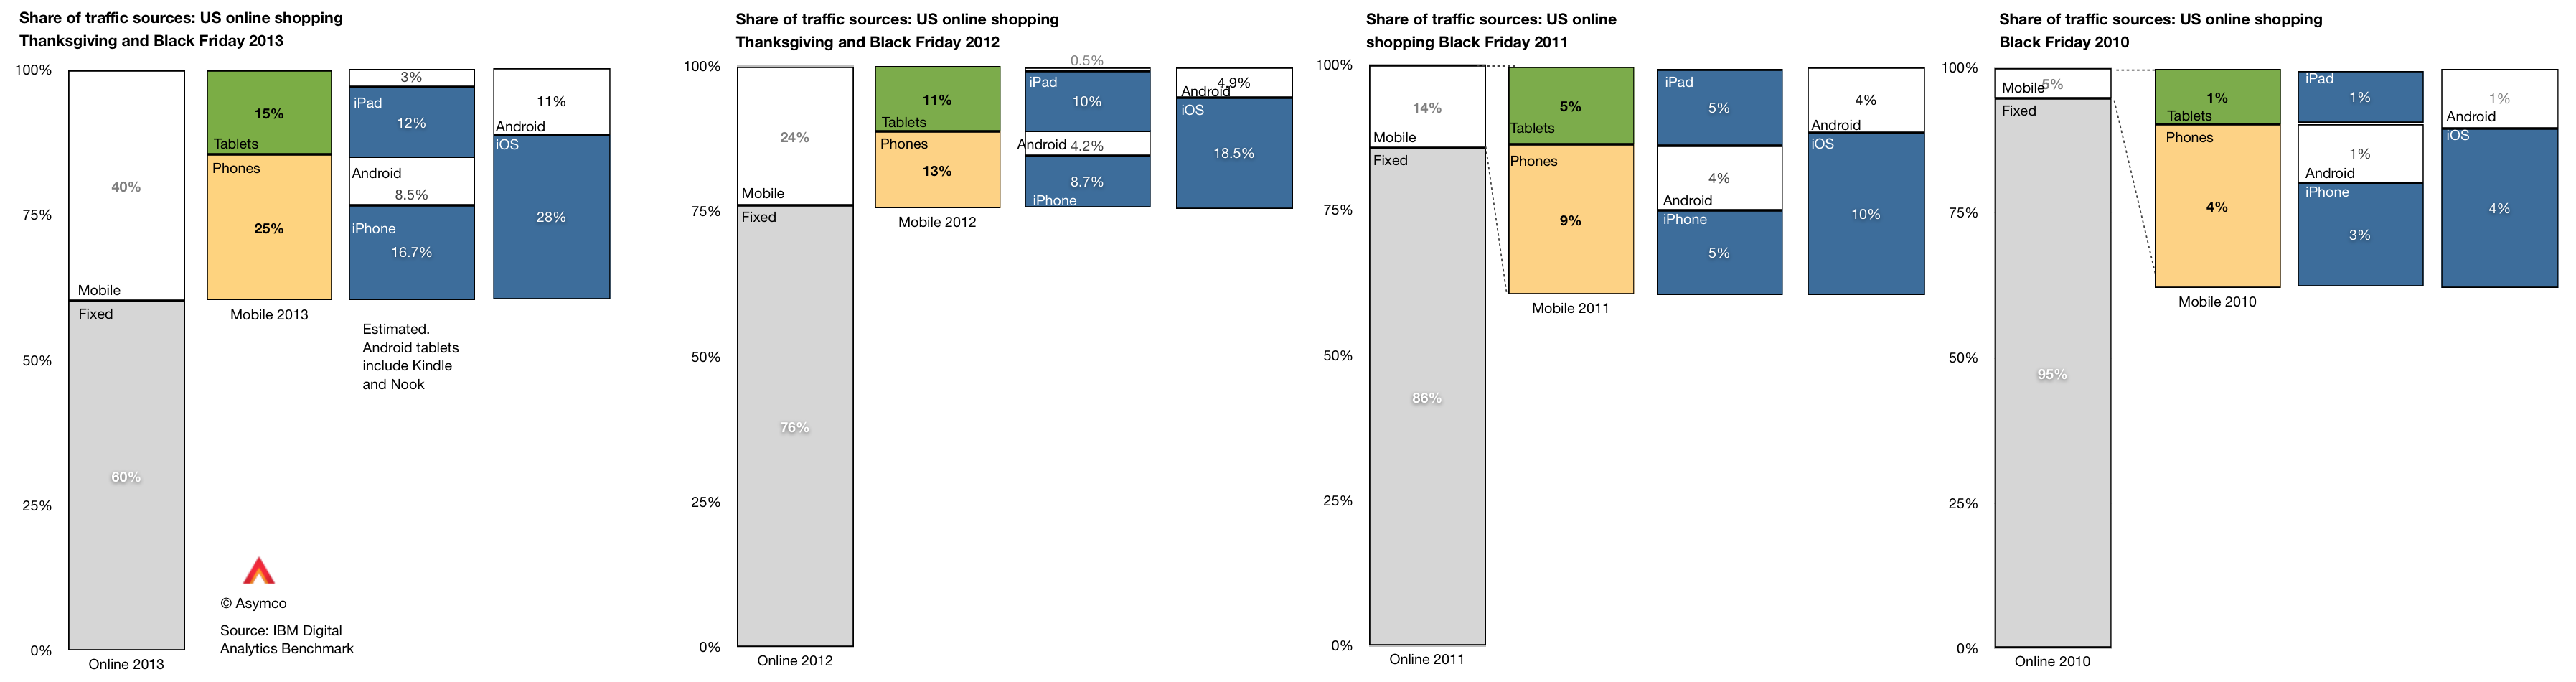
Within the data there is also a significant amount of detail beyond the mobile/non-mobile split in behavior. There is a distinction drawn between tablet and phone traffic and a further distinction between Android and iOS devices. ((The split between Android and iOS for tablets and phones was not published for 2013 but I extrapolated from previous years and assumed that 80% of tablet traffic was sourced from iPads vs 88% in 2012 and 99% in 2011. Note also that non-iPad traffic is assumed to be Android but that includes the Kindle and Nook products which are using partial and unsanctioned versions of Google's Android.))
This more detailed view of the traffic is shown in the following diagram:
A few observations:
The pattern of slowing tablet growth is likely due to the slowing growth in iPad sales. This itself is due to the lull in product launches as the shift to fall only iPad releases took place in 2012.
The consequence is that iPad traffic contribution only increased by 2 percentage points, from 10% in 2012 to 12% in 2013. Compare this with the doubling the previous year (from 5% to 10%).
Among phone users, both Android and iOS grew their contributions to traffic by roughly 100%. Android phone traffic increased from 4.2% of all traffic to 8.5% and iPhone traffic increased from 8.7% to 16.7%.
As we also know the approximate number of phone users for each platform (via comScore) then we can also determine the per user contribution of traffic of each platform. ((Note that this is phones only.))
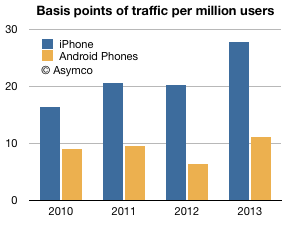
The measure is "basis points of traffic per million users" and it is the result of taking the traffic data (in percent of total online traffic) and dividing by the population of users of a particular platform. The result is shown below:
The way to read it would be that each million iPhone users generated about 28 basis points of traffic while each million Android users generated about 11 basis points of traffic.
A way to compare these audiences would be to define the ratio between traffic usage by platform user. That ratio was
1.83 (iOS:Android) in 2010
2.16 in 2011
3.15 in 2012
2.51 in 2013
So, as far as phones are concerned, US iPhone users are about 2.5 times more likely to shop online than US Android phone users. The data is reliable: with the US population now over 65% penetrated with smartphones, these populations of users (totaling over 130 million) are vast and representative. As the technology is reaching deep into the late adopter segments the difference in behavior between iOS and Android usage is becoming easier to explain. We have to eliminate quirks of demographics or income or other possible causes.
The platforms themselves are becoming the last remaining suspects as causes for differences in the behavior of their users.
It may seem preposterous to suggest that a platform can affect shopping behavior but let's remember that the PC, the subject of this article, is a platform in itself. The migration of usage away from the PC to alternatives can only be explained by the alternatives being superior at the particular job that needs doing. The argument is naturally extendable to each alternative individually.
I joined Benedict Evans and Ben Bajarin on their Cubed podcast to discuss innovation and cultures that breed innovation. We also discuss some updates on our thinking of the curious case of the android tablet ghosts toward the end.
Benedict Evans explains well the problem with measuring Android tablets. There are no reliable data collected because many of the devices are invisible through the regular, measurable channels:
There are no firms which report their shipments
They are not sold through retail chains which normally are sampled in the US and Europe (NPD and GfK respectively.)
They don't show up in browsing or ad transaction data
Google Play statistics are missing most of the activations since they are not sold as bona fide Google-sanctioned Android.
The only measured statistic happens to be component shipments. Items such as screens, CPUs or perhaps memory might be visible to market analysts. It's therefore tempting to add up tires manufactured to determine what's getting sold in auto dealerships.
But it's also hugely problematic.
Before we go into that rat's hole, I want to re-visit my original criticism for market analysis based on device attributes. When the iPad was new it was famously labeled a "media tablet" by Gartner and excluded from being counted (and hence compared) with PCs. This created an implicit signal to the analyst's clients to ignore the entrant as irrelevant.
That actually accelerated their demise (and the revenue prospects for the analyst).
In contrast to that exclusion--of a clear and present danger based on an arbitrary definition of form factor--the analyst who defines categories of products purely on the definition of their components is guilty of the same sin.
Snowing the audience with irrelevant comparisons is just as bad as withholding relevant comparisons. This is explicitly asked of witnesses: to tell the truth, the whole truth and nothing but the truth. The "nothing but the truth" means the exclusion of irrelevance.
The correct approach is to identify which devices are comparable (and thus in the same category) based on the jobs they're hired to do. If a tablet overlaps considerably in the work it does with a PC (e.g. browsing, email, media play, and other applications) then they should be considered comparable. If a tablet does nothing that a PC does or nothing that an iPad does (e.g. no browsing, email, apps or ecosystem activity other than piracy) then they should not be considered comparable.
Which brings me back to the question of what these dark matter "Android tablets" actually do.
To answer I want to recall another "dark matter" technology that seems to have gone largely unnoticed but was exceptionally popular. This was the VCD or Video CD. It was an alternative to the DVD without the licensing and DRM overhead it entailed. It was extremely popular in Asia as a way of not only buying but also sharing video content. The cost of content was a fraction of sanctioned versions, essentially taking the role that mass-copied VHS had in previous years.
The "job to be done" was to enjoy video content cheaply and conveniently for the equivalent of pennies a day. A job very similar to what we think of as cable TV today.
These devices and discs were largely invisible mainly because they did not exist in economies which adopted protected DVDs and because the content consumed did not hit against any databases that tracked consumption. Nevertheless there might have been hundreds of millions of these devices sold and billions of discs viewed.
Now we are in a situation where devices whose primary purpose is to watch video content (cheaply and conveniently) are being counted. By their counting, their implicit competitiveness is asserted. But it means nothing if they are not hired for the same jobs. In fact it misdirects attention.
Sometimes these "low end" devices do grow up to swamp the higher-powered alternatives with good enough functionality. That is the innovator's dilemma for low end disruption. But in some cases they don't because other factors are at work. Because ecosystems have complex multi-sided markets and because regulations and channels and consumer behavior conflict with the technical specification.
For this reason the VCD did not "disrupt" DVD or grow up into a Blu-Ray equivalent that caused Hollywood to crumble. It faded away as an anomaly.
Whether the dark matter Video-only Android device will come to swamp the iPad will depend not on just volume shipments in select geographies. It will depend largely on the ecosystems built around it. The ecosystems of VCD were largely unsustainable because there was no value placed on the content itself. The value chain did not strive to sustain the technology. When something better came along, it got dropped.
In contrast, content-based value chains sustain technologies which keep the revenues coming. And we can measure this revenue.
You don't need to look too hard for that in tablets. Apple states it quite frequently: total payments to developers.
Publicly, Mr. Lazaridis and Mr. Balsillie belittled the iPhone and its shortcomings, including its short battery life, weaker security and initial lack of e-mail. […]
Internally, he had a very different message. “If that thing catches on, we’re competing with a Mac, not a Nokia,” he recalled telling his staff.
The whole article is worth reading, detailing as it does the decision process inside BlackBerry during the painful disruption of its core business.
What struck me most however was how similar their decisions were to those of Nokia at about the same time. Consider:
The engineering priorities placed on optimization around constrained hardware. Although engineers knew how to build the right products, the business priorities caused them to be deployed in the wrong direction.
The delays these misdirected efforts caused. Mobile phones have narrow windows of opportunity but long lead times. A strategic mistake is very costly and most probably impossible to remedy. In the case of BlackBerry, buying QNX came too late while for Nokia the deprecation of Symbian was catastrophically managed.
The feedback loop from network operators which shut down any initiatives for improved user experiences. Your best customers provide all the wrong information when the market is being disrupted. Ignoring them is impossible while complying is a strategic mistake.
The demand from network operators to develop "killers" to competing platform-based products ((Ironically, Nokia was asked to do a BlackBerry killer)) and the subsequent "jumping at the opportunity".
Listening to large buyers at the expense of users. While BlackBerry was guided to omit consumer features from its enterprise buyers, Nokia never secured enterprise buyers of any significance ((though they tried very hard to get them)). Nevertheless it created the "E series" business-friendly phones which suppressed features like cameras and music.
The celebrity sponsorships and wasted promotional efforts in the face of structural failures. This is manifested today by HTC as well.
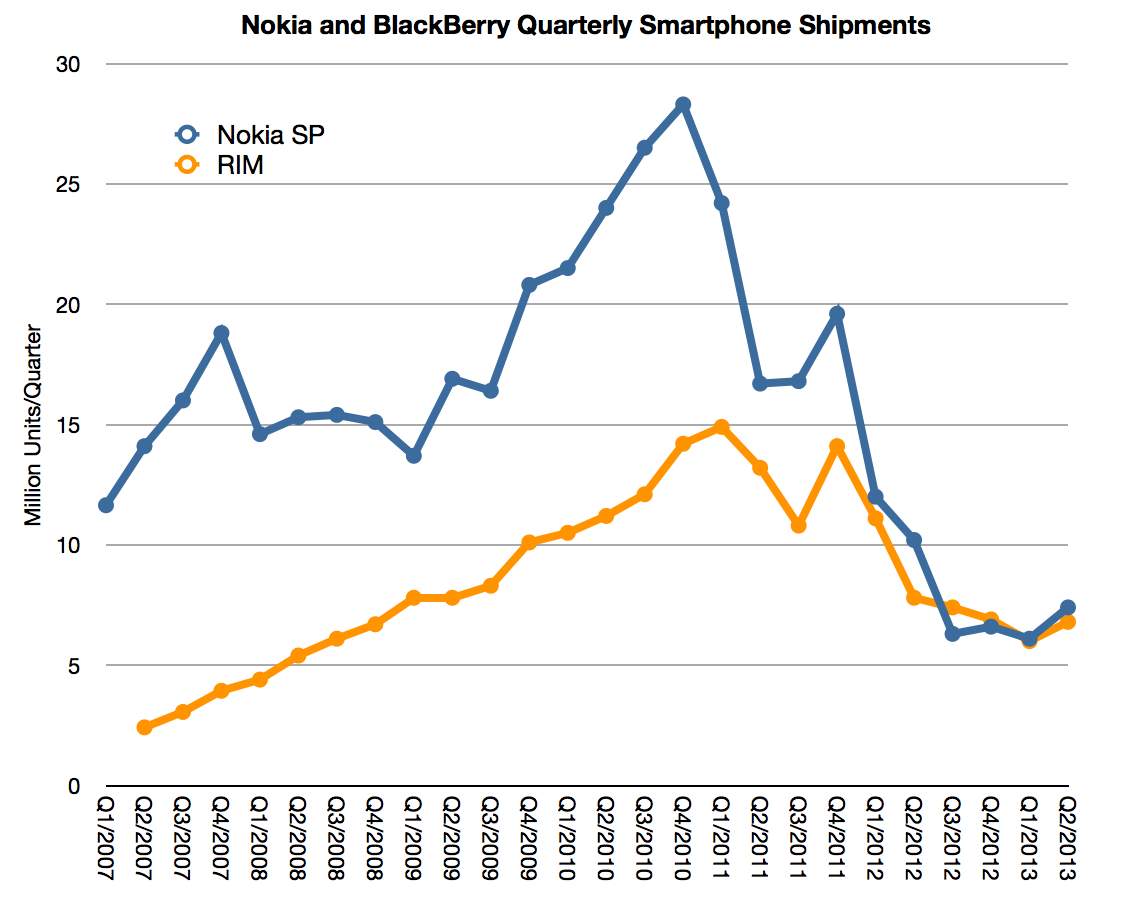
The parallelism of this synchronized failure can be seen in the following graph showing smartphone volumes.
The striking thing is how the two companies peaked are almost precisely the same time and how that moment (end of 2010) was not related to the entry timing of their nominal disruptor.
Recall that both companies cite the iPhone as the factor which caused a shift in the basis of competition. But the iPhone launched in mid 2007 (at the beginning of the graph's date range.) BlackBerry had 16 quarters of growth after the iPhone and Nokia nearly the same. The stock prices of the companies also prospered for a period long after the iPhone entered the scene validating a do-nothing approach. So this is the crux of the incumbent's dilemma: how do you rally a response when you don't feel any pain? It's worse actually: how do you embark on a painful course of action while feeling comfortable and safe?
The reason the companies did not suffer immediately from the iPhone was because it (and its Android equivalents) took time to reach the core customer bases. Remember that the iPhone was not "good enough" to be an enterprise product at launch and Android was not the first to serve the low end of the market, where Nokia was dominant.
Vision is worth exactly nothing without timing.
But enough about ancient history. The crucial question is what does it teach us. It's tempting to suggest that this disruption is happening again with the iPhone today.
There is one big problem with this. The iPhone was not a low-end disruption. It was exactly the opposite. The BlackBerry and the Nokia products were striving for the low end. They observed the discipline of constrained resources. They were expanding into emerging markets. They watched every fraction of a penny on the bill of materials. The low end was manna for the whole industry. Even Microsoft with Windows Mobile was better positioned for the low end than Apple.
Instead, what Apple did was unthinkable. It entered with a high end product. It even promoted its high price ($500, subsidized!) This is why it was laughed at.
Theirs was "the Mac in a phone" idea. The reason it worked was that it was not a phone. The reason it worked is because it was the hardest disruption to spot:
A new market disruption ((The reason Clayton Christensen and his disruption consulting black belts could not spot it is mostly because new market disruption requires deep industry domain knowledge))
Disruption is not a process that merely rewards breaking convention. Any fool can rebel against the status quo. To change it requires a process that rewards asymmetric competition. Finding a way to be seen as irrelevant and yet conquering at the same time. Being disruptive is, above all, being imperceptibly valuable.
For iPhone the core asymmetry was that it was a computing product and not a telecommunications product. Every decision thereafter flowed from the calculus of computing and not the compliance with telco convention. The ecosystem, the rapid rate of improvement, the rich user experience, the tie into other product lines.
It was this asymmetry which confused every observer. Predicting how a high end product can conquer the low end is fiendishly counterintuitive.
In contrast, spotting low end disruption is a parlor game. There is little challenge in observing a cheaper alternative competing as a commodity. For evidence look at how markets react. Whereas they could not understand the value of the iPhone (or iPod or iPad) they reacted instantly to the whiff of a commoditization play. Angst surrounding cheaper alternatives pervades. ((The contrarian should note that commoditization plays are hard bets to win since everybody can spot them.))
The problem with the low end disruption thesis is that low end is also much easier to respond to, especially now that everyone read the book. The incumbent simply needs to have a flexible cost structure and a vast margin to dip into. Most failures to respond to a low end disruption come from companies stuck in a high cost structure not from a failure to see a low end alternative. ((Christensen case studies almost always cite how the low end disruption was perceived easily but the response was felt to be marginally worse than not responding or fleeing upmarket.))
Apple's costs are mostly variable and their fixed (R&D and SG&A) are growing far slower than sales. There are huge margins and more cash being spun out than anyone can figure out what to do with it.
The distressed response to the low end tends to be a retreat into the higher margins and an abandonment of existing customers.
I don't see Apple doing either. Rather, it is gradually adjusting its portfolio toward lower end alternatives. Note that demand for the lower end product is far less than for the high end. Instinct would suggest that they should have stuck with the 5S alone. But it moved down anyway. It also did so with the iPod, iPad and Mac mini.
The idea that Apple is vulnerable to the low end is a relic of an idea. It goes back to the Mac of the 1990s, at a time when the world-wide computing market was orders of magnitude smaller than today and where purchasing and development decisions centralized in the hands of a few large companies ((essentially B2B as Ben Thompson points out)). And even when looking at that competition, the Mac somehow managed to survive.
That's not likely to be the case for those who found themselves in competition with the Mac in its pocketable re-incaration.
One of the curiosities of the mobile phone market is how vast it is but also how heterogeneous it has always been. I wrote about this in 2010: Smartphone parochialism: How operator policies prevent or promote platform adoption. This observation was influenced by my time at Nokia where I became amazed at how differently users behaved in different countries.
There were many causes. Some cultural, some historical, some economic and some policy-driven. The result was that it presented a challenge to any company with global ambitions and indeed it was rare to see the same company do well in every market. Japanese companies did well in Japan, European companies did well in Europe and US (and Korean) companies did well in the US. Nokia was most successful because it was able to apply an European model more broadly (but not in the US). Samsung succeeded by simply adapting to each and every market with hundreds of products. But it was a particularly "provincial" market.
My assumption was that when smartphones would become the majority of phones in use there would be a normalization of behavior and thus a homogeneity of preferences. This is, after all, what happened in other platform games. PC form factors are globally consistent, PC operating systems are equally preferred around the world, FaceBook, Google and Twitter are also, unless censored, uniformly popular. Apple's iPod eventually also became a global phenomenon with no material difference in preference by market. Likewise for game consoles. ((Although Japanese do seem to prefer Japanese platforms more.))
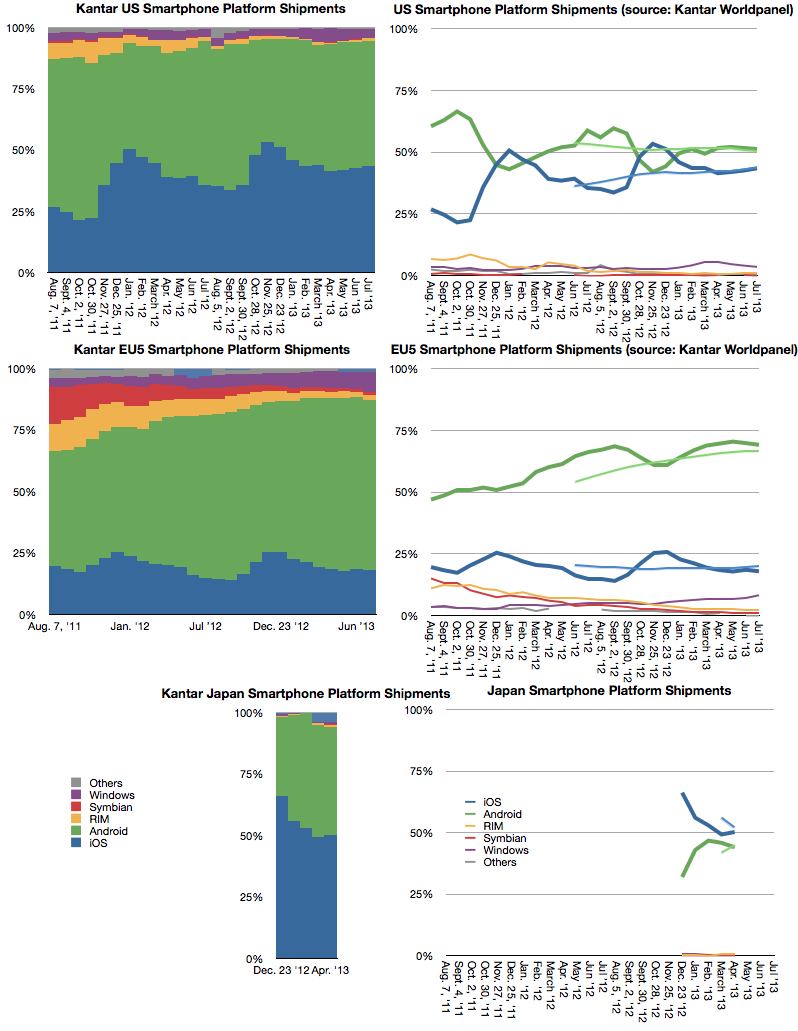
However, a decade after the broad adoption of smartphones, the relative popularity of various platforms is still unevenly distributed. Prior to the iPhone, Symbian was strong everywhere but the US and BlackBerry was very strong in the US but weak elsewhere. Windows Mobile had footholds in some markets but little traction in others. Today the picture has changed but it's still a patchwork of preferences. Consider the following graphs.
They are the most detailed sets of data on platform phone purchases but they not the only data: We also know that Android is vastly more popular in India from web usage statistics. We know that BlackBerry is sensationally popular in Latin America and the Middle East. We know that within Europe there is a gap between North and South in iOS vs. Android and even more pronounced between East and West. We know that whereas iPhone was a huge hit in Korea upon its launch there, Samsung and LG swamped it in the last two years.
But the data shown above is the story of iOS being very popular in Japan and increasing its share in the US while being flat in EU5. Again these three markets are different but each contradicts the global picture.
Note the differences in trend not just absolute performance. This is what is puzzling. There seems to be a divergence between markets: Markets are become more islands onto themselves rather than one whole. This contradicts all the theories of how computing markets should behave (network effects, ecosystems, monopoly power, etc.) It implies that there is still a great deal of friction in the market; friction which I suspect to be due to the peculiar nature of telecom economics.
I wonder if this observation is, as usual, late on my part and that Apple's iPhone product marketing has seen it years ago.
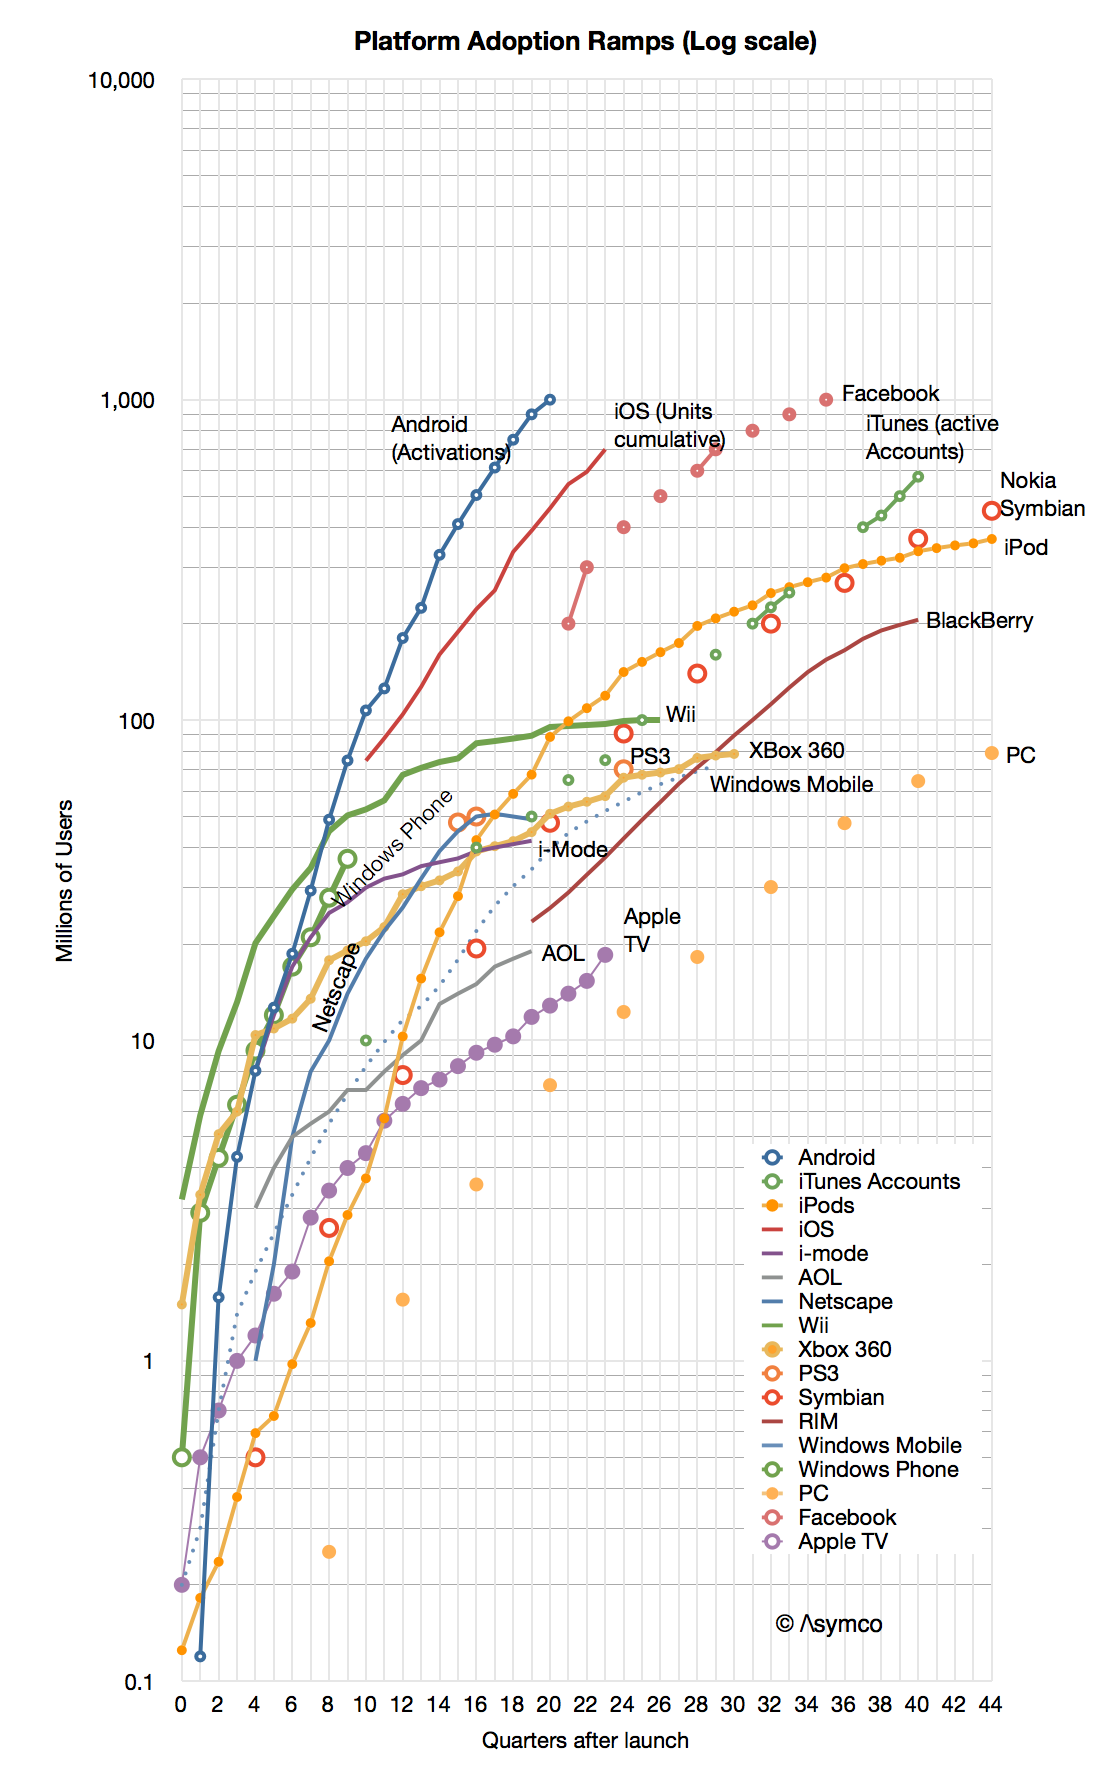
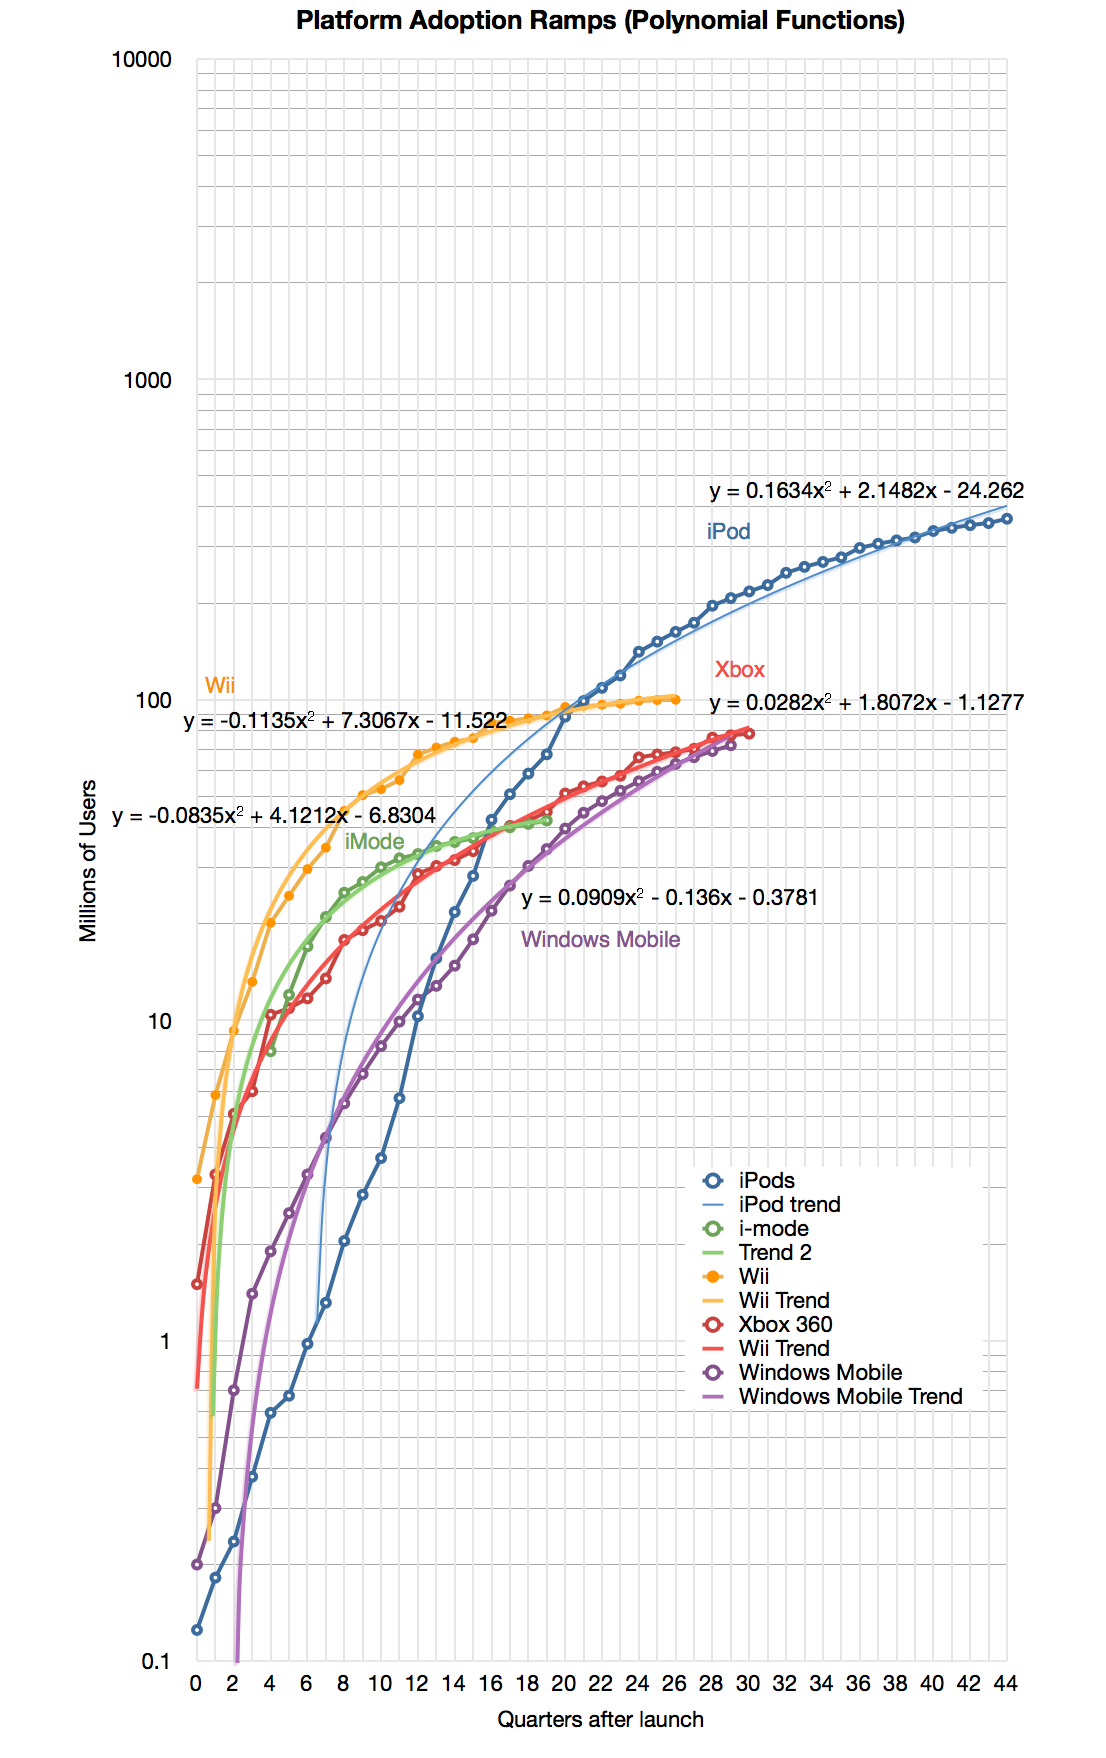
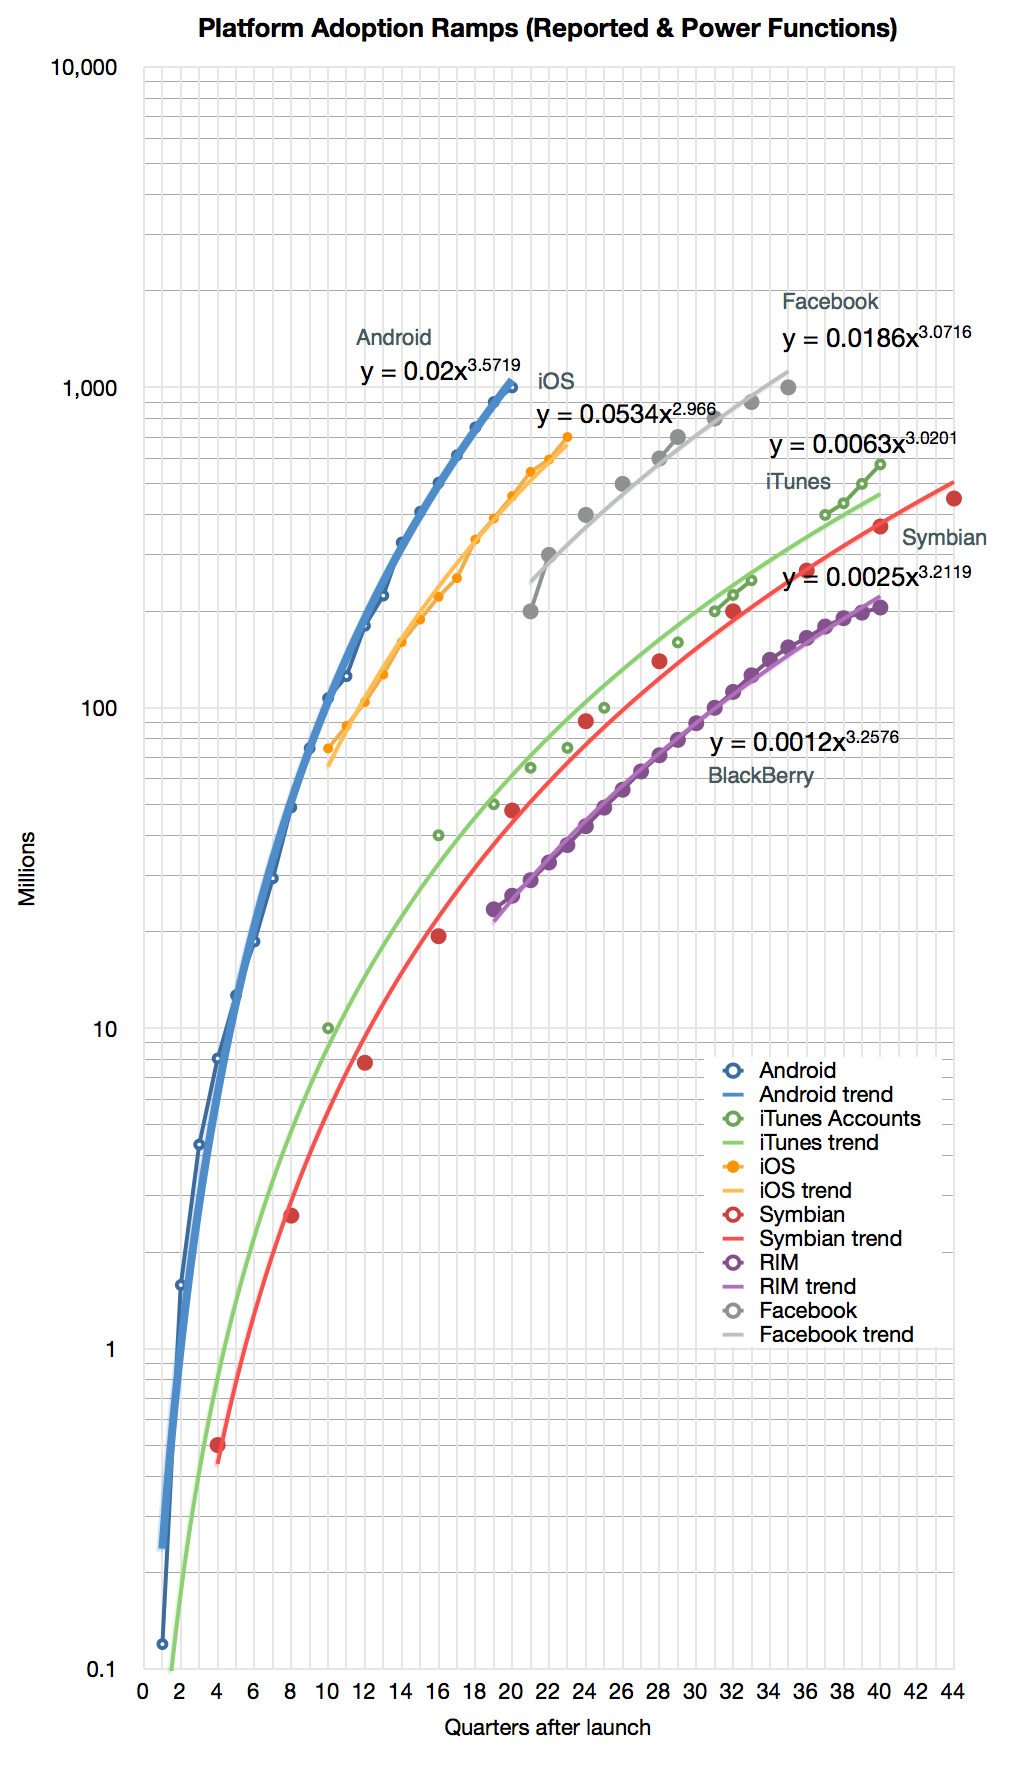
When looking at the Race to a Billion data I noticed that some platform adoption ramps look quite different from others. It's not just a matter of "slope" or rate of growth but a distinctly different shape.
If you look at the graph below you might see the difference yourself.
First, note that the graph is logarithmic. A straight line on a log chart implies exponential growth (the y values are a constant to the power of the x value). However, none of the graphs show straight lines. None of the platforms follow exponential growth ((Except perhaps in the very early periods)).
Second, we can eliminate linear or logarithmic functions. They simply do not fit.
That leaves: polynomial or power. It's easy to test these alternatives for all the functions and it becomes clear that most of the platforms split into one of these two classes.
Here are the classes ((Some of the platforms had to be dropped because there was no easy fit. My observation is that some of these platforms went through some crisis or change in strategy during their history which caused the pattern of growth to change)):
Note that I added the formulas for the selected platforms.
I named these classes after their function types: "Power platforms" or "Second Order platforms" ((Note that all Polynomial functions found above are second order)).
This classification has two benefits:
It allows a clearer distinction in scope. Both may exhibit signs of network effects, but Power platforms seem to exhibit "global" or unlimited reach while Second Order platforms may have a strong upper bound on reach.
It allows more reliable forecasting. If a platform classifies as Power, the forecast could be created with fewer data points.
It allows us to guess at the causes of entry into each class for any potential platform challenger.
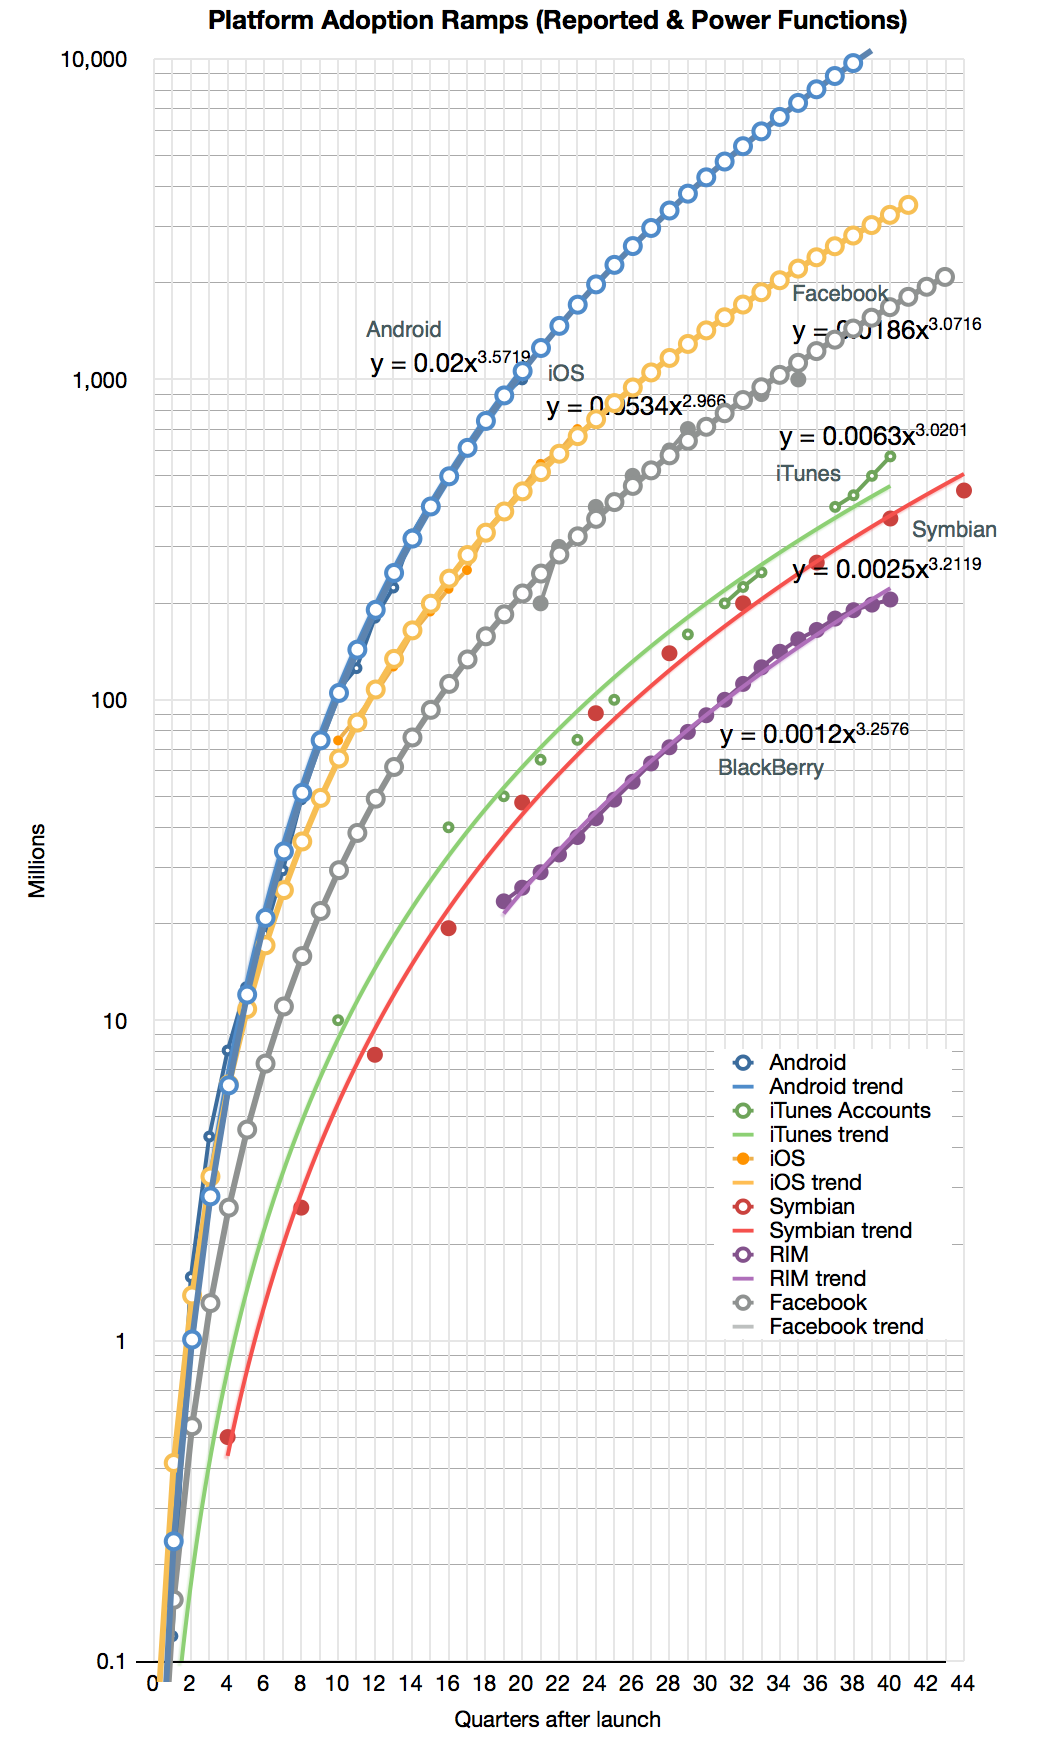
To illustrate the second benefit, I took the Android, iOS and Facebook power functions and modeled (i.e. extrapolated) them for a few quarters into the future. The result is shown below:
The forecast shows the following:
Android will reach 10 billion activations 10 years after its release (mid 2018)
iOS will reach 1 billion units sold by end of next year and 3 billion units by its 10th anniversary in 2017.
Facebook will reach 2 billion users by 2015 after the end of its 10th year.
My thanks to Kirk Burgess for providing this transcript:
Horace Dediu interview on CNBC Asia Cash Flow show - 10th September 2013
Chloe Cho (CNBC): Take us through what Apple is exactly trying to do?
Horace Dediu: Well, this is the first time in the six years of this competition in the smartphone market that Apple has broadened its portfolio. We have seen only a single product launch every year--this is very unorthodox in the industry. Normally each competitor [ranges] dozens of devices. Apple's entry has been asymmetric from the start, and now in its sixth year we are expecting to see, finally, a broadening perhaps into two separate products. The question will be whether [there will be] a significantly lower price point for the so-called 5C and whether that will change the average selling price overall for the portfolio. The average selling price has been remarkably steady, and remarkably high, typically around $600 for the duration of this products life. Something, again, unprecedented. My expectation is the new price point will be quite a bit lower than $600, starting with about $450, it might drop a bit further, [which] would cause the overall price range to come down as we have seen with the iPad; [where we] also had a price erosion happen as the smaller version came out.
Q: Horace, do you think they have got the timing right? Should they have done this a little bit earlier when the market wasn't so saturated and filled with cutthroat competition?
A: Indeed, I think. As I said, as a product with six years in the market it's a bit late; I expected this to happen last year. I think a lot of the momentum that has been lost in the past year in terms of sales growth has been because of the lack of low end. To note also will be whether they indeed expand their carrier footprint. We are expecting something new in Japan and possibly China Mobile. There is a second announcement happening with a few hours delay in China. This is again the first time that has ever happened.
Q: Horace, do you think they didn’t move down the value chain fast enough largely because they didn’t have a deal with China Mobile?
A: Well that's always a good question whether they are driven more by carrier channels or are they driven more by consumer market expectations. I think it's a bit of both. We do have this hybrid approach where they continue selling this older product for one or two years after the new product is launched--so the 4 and 4S are still available while the 5 is being ranged. This strategy is hybrid I say because this isn't truly a low end product, it is a stale product that is being put out there. This [strategy] may be driven more by consumer demand, not so much what operators are asking for. With the 5C we might be looking at a solution for operators in particular.
Q: Horace, how much do some these incumbents like Apple and Samsung need to be worried about Microsoft approaching their space?
A: I believe Microsoft will not be competitive in the near term. I don't think [during] the next year we are going to see a very impactful entry from Microsoft. What Microsoft is likely do is lower prices significantly on Nokia's portfolio and their pipeline as it is. That might cause more pressure on the pricing, but the problem has been that consumers have not really been taking up the Windows Phone platform very aggressively. It has been somewhat successful in Europe but not taking off elsewhere. I think Microsoft will be in an integration mode with the Nokia assets into 2014, but I would expect in a year from now we might see some new entry product that would be exciting. I think 2-3 years down the road we might see something from Microsoft that would excite consumers as well.
Q: There has been a lot of focus on which companies have a more integrated house, Apple or Samsung. In light of the fact that they are having to move into lower price points, in your view which is doing the better Job, Apple or Samsung?
A: Well Samsung is a great industrial enterprise and they are doing very well by broadening as much as possible their portfolio, even before the smartphone race started for them, which was in 2010, they were known for being one of the most prolific product creators out there. They actually had over 100 different mobile phones, not smartphones, just regular mobile phones that they would range, and Nokia were extremely concerned by this pressure they were getting from Samsung.
What they have seen since 2010 is the same thing, except with smartphones, and so they’ve been really prolific and covering the spectrum of price and screen and every other possible variant that could be made. I think however that Samsung hasn’t got a software platform under its belt. They could become a software player by taking over some of the control of Android as we have seen Amazon do, and thus really establish themselves as a platform player. They are doing so to some degree with the "Gear" product, and they might be doing something like this by launching their development conference this year.
But they aren't yet a platform player whereas Apple is, but then again we just don’t know what the politics of Android are with respect to forking it by an OEM as large as Samsung.