Asymco

Asymmetric Intelligence

Android

  1. Significant Contribution Again

    Research

    Five years ago I used the Cook Doctrine (put forward 12 years ago) to assess the possibility of Apple's entry in the car market. That doctrine states, among other things:

    We believe that we need to own and control the primary technologies behind the products we make, and participate only in markets where we can make a significant contribution.

    Tim Cook

    I concluded that it was not a question of if, but of how and to what degree Apple could make a significant contribution. How in terms of control of the technology and to what degree in terms of significance of contribution.

    It was a tough call five years ago and it's still a tough call today. Arguably the failure of initial efforts to meet the Cook doctrine have caused resets and reboots and pivots which means no entry is visible in the near future.

    But there is another effort that Apple has undertaken in the automotive space which might be indicative of their intentions and capabilities.

    This is an effort that hardly gets mentioned and was dismissed as immaterial a long time ago but I would argue it has made a contribution. It's also unique for Apple in being a licensed software technology made available to hundreds of licensees and extending a software and services strategy to non-Apple hardware.

    I am speaking, of course, of CarPlay.

    CarPlay was announced almost exactly 6 years ago. It implements a unique division of labor between the iPhone and the on-board hardware. A division that keeps most of the computation and data on the phone but displays and allows inputs through the car. As a result it can evolve with new versions of iOS while keeping car inputs and outputs functional even when they age well beyond the lifespan of several iPhone generations.

    It can be argued that CarPlay is a necessary "connector" for the iPhone for that one hour a day that many iPhone users spend in their cars. It is effectively a better way to control the iPhone and have it be the "brains" of the infotainment system. In that regard it's very similar to Apple TV: controlling the "dumb" TV without having to be a screen. The difference here is that CarPlay does not need an Apple remote.

    But how is this significant? It improves things, sure. It improves most in-car experiences related to making calls, music, navigation, calendar, messaging, podcasts and news. It also seems to have traction.

    The measure of any product introduction should be adoption and in that regard CarPlay could also be seen as significant in its departure from the Apple play book.

    Because the adopters are not users but carmakers, the decision to deploy it depends on it being licensed and put into cars that are produced and made available. Quite a different set of hurdles, these are the "orifices" that Steve Jobs famously riled against.

    One of the aspects of adoption by institutions vs. adoption by consumers is that whereas consumers are influenced by an early adopter calculus followed by the observation and imitation of others, for institutions there is a long delay with indecision followed by a rush to do adopt in unison with competitors. In other words, the adoption curve for consumers is a continuous gradual uptake whereas for institutions it's a flat line followed by near-vertical step function.

    We can see this with the following graph showing the number of car models supporting CarPlay for the model years they represent.
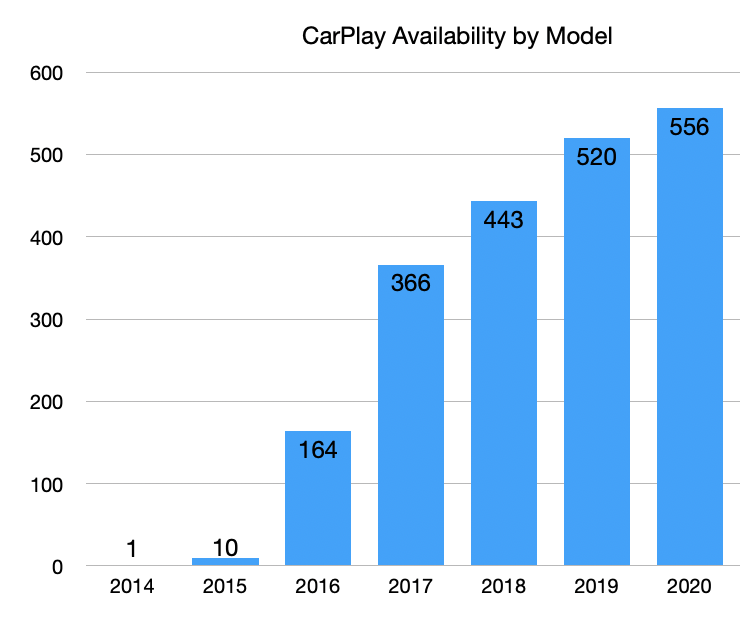
    2014 and 2015 were very tepid but 2016 and 2017 saw huge leaps in adoption. Since then there has been a steady filling out of support. At this point in time about 600 car models support CarPlay which is very nearly all the models available in the US market and a substantial number for the markets where the iPhone is widely used.

    So is CarPlay significant and can it provide control? On the control side the answer is a tentative yes. CarPlay creates an iOS bubble in the car and it sustains the iPhone ecosystem with no incursions by alternatives likely. [Android Auto which seems to have a similar degree of adoption does the same for Android but there is no "pull" of switchers from one to the other.] Anecdotally, CarPlay support has become a hygiene issue with carmakers. Having it offers few advantages but not having it may repel users.

    On the significance question, the answer should be "it depends". The support seems substantial but it's hard to assess market share of models as a complete list of car models available is not easily obtained. Apple has effectively injected software in a lot of cars and done so relatively quickly. By licensing it has amplified its reach much in the way Microsoft did with Windows and the Intel PC in the 90s. The speed is remarkable because everything in the car industry happens very slowly.

    More than 1000 licensed car models in 4 years. This is quite a feat.

    But the software touches only a fragment of the car. Infotainment is important, perhaps more than anything else the user perceives about the car experience. But it has not changed what the car is. It has not made driving safer nor more productive or more efficient.

    Messaging and calling and mapping/navigation notwithstanding, significance needs to be measured in more important terms. The iPhone is significant precisely because an iPhone is not a Phone. The Apple Watch is significant because it's not a Watch. AirPods are significant because they are not just acoustics.

    CarPlay would be significant if it made the car something it isn't and not keep the car being what it is. We know it should be something else and that is what we are all waiting for.
  2. Subscribe Again

    Research

    In March 2016 Ben Bajarin and I put on an event called SUBSCRIBE where we asked, among other things,

    • How will the online services business models evolve?
    • How will hardware affect software and services and vice versa?
    • How will  users, usage, and capital connect?

    Now is a good time to look back on that event.

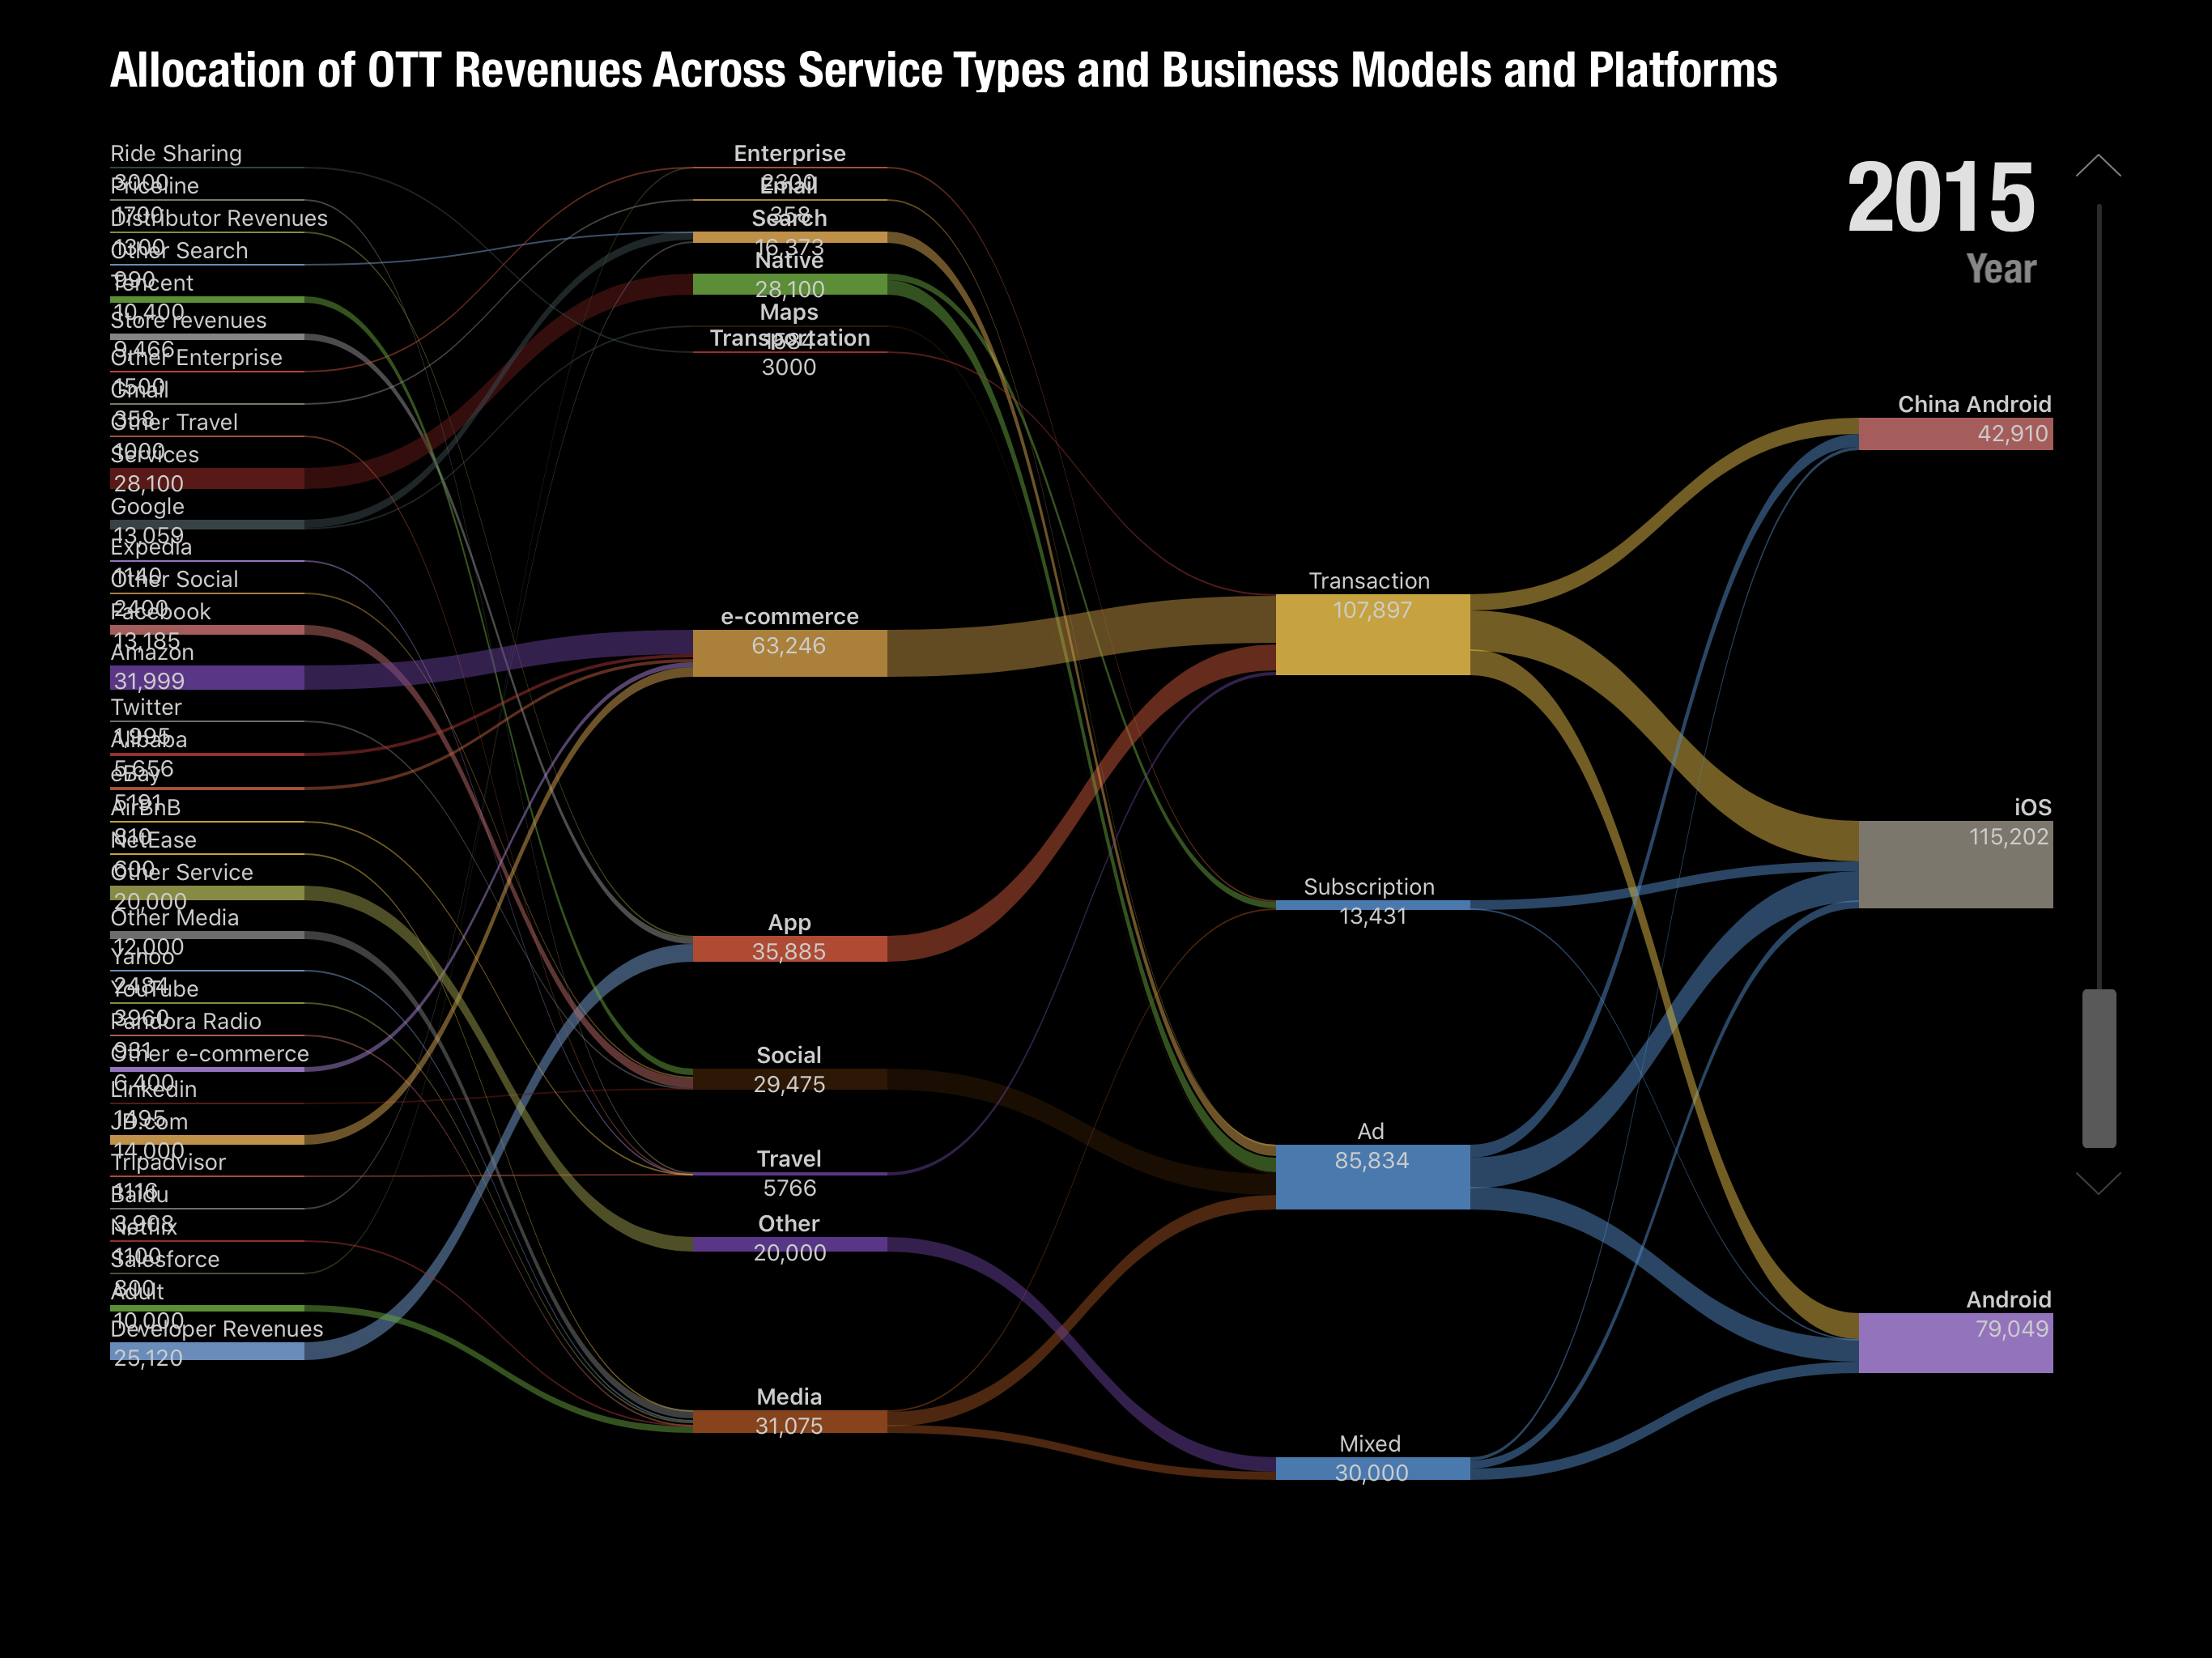
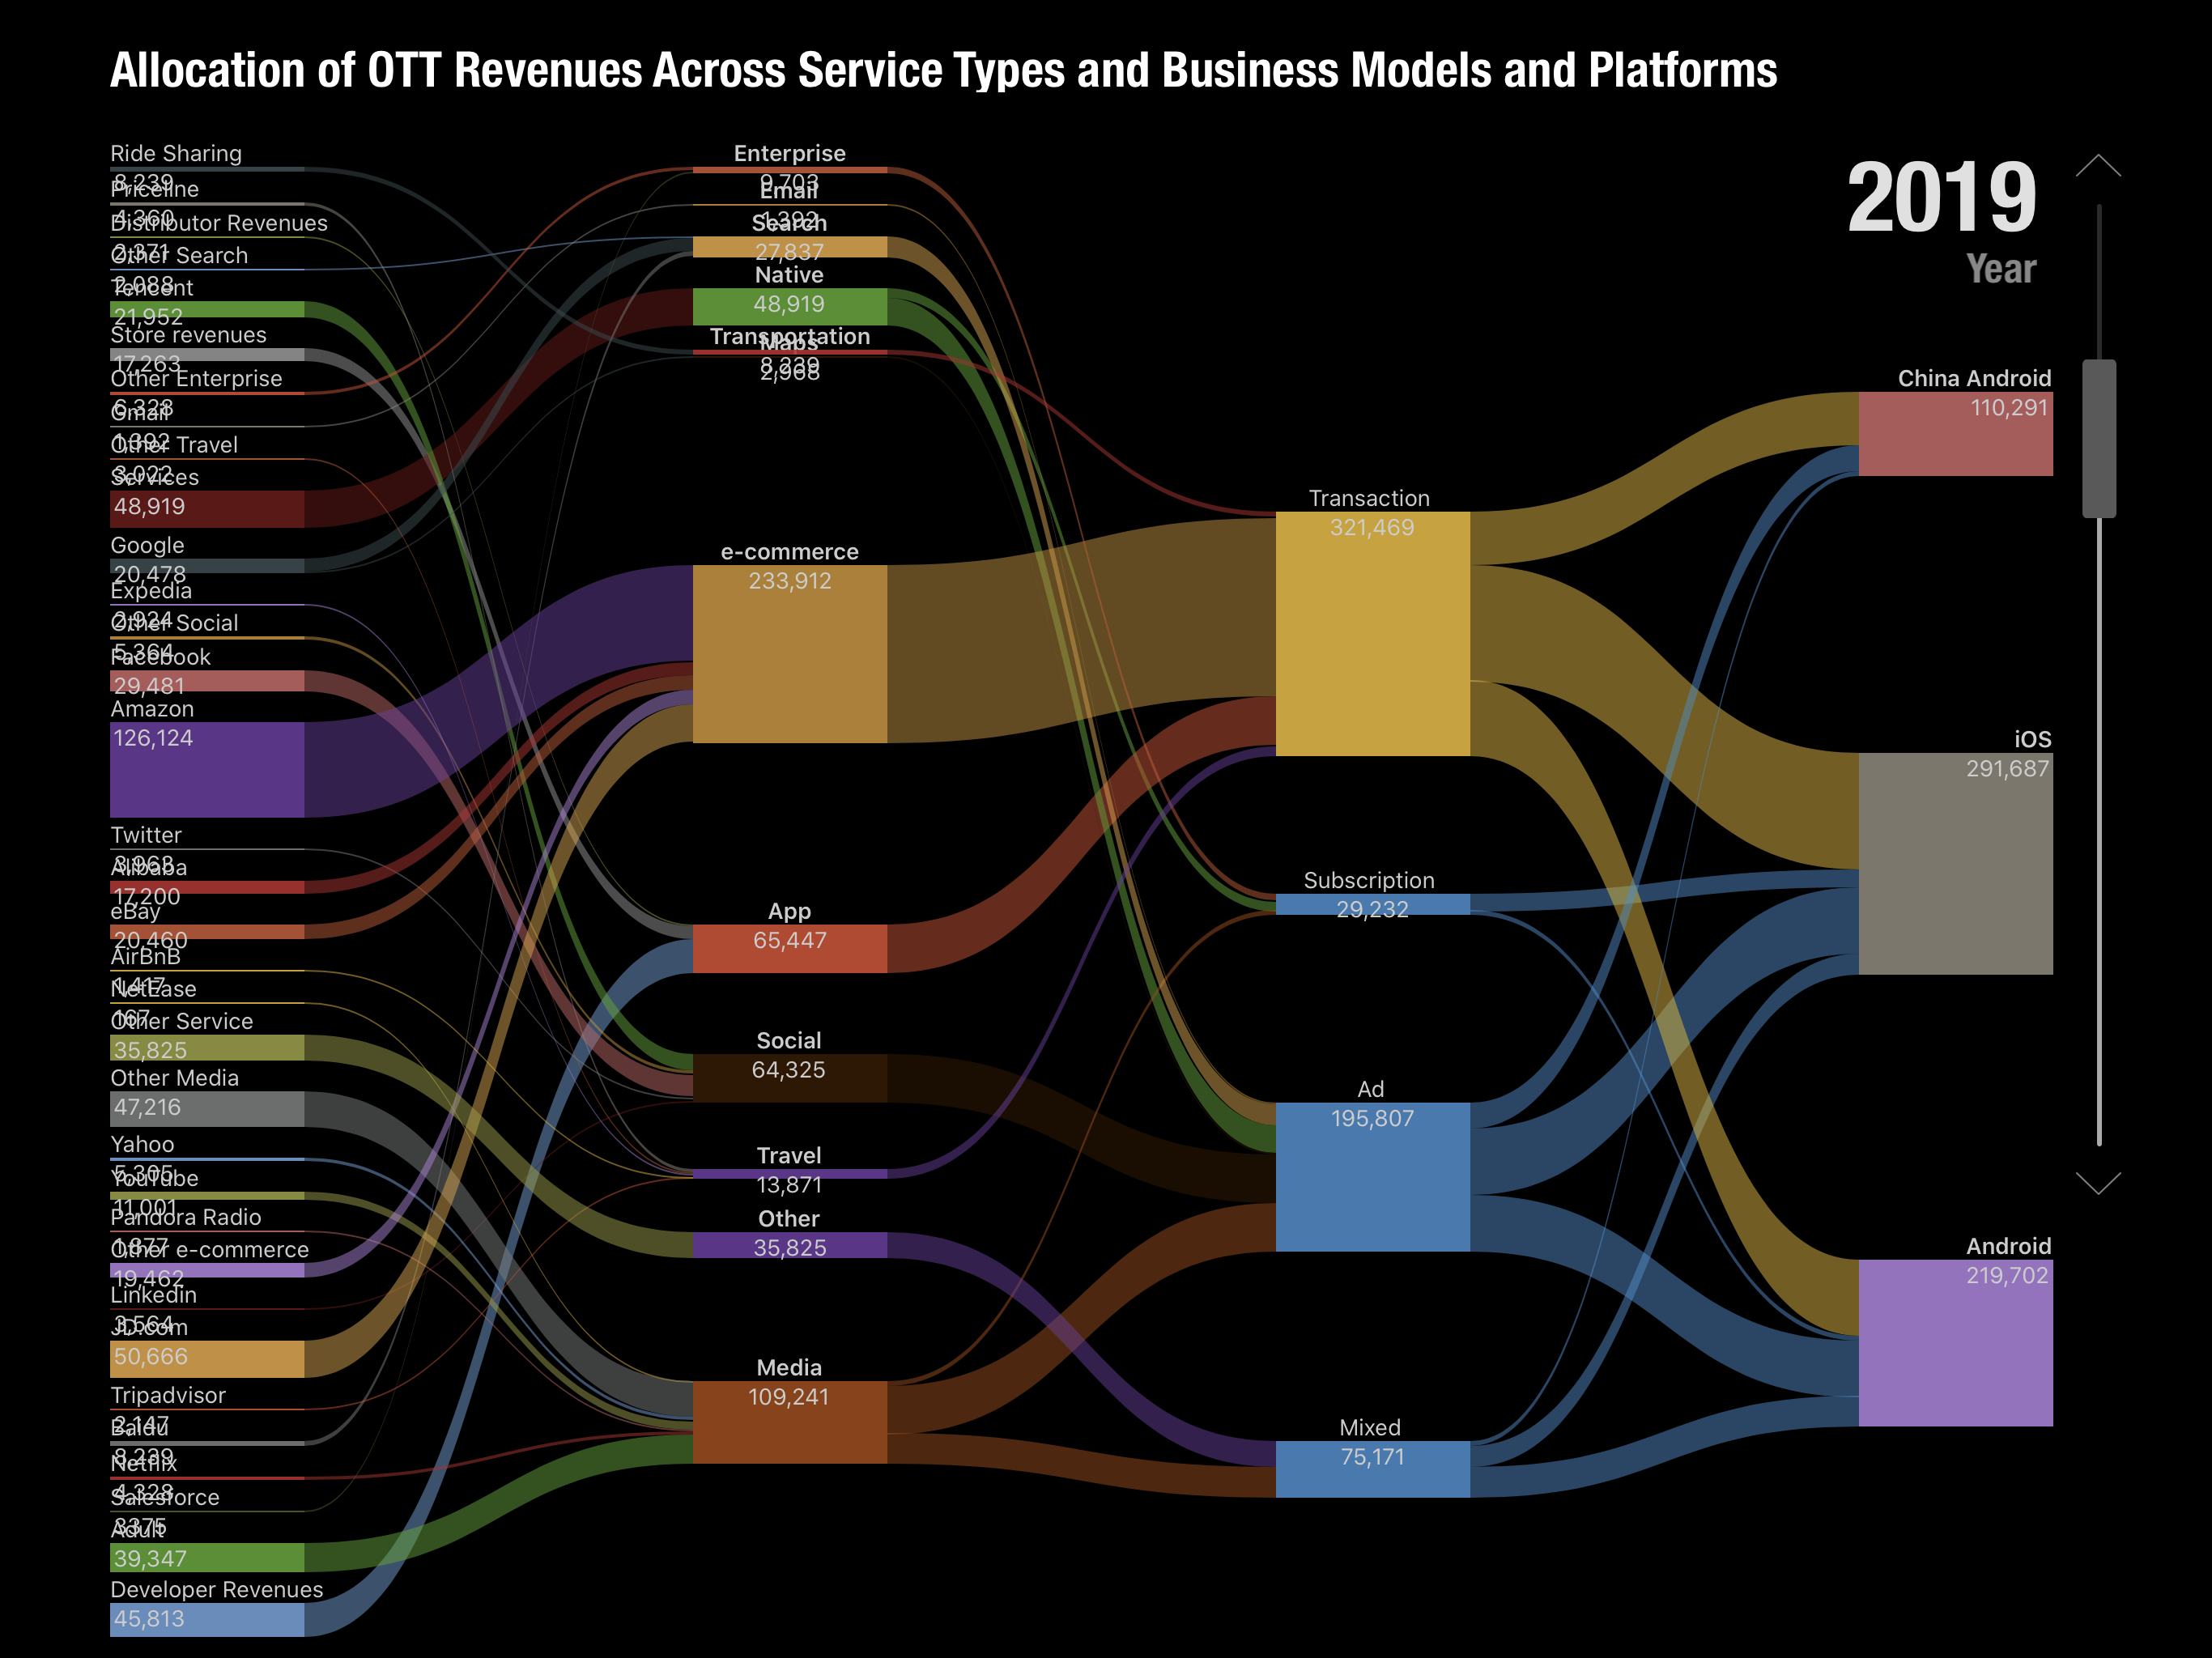
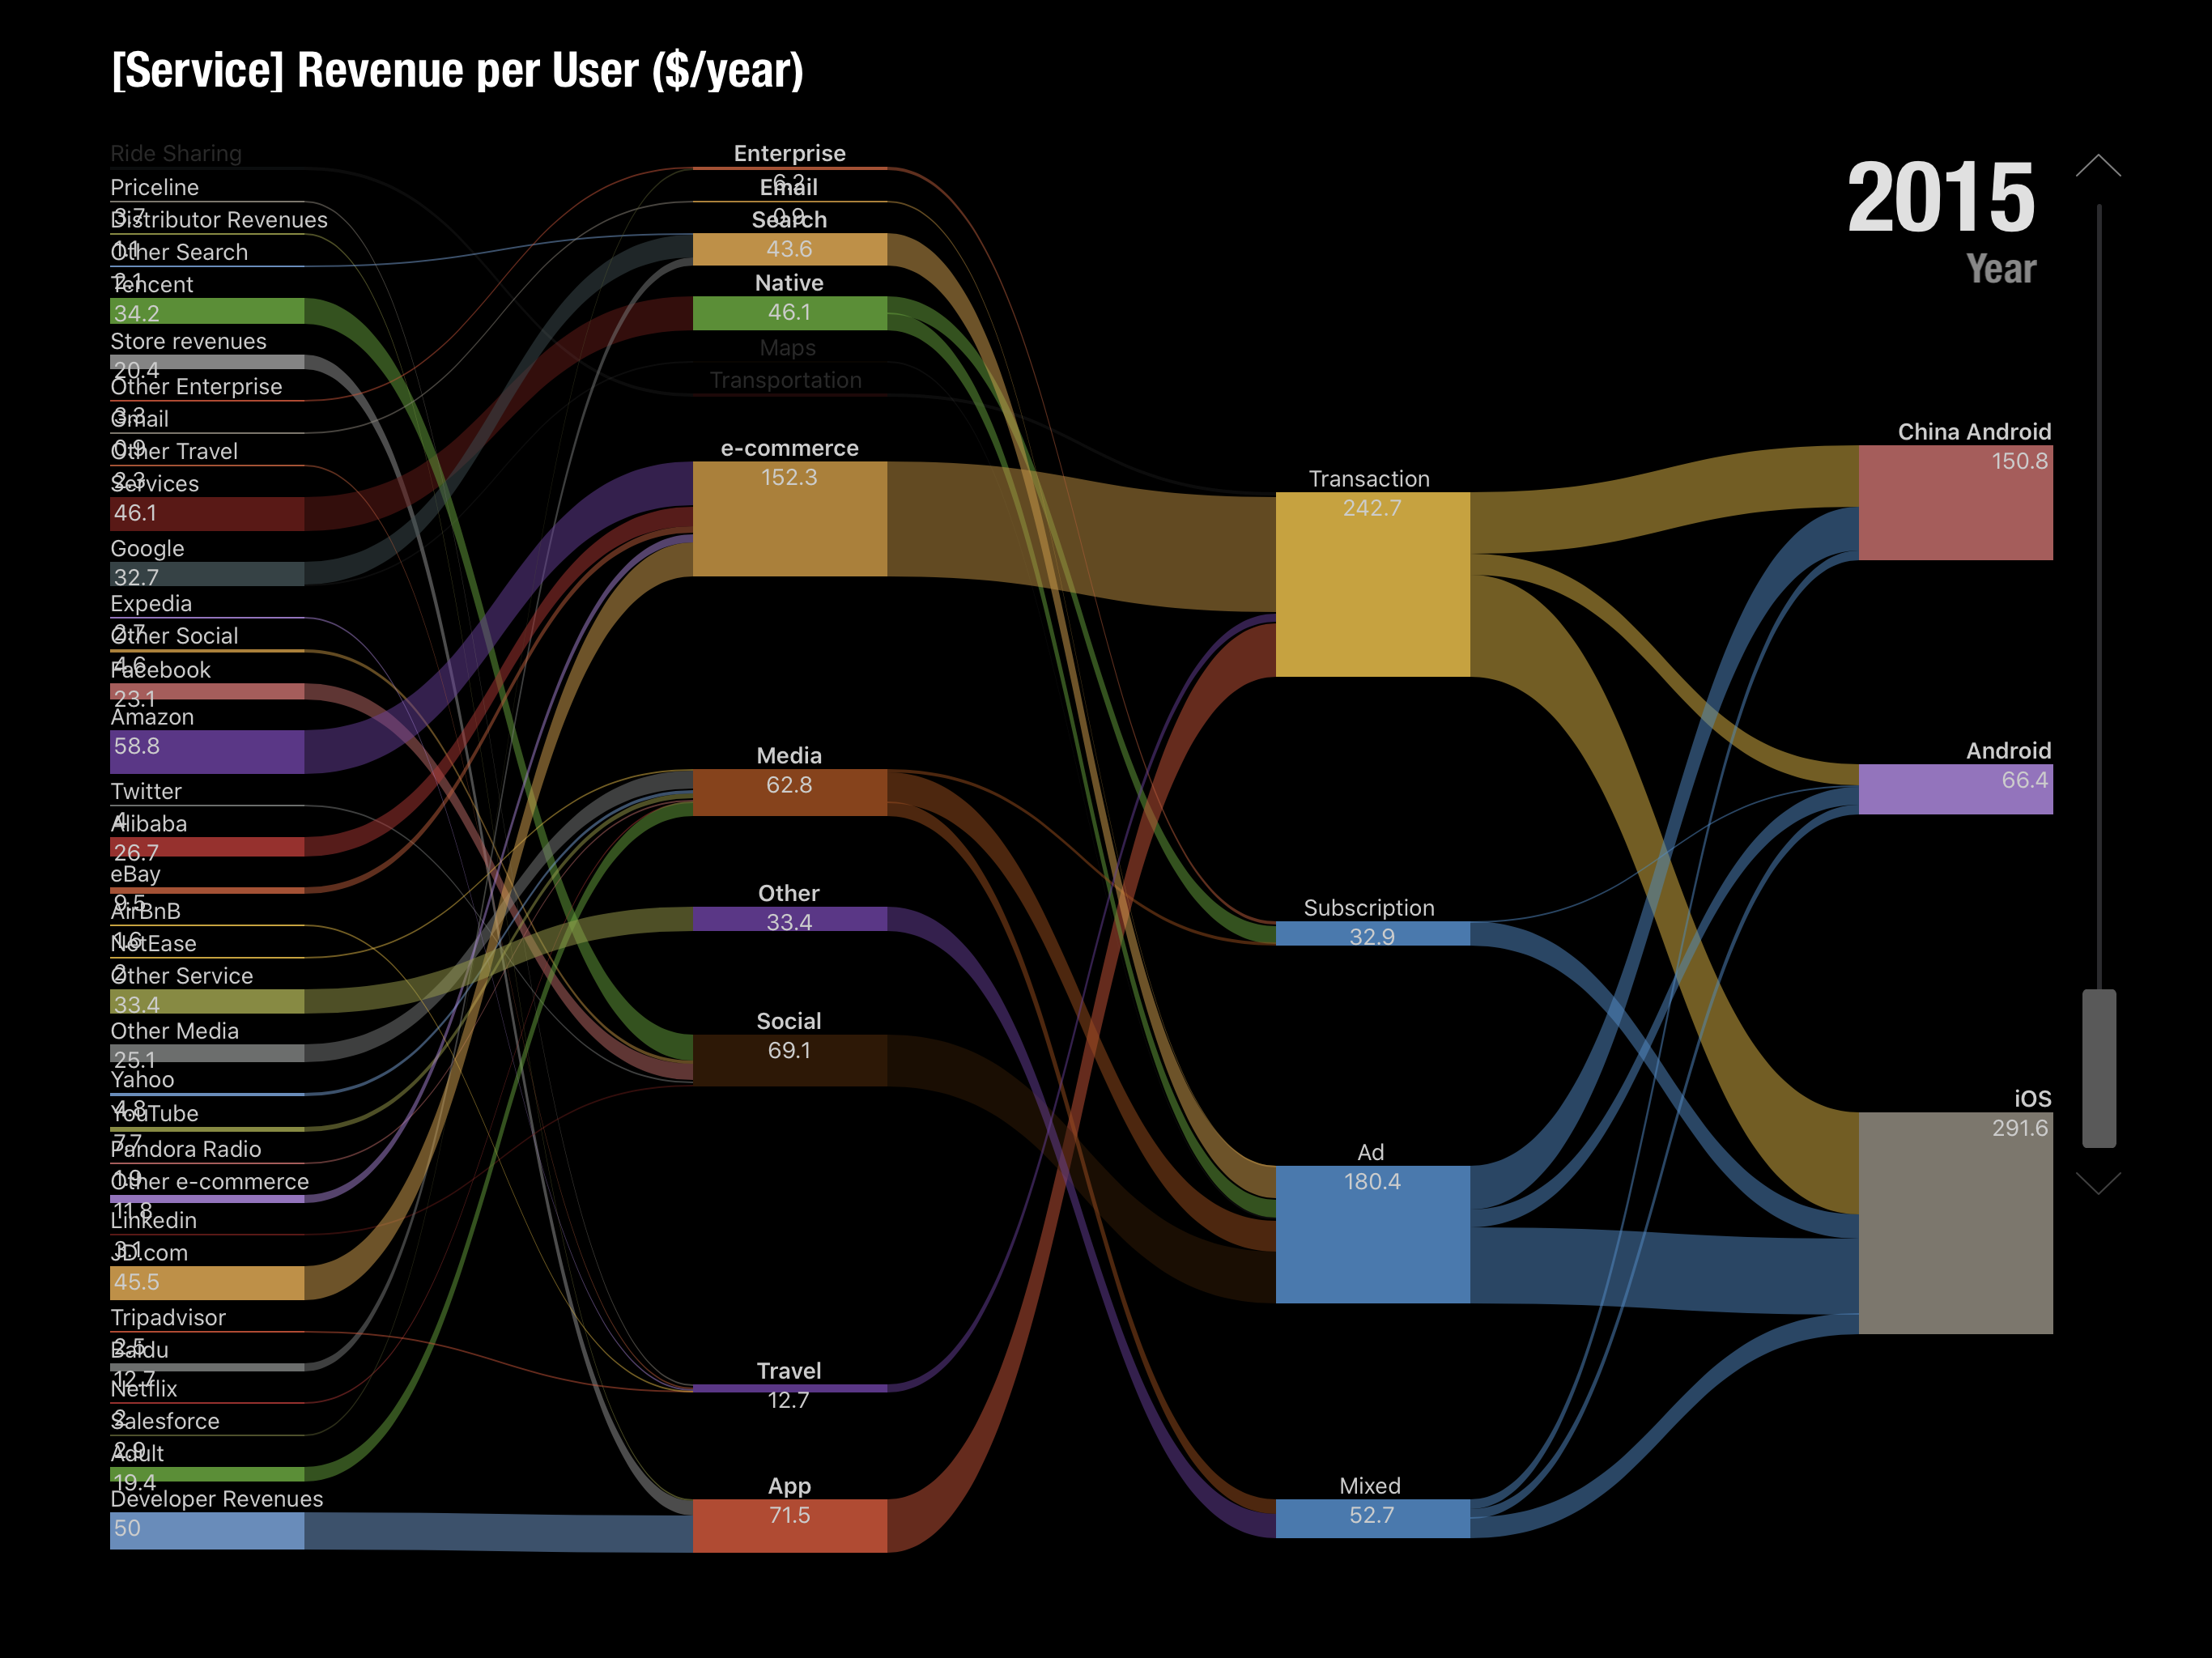
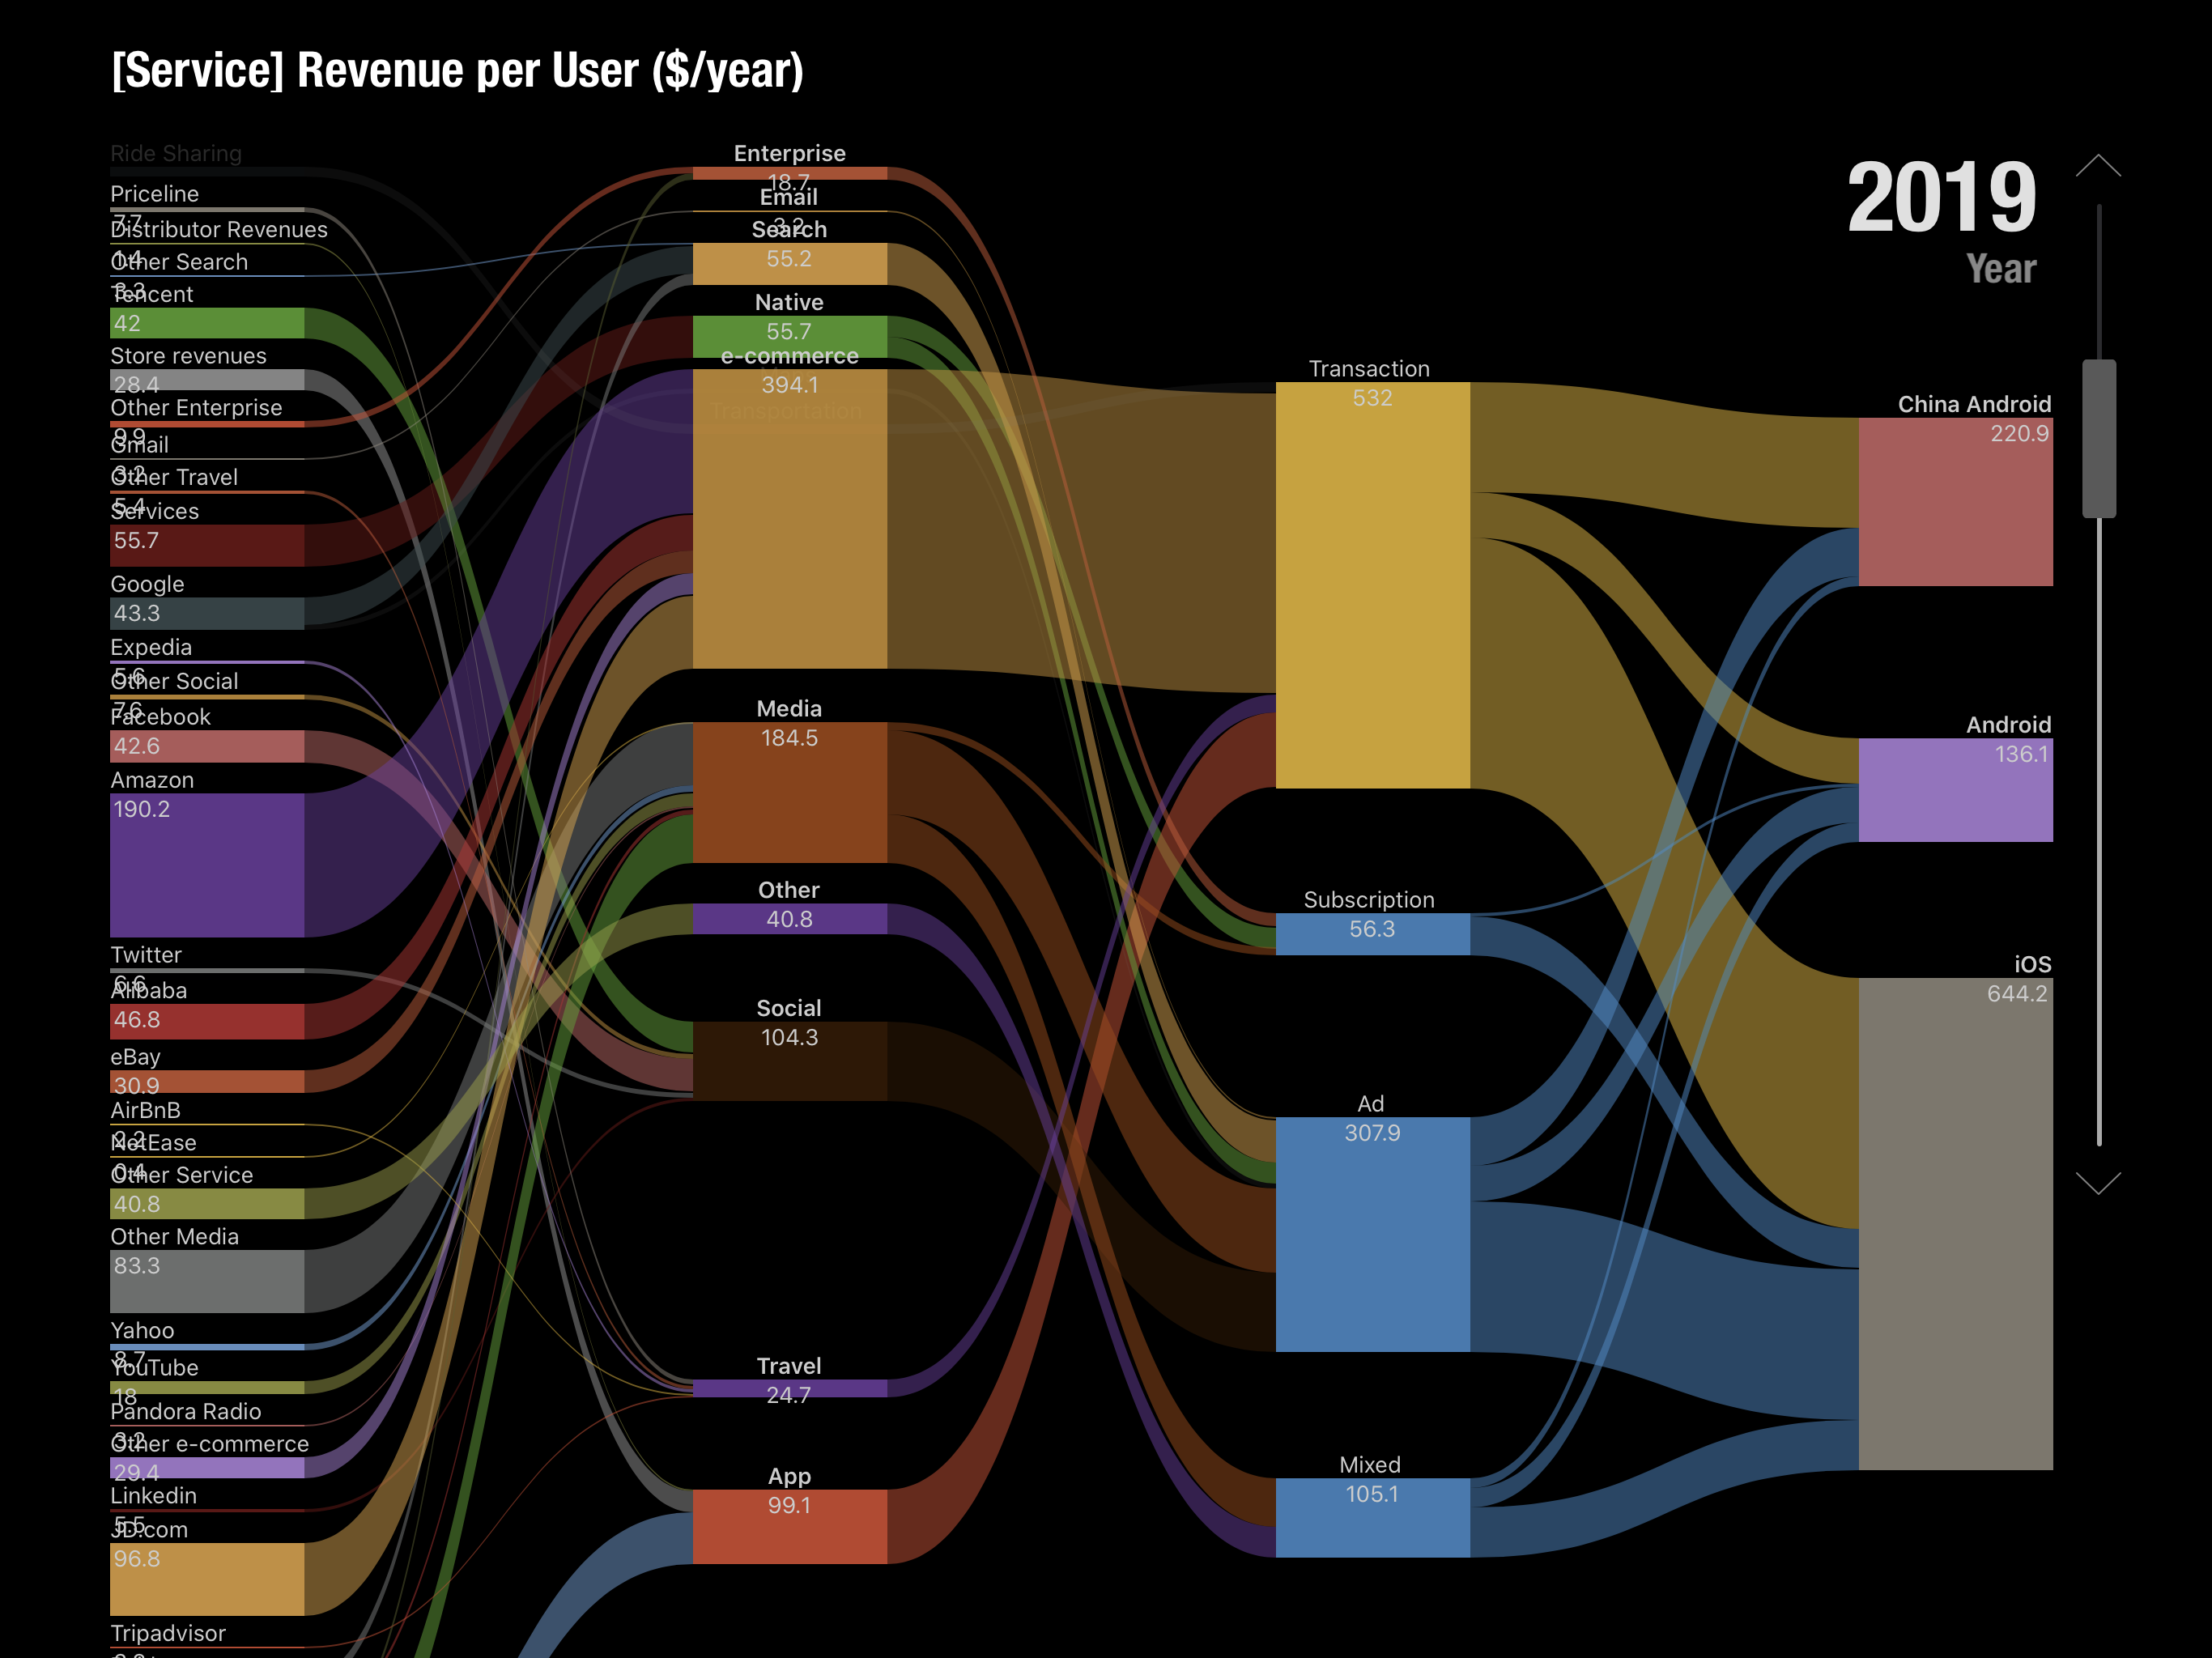
    For the keynote I prepared a model which predicted the mobile ecosystems for iOS, Android and Chinese Android over the next 5 years (to 2020). The methodology involved taking a measurement of the revenues of the top internet service companies, building up the categories these companies occupied, estimating how much of those revenues are through mobile distribution and then splitting the result among the three platforms of iOS and the two Androids.

    Adding to that the "native" app and content revenues for each platform would yield the Ecosystem total value. Applying a growth rate would offer some visibility into the future.

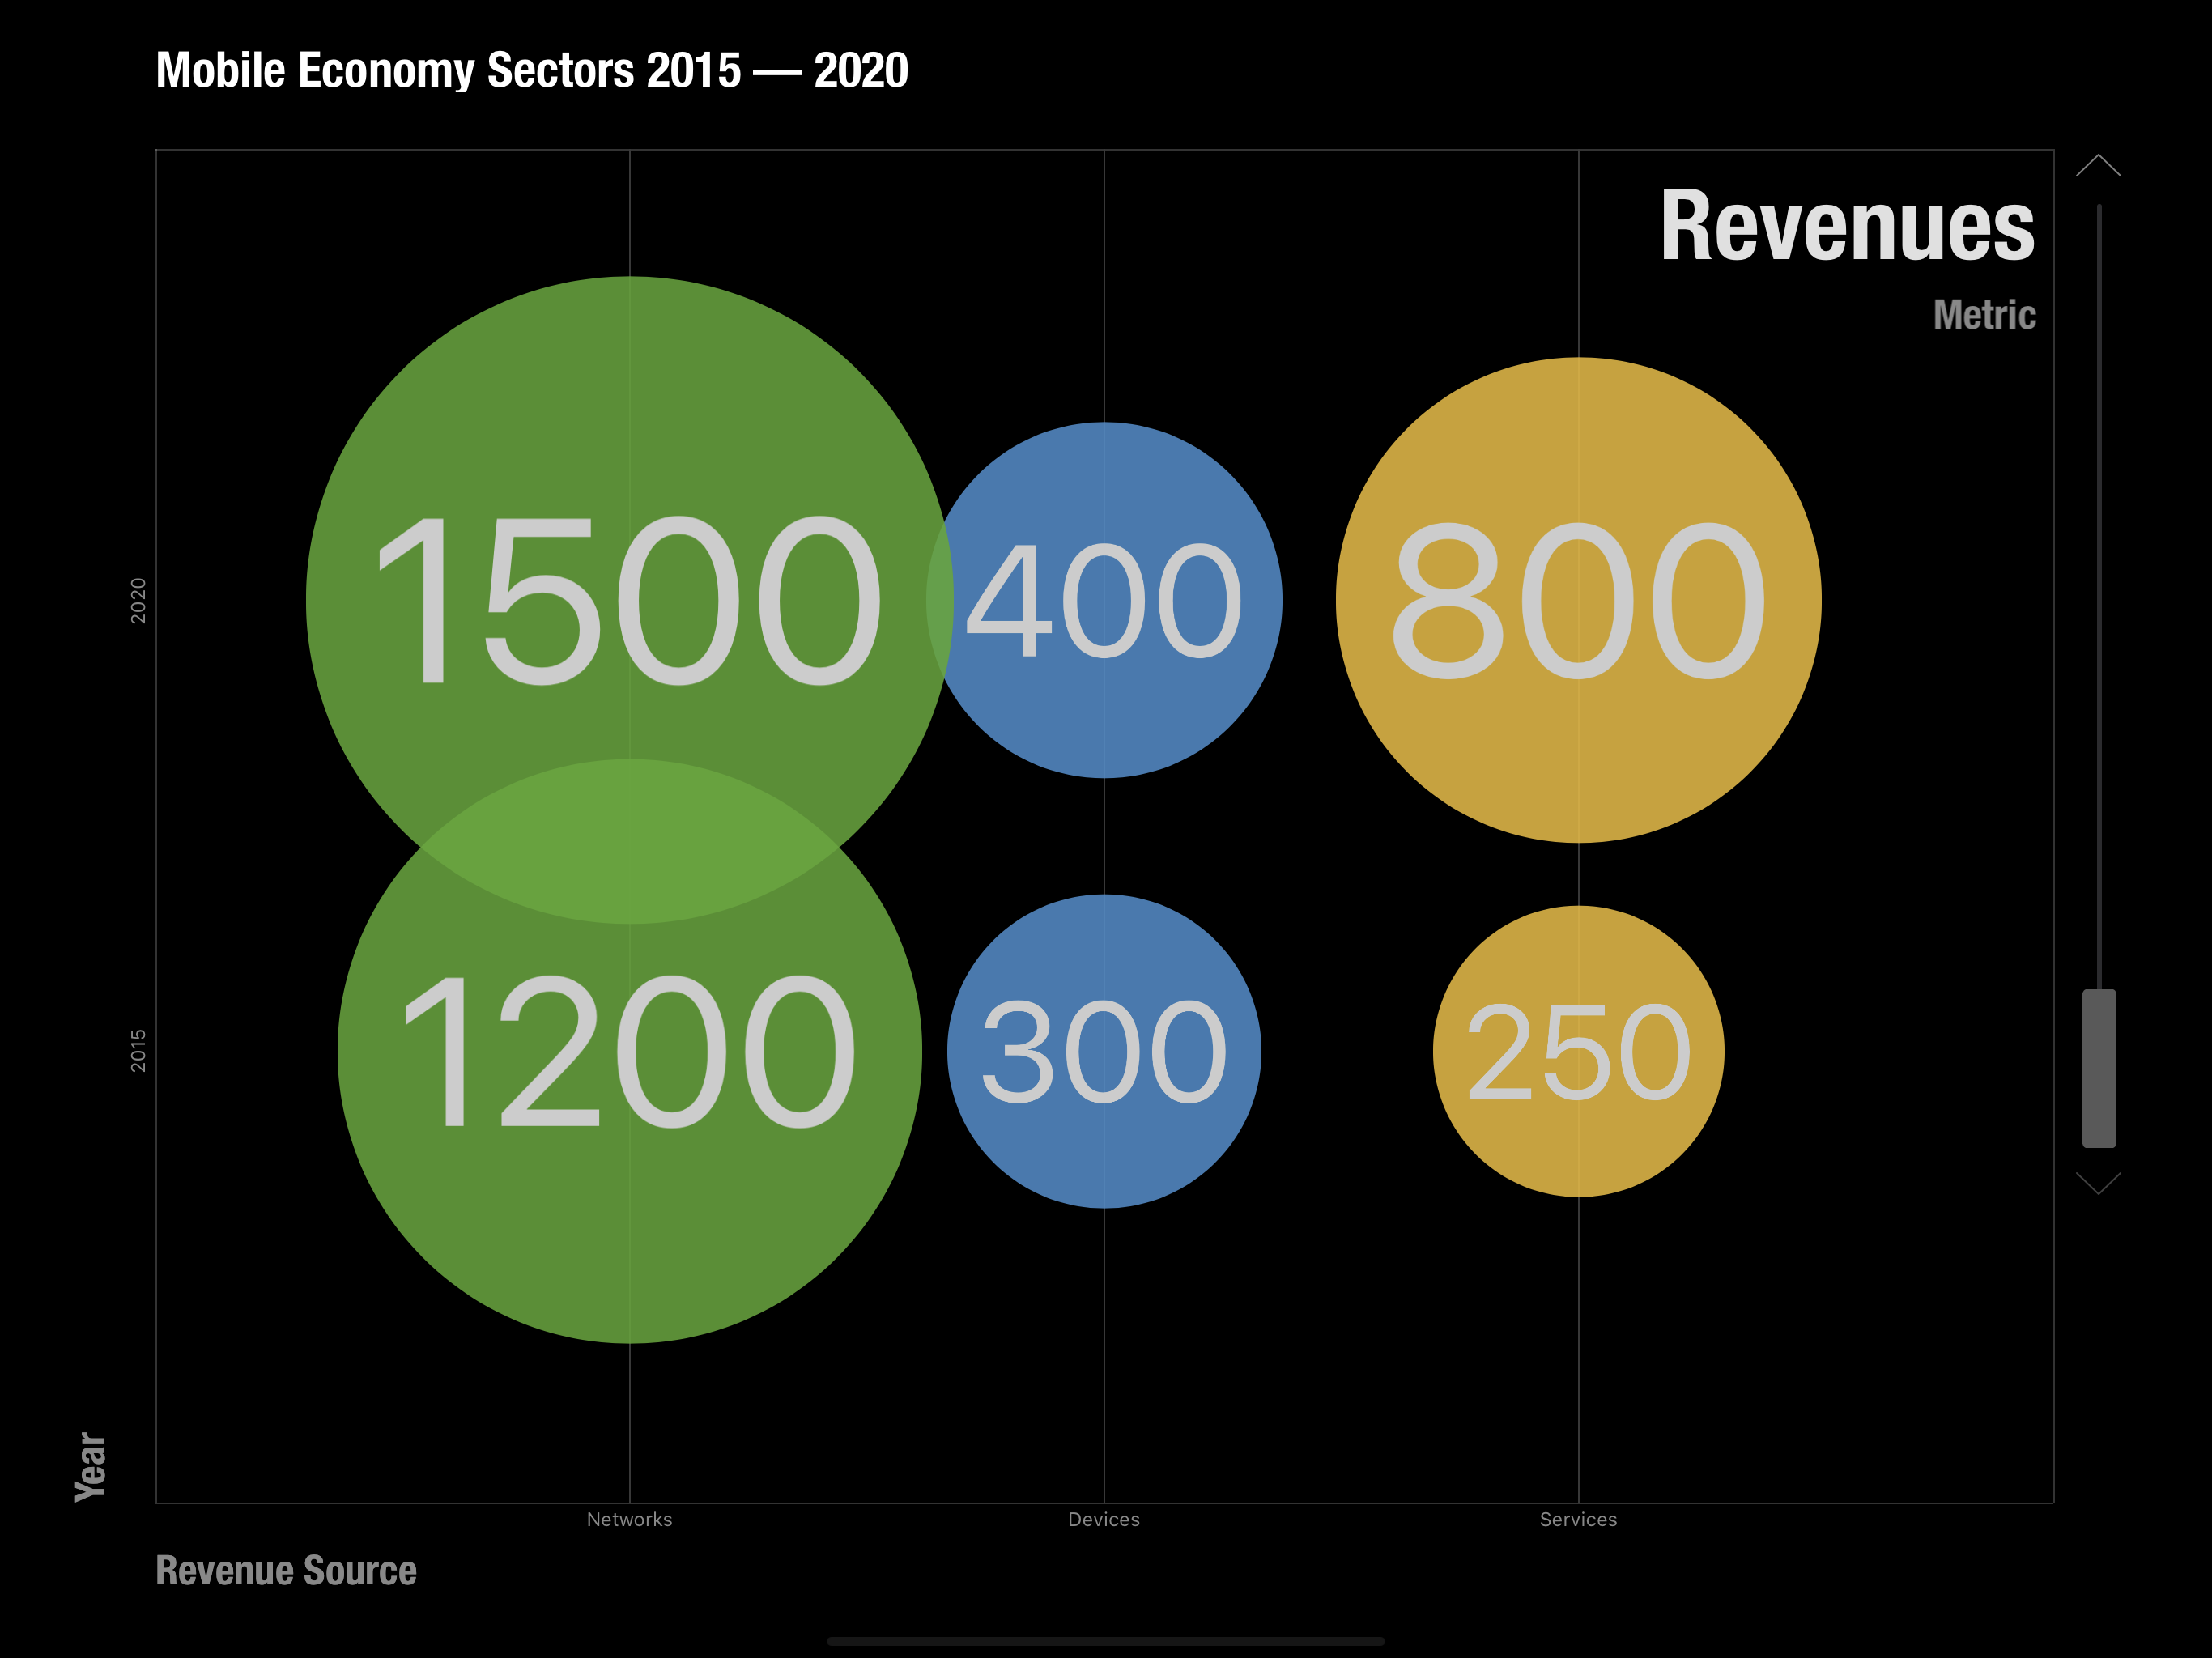
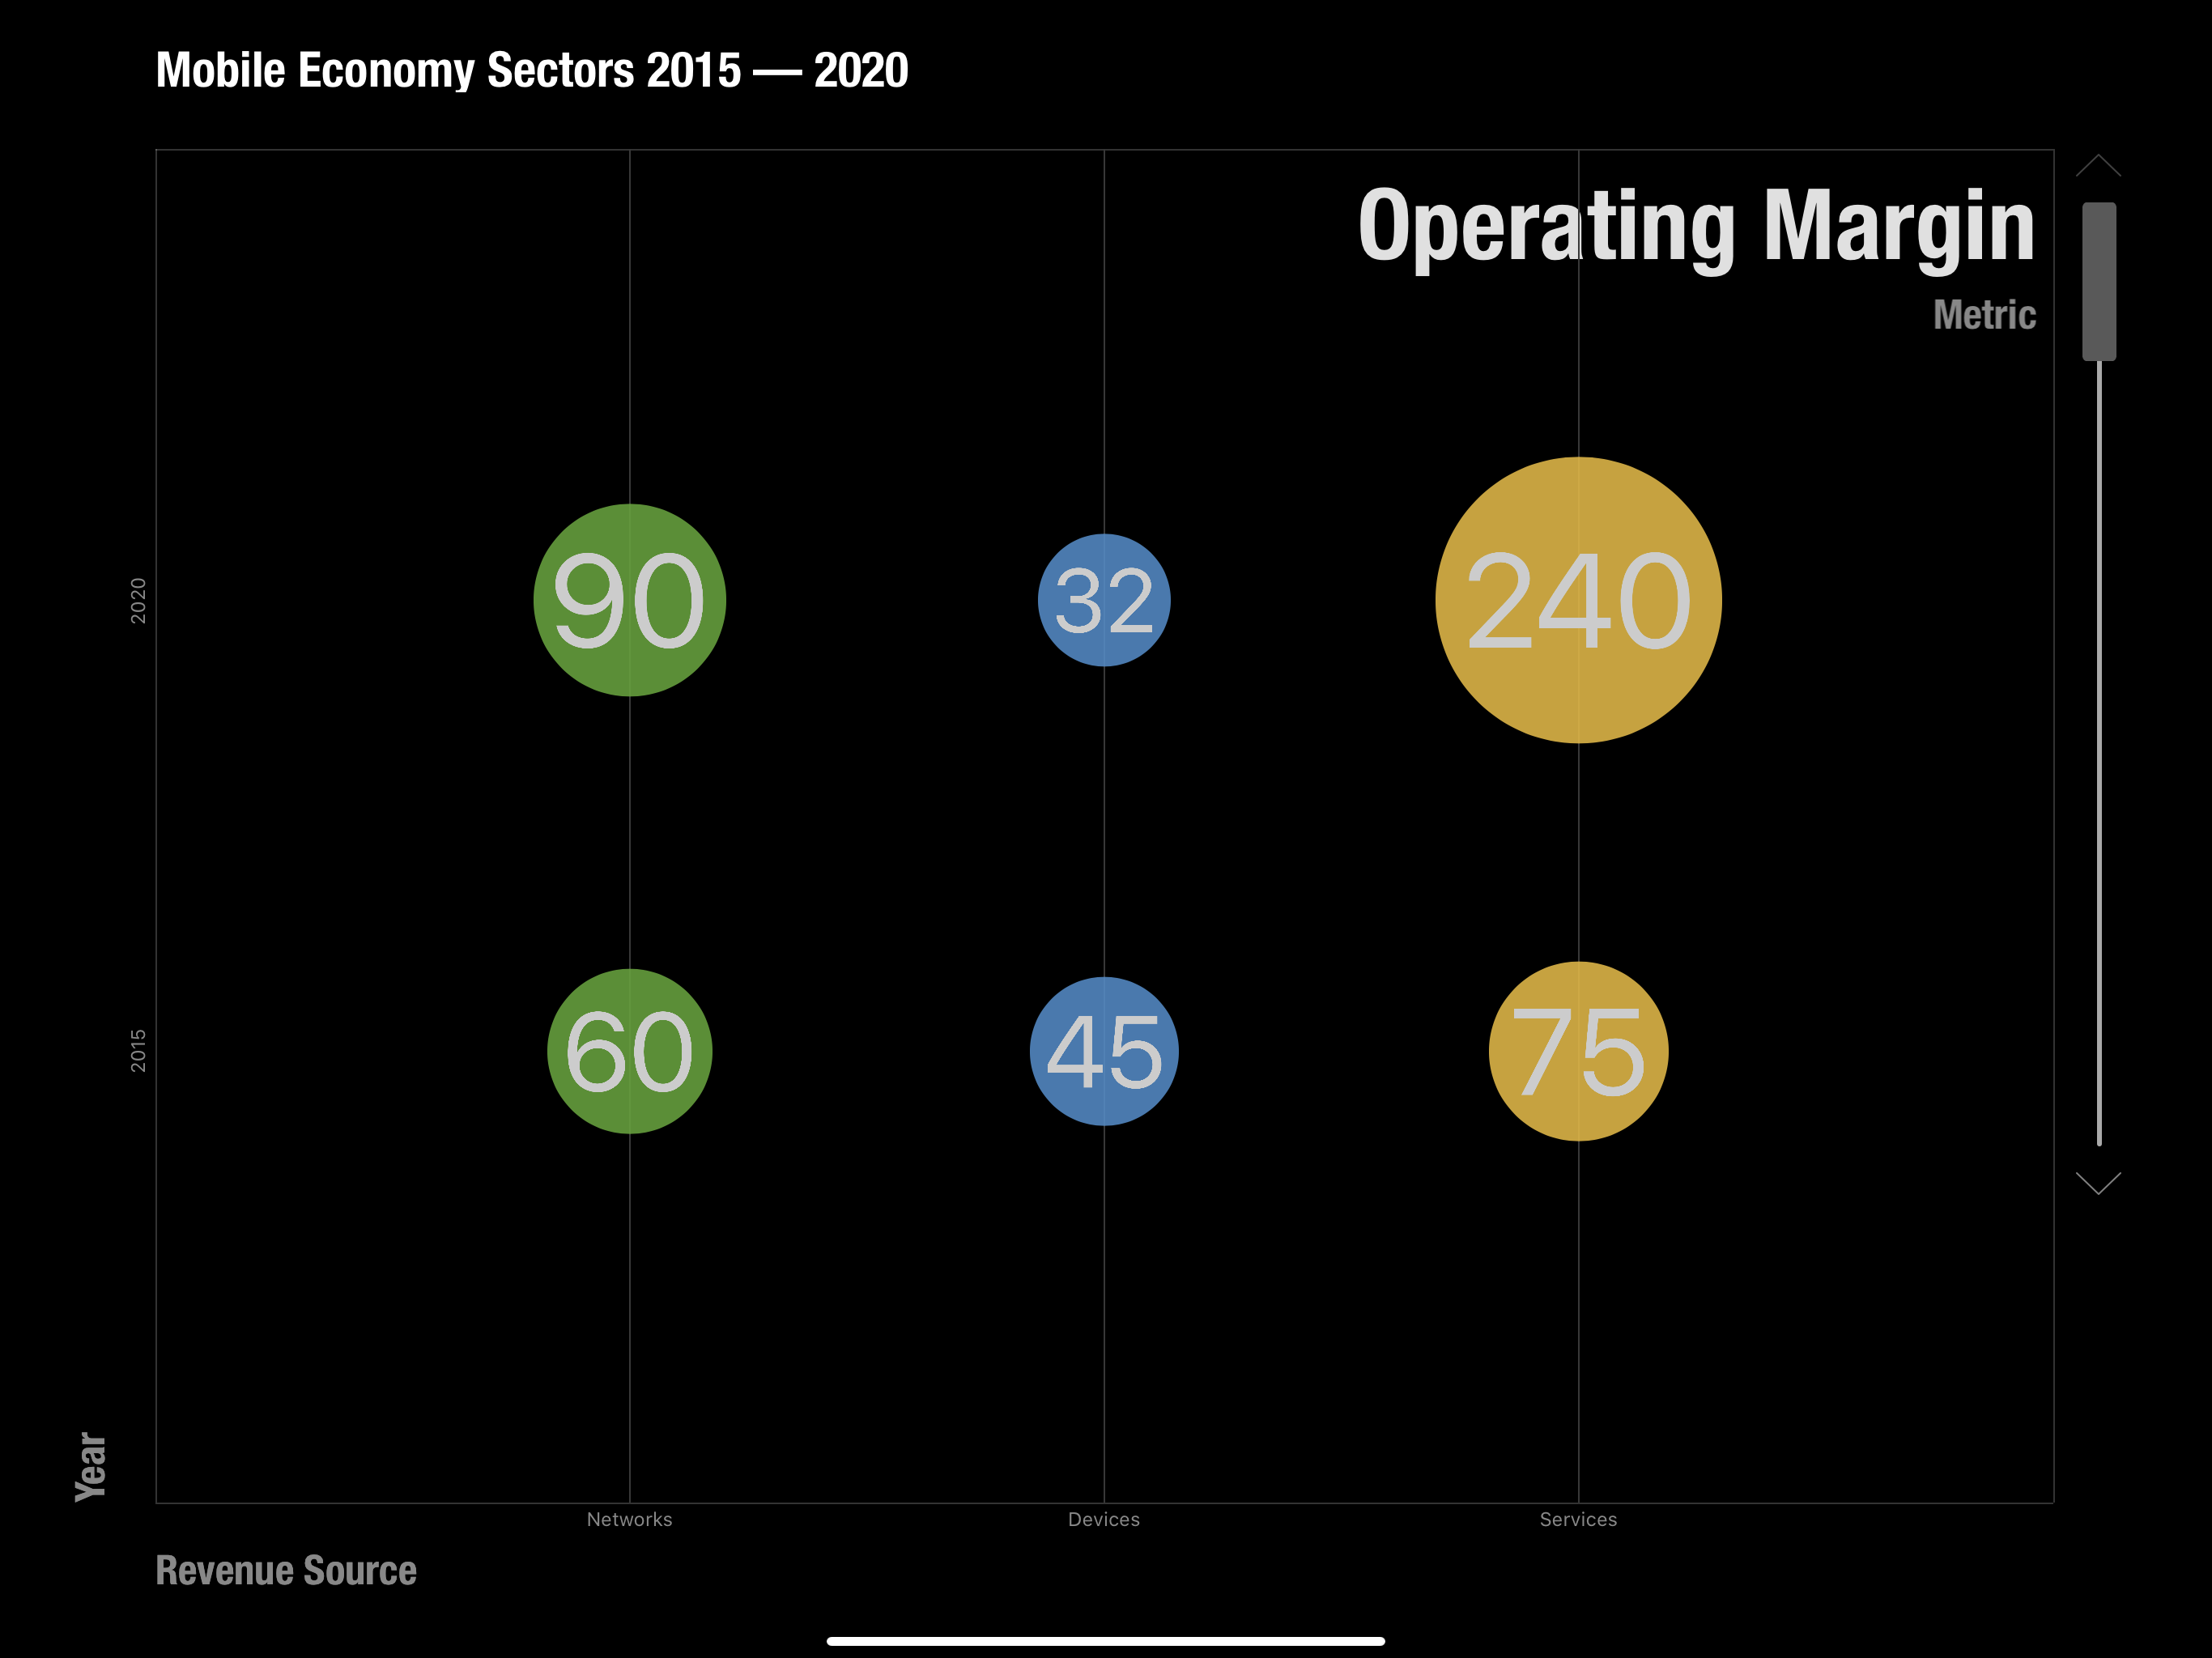
    The following images are screen captures of the Perspective presentation.

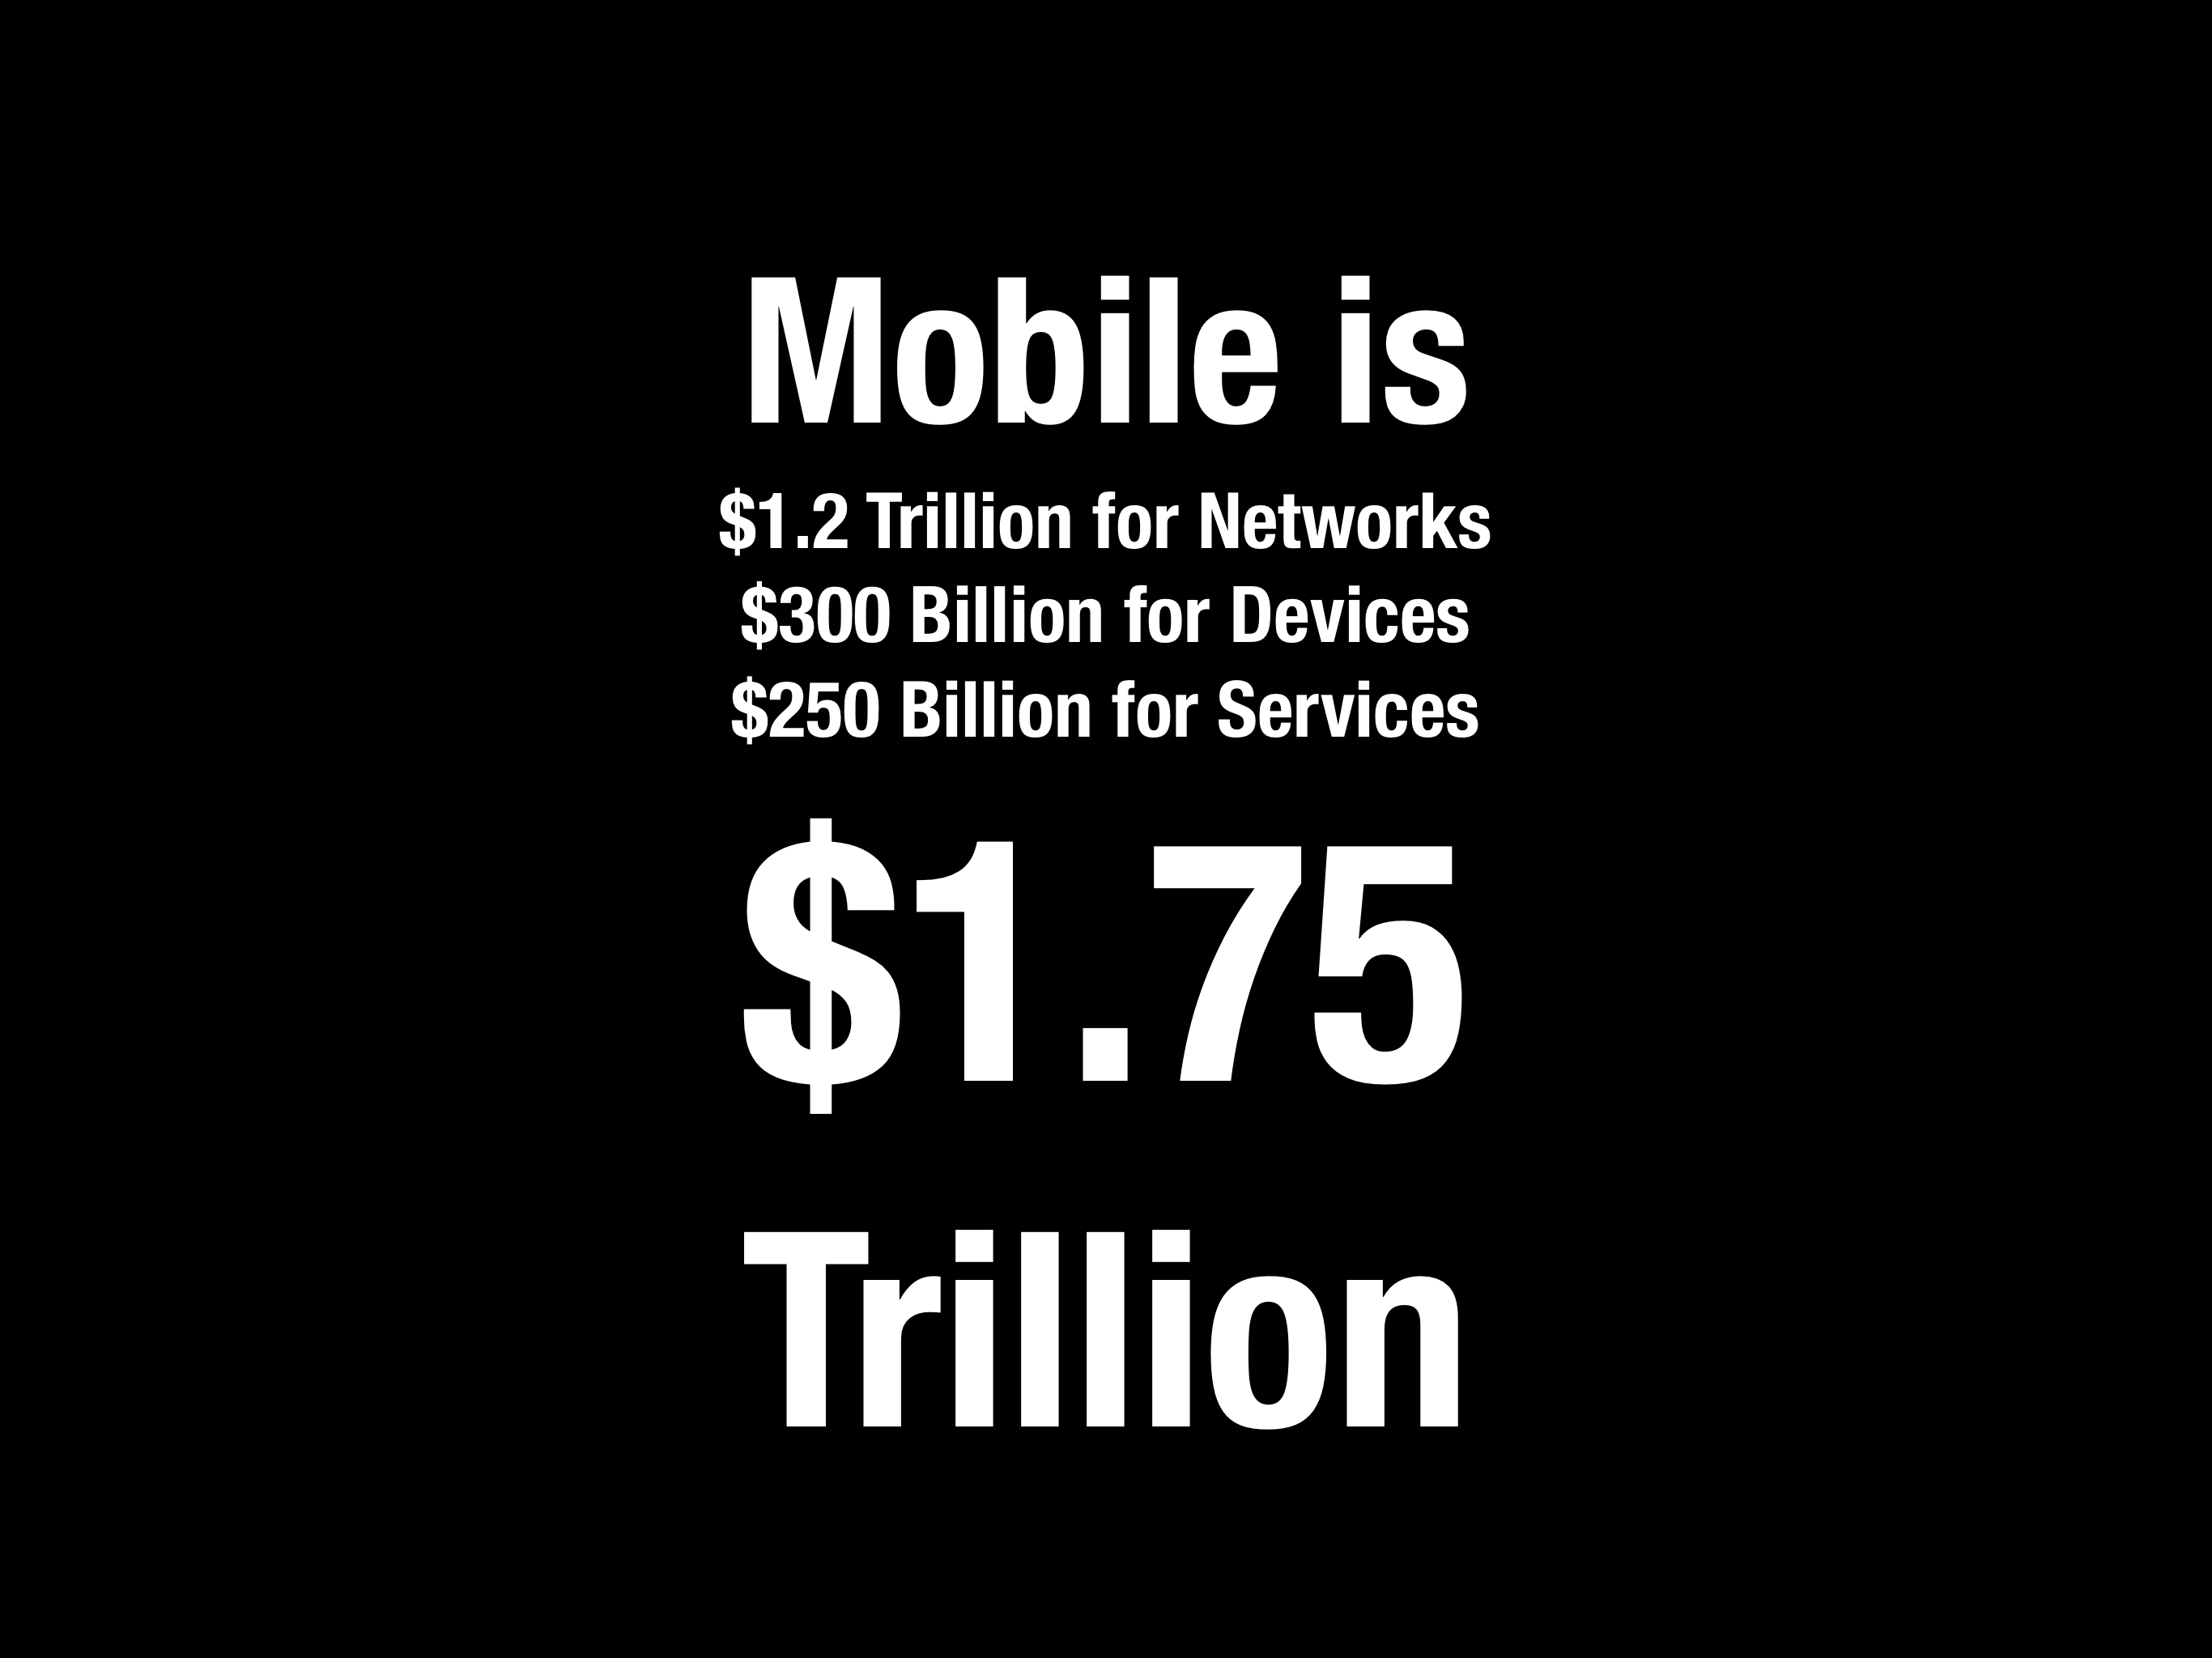
    Revenues across Networks, Devices and Services 2015 to 2020 (estimated March 2016)
    Operating Income across Networks, Devices and Services 2015 to 2020 (estimated March 2016)
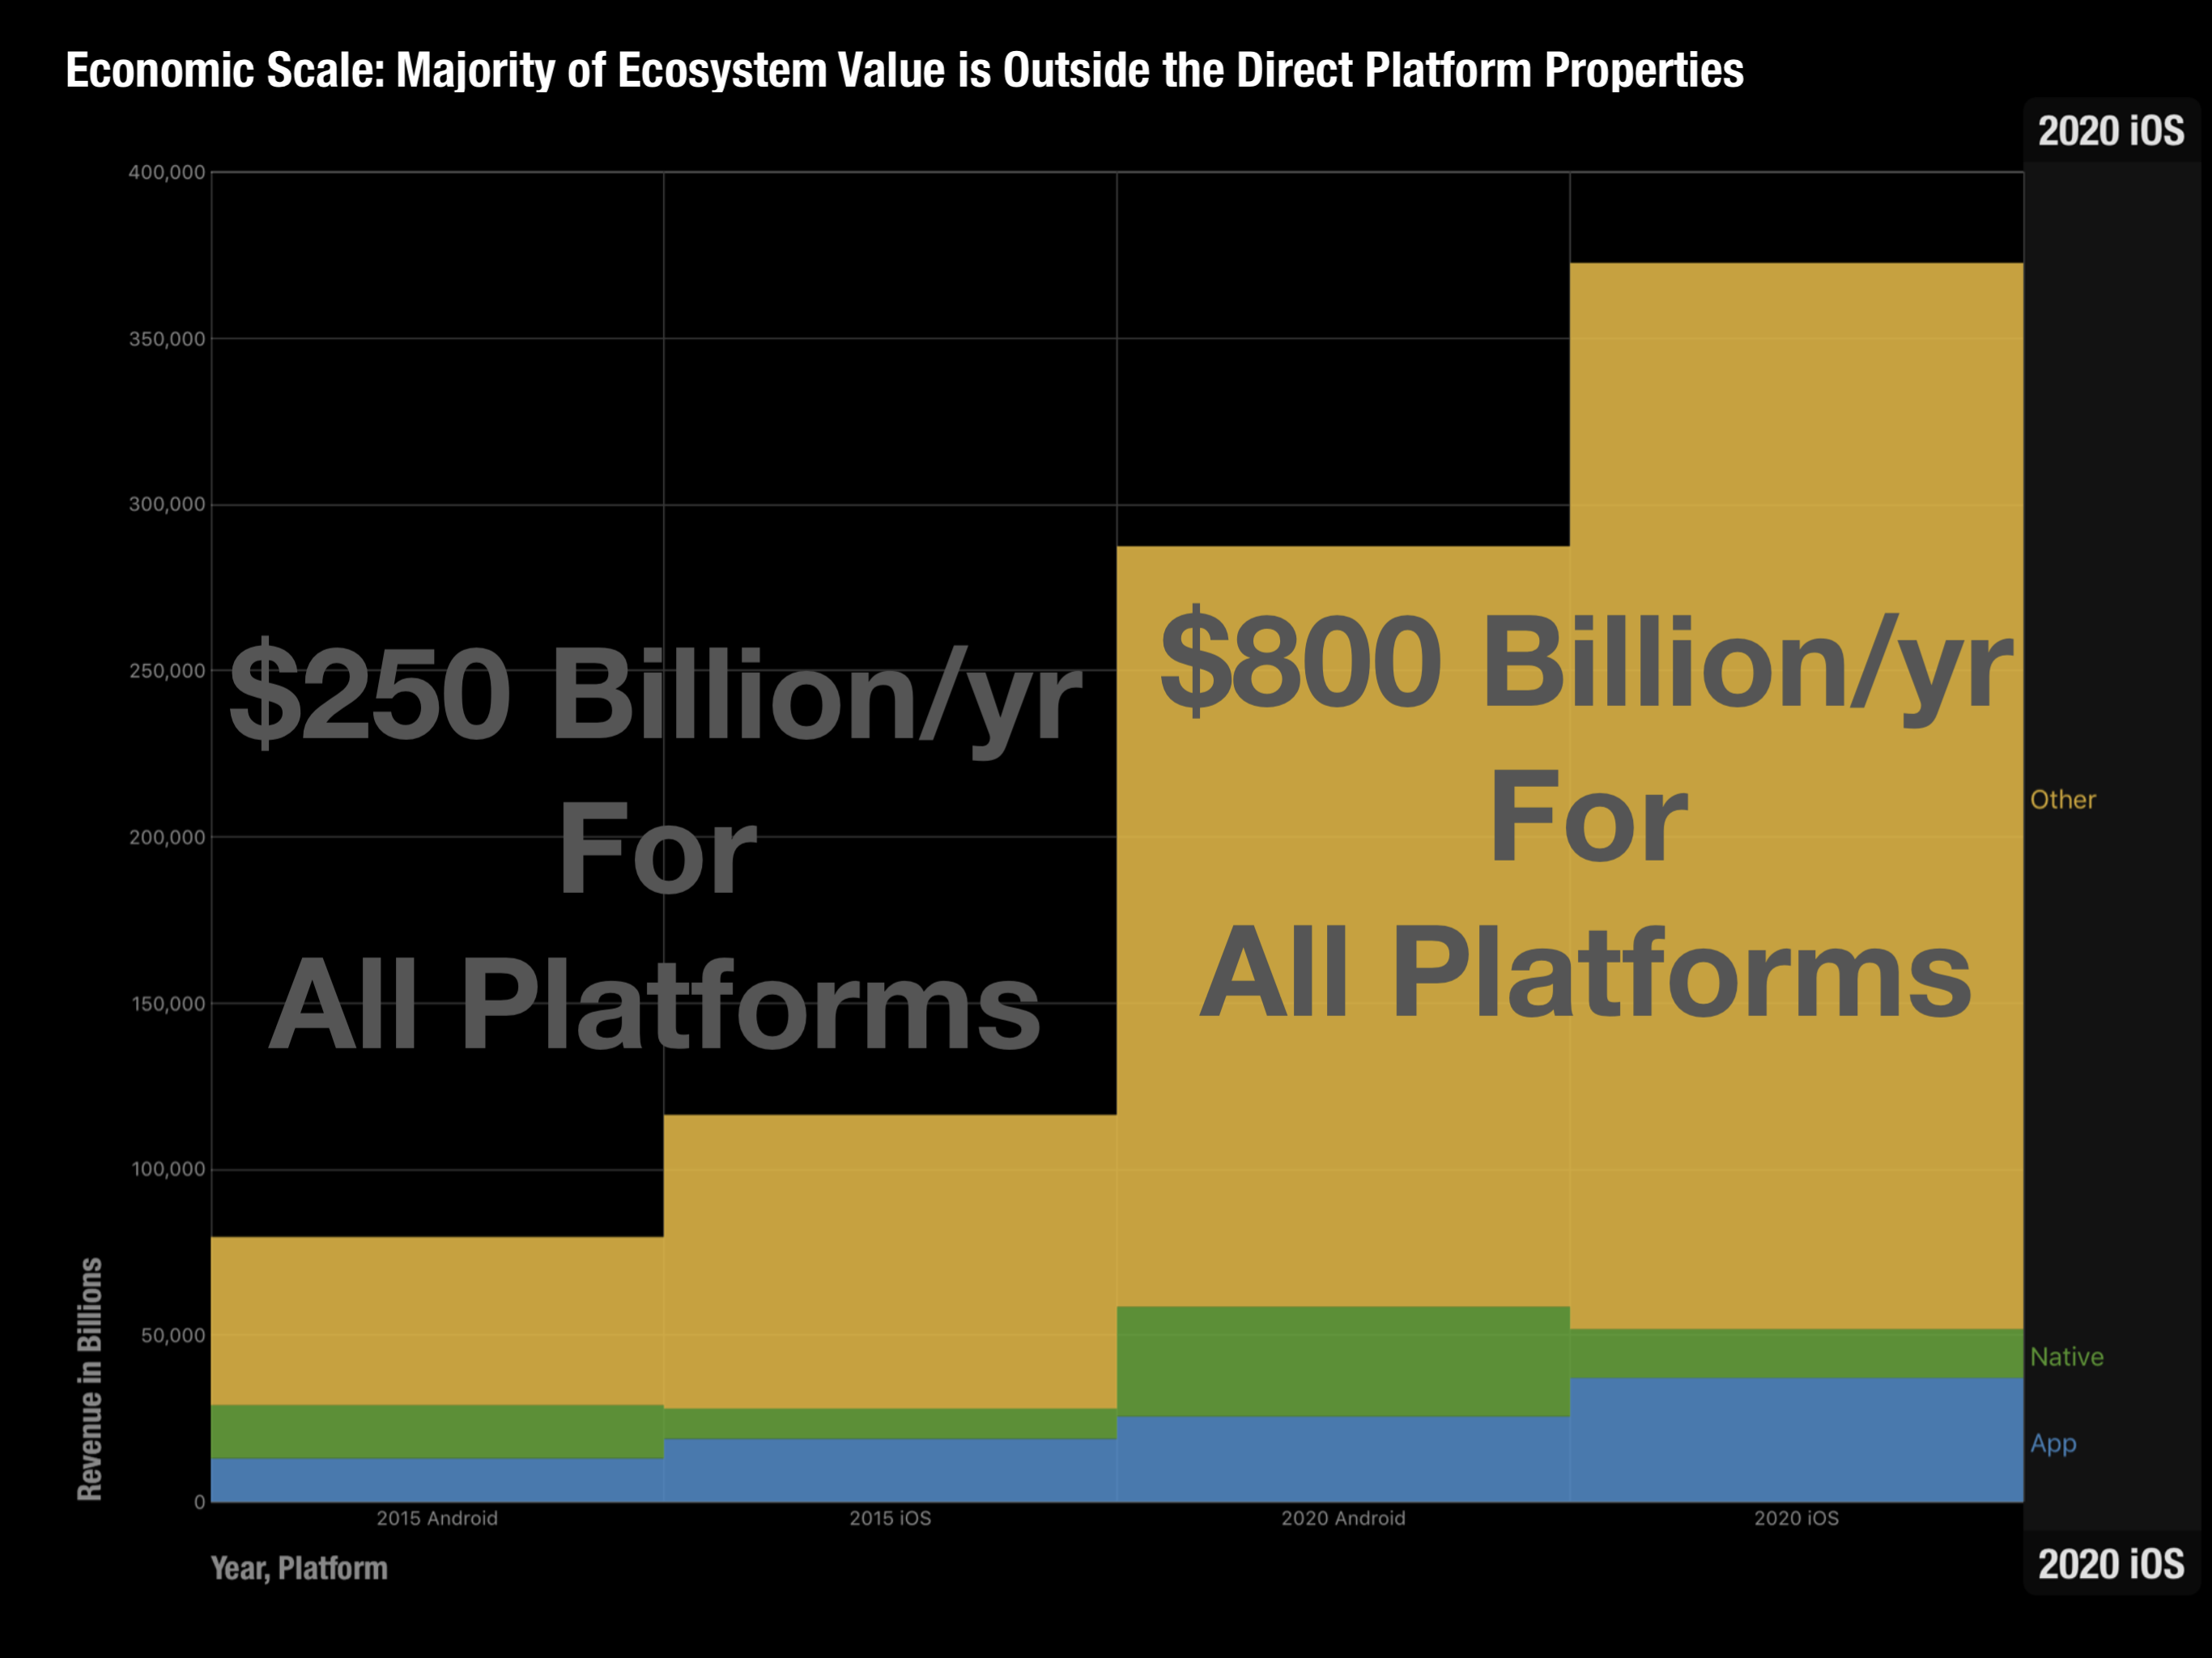
    Ecosystem composition (Third Party App, Native Apps, Other) 2015 to 2020, Android vs. iOS.
    Estimated mobile ecosystems total value by 2020 estimated in 2016.
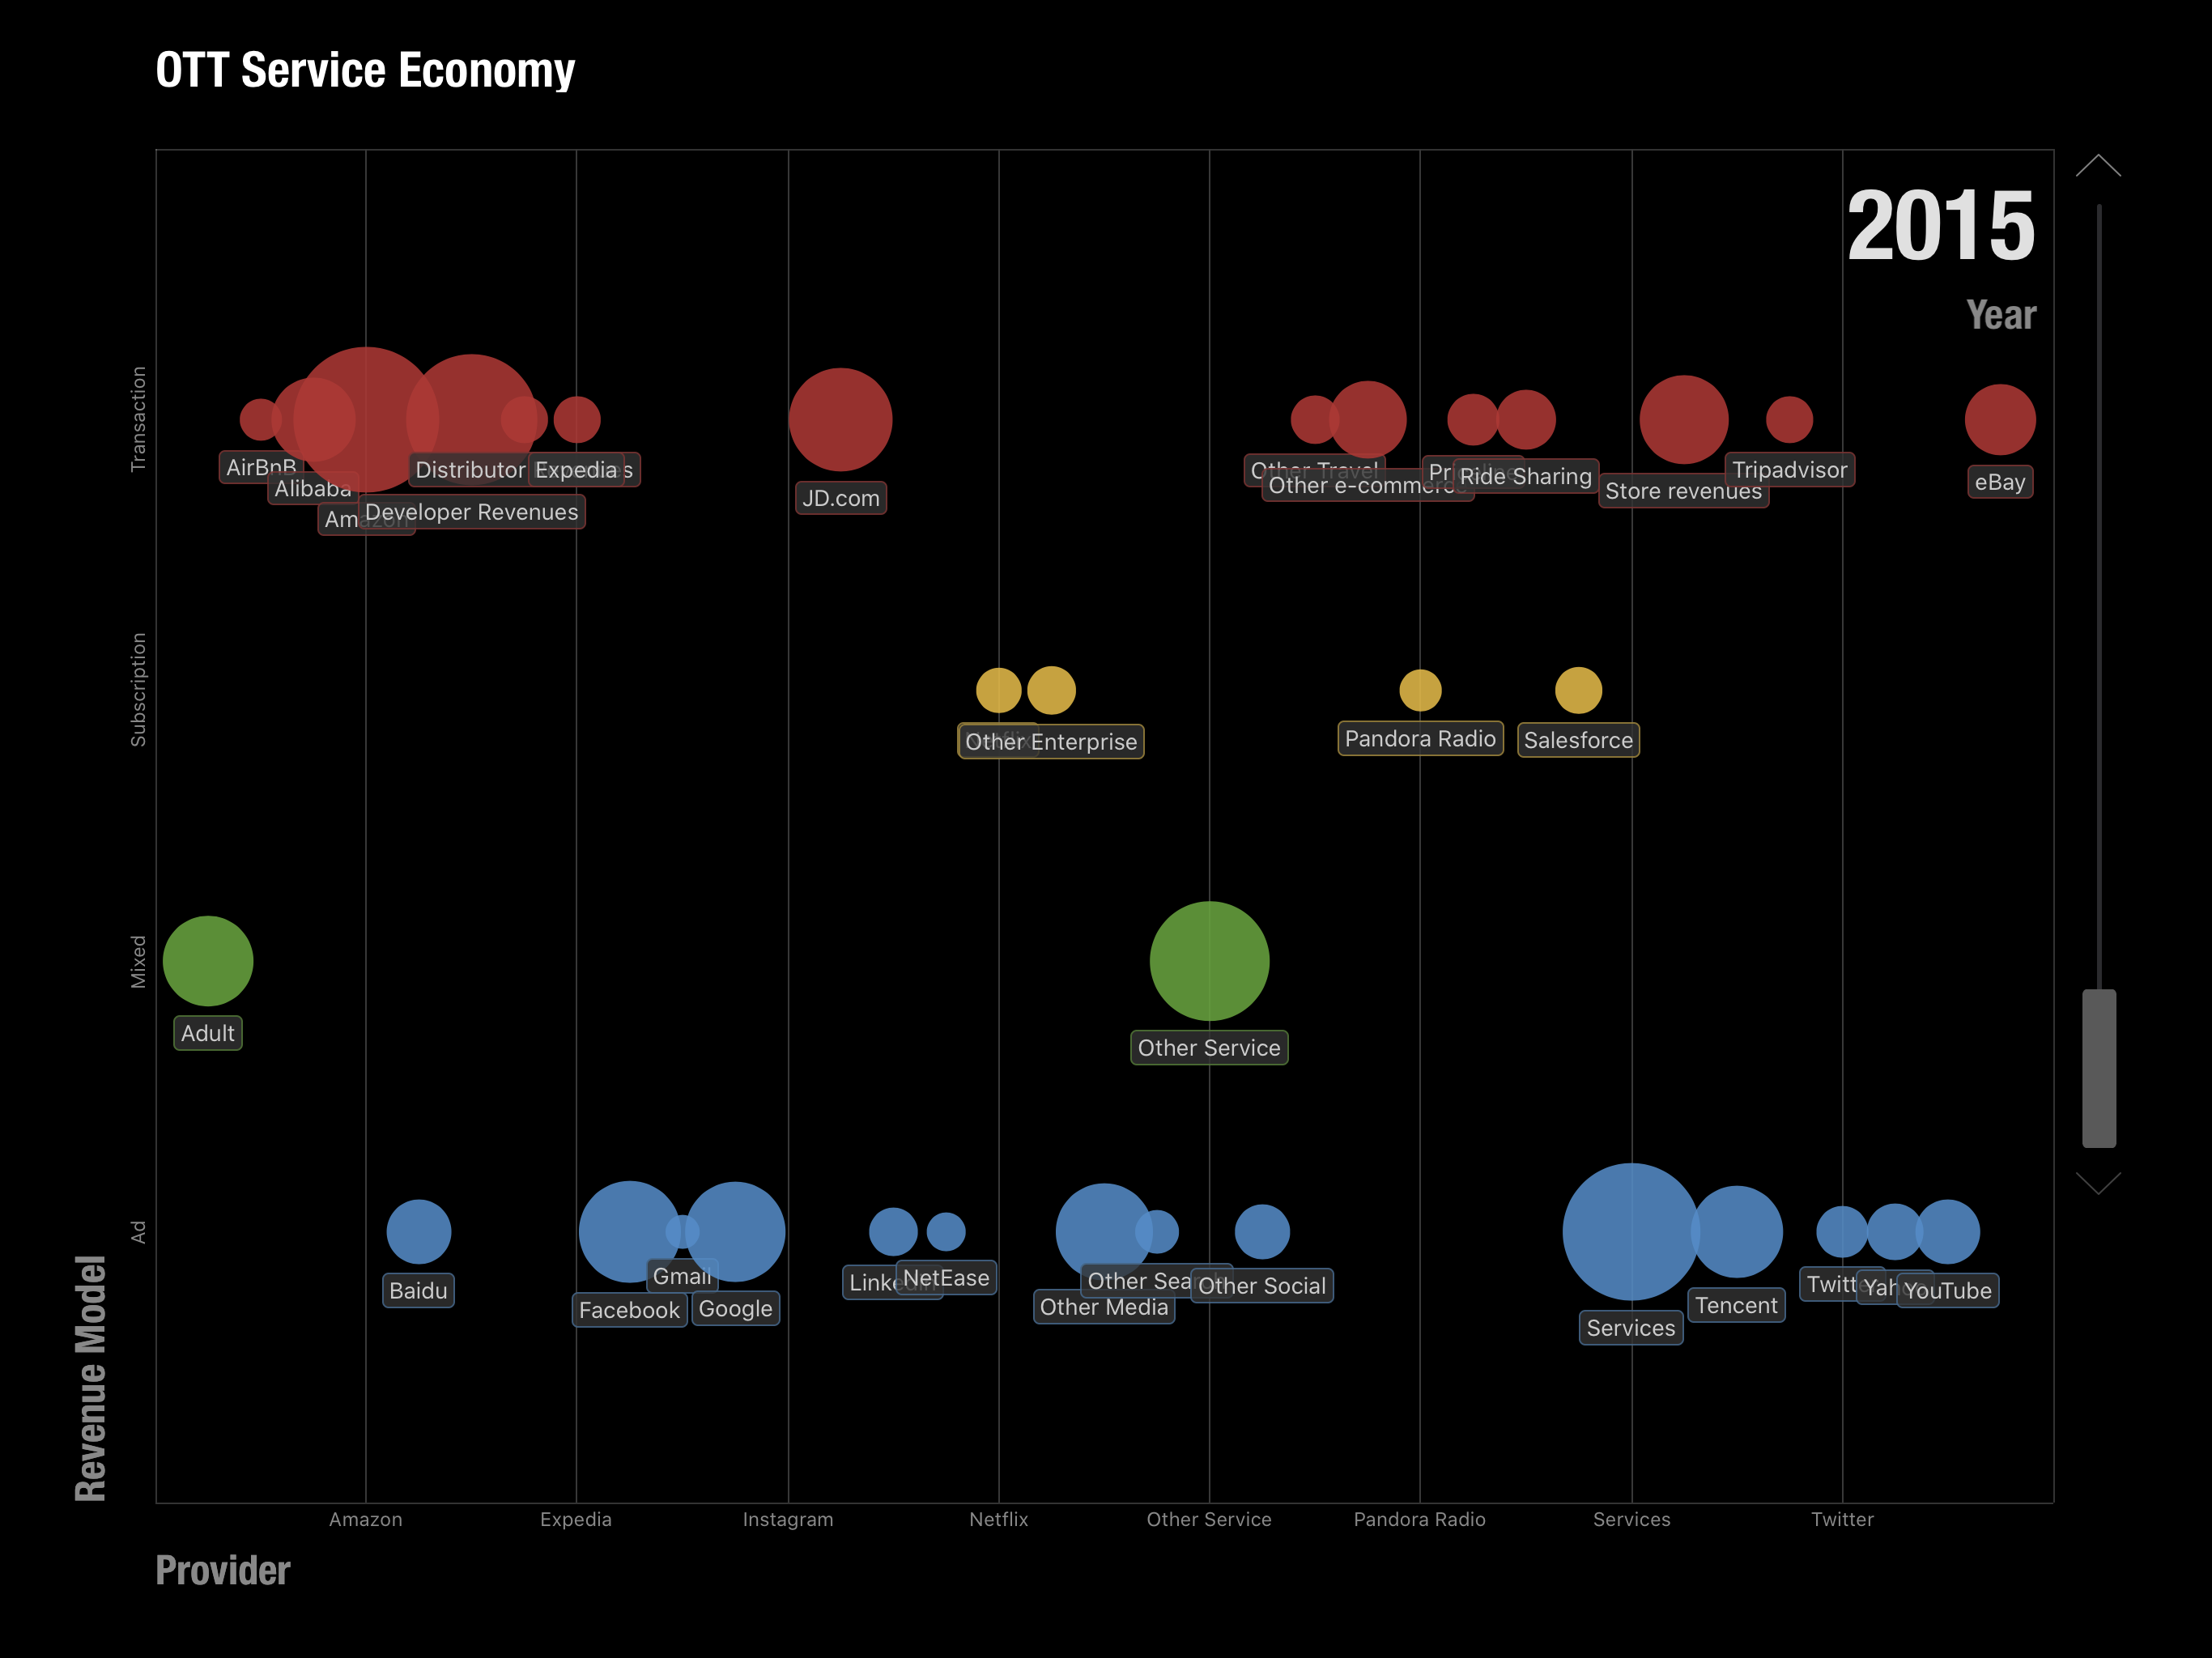
    Over the top (OTT) service components by revenue model in 2015 estimated in 2016.
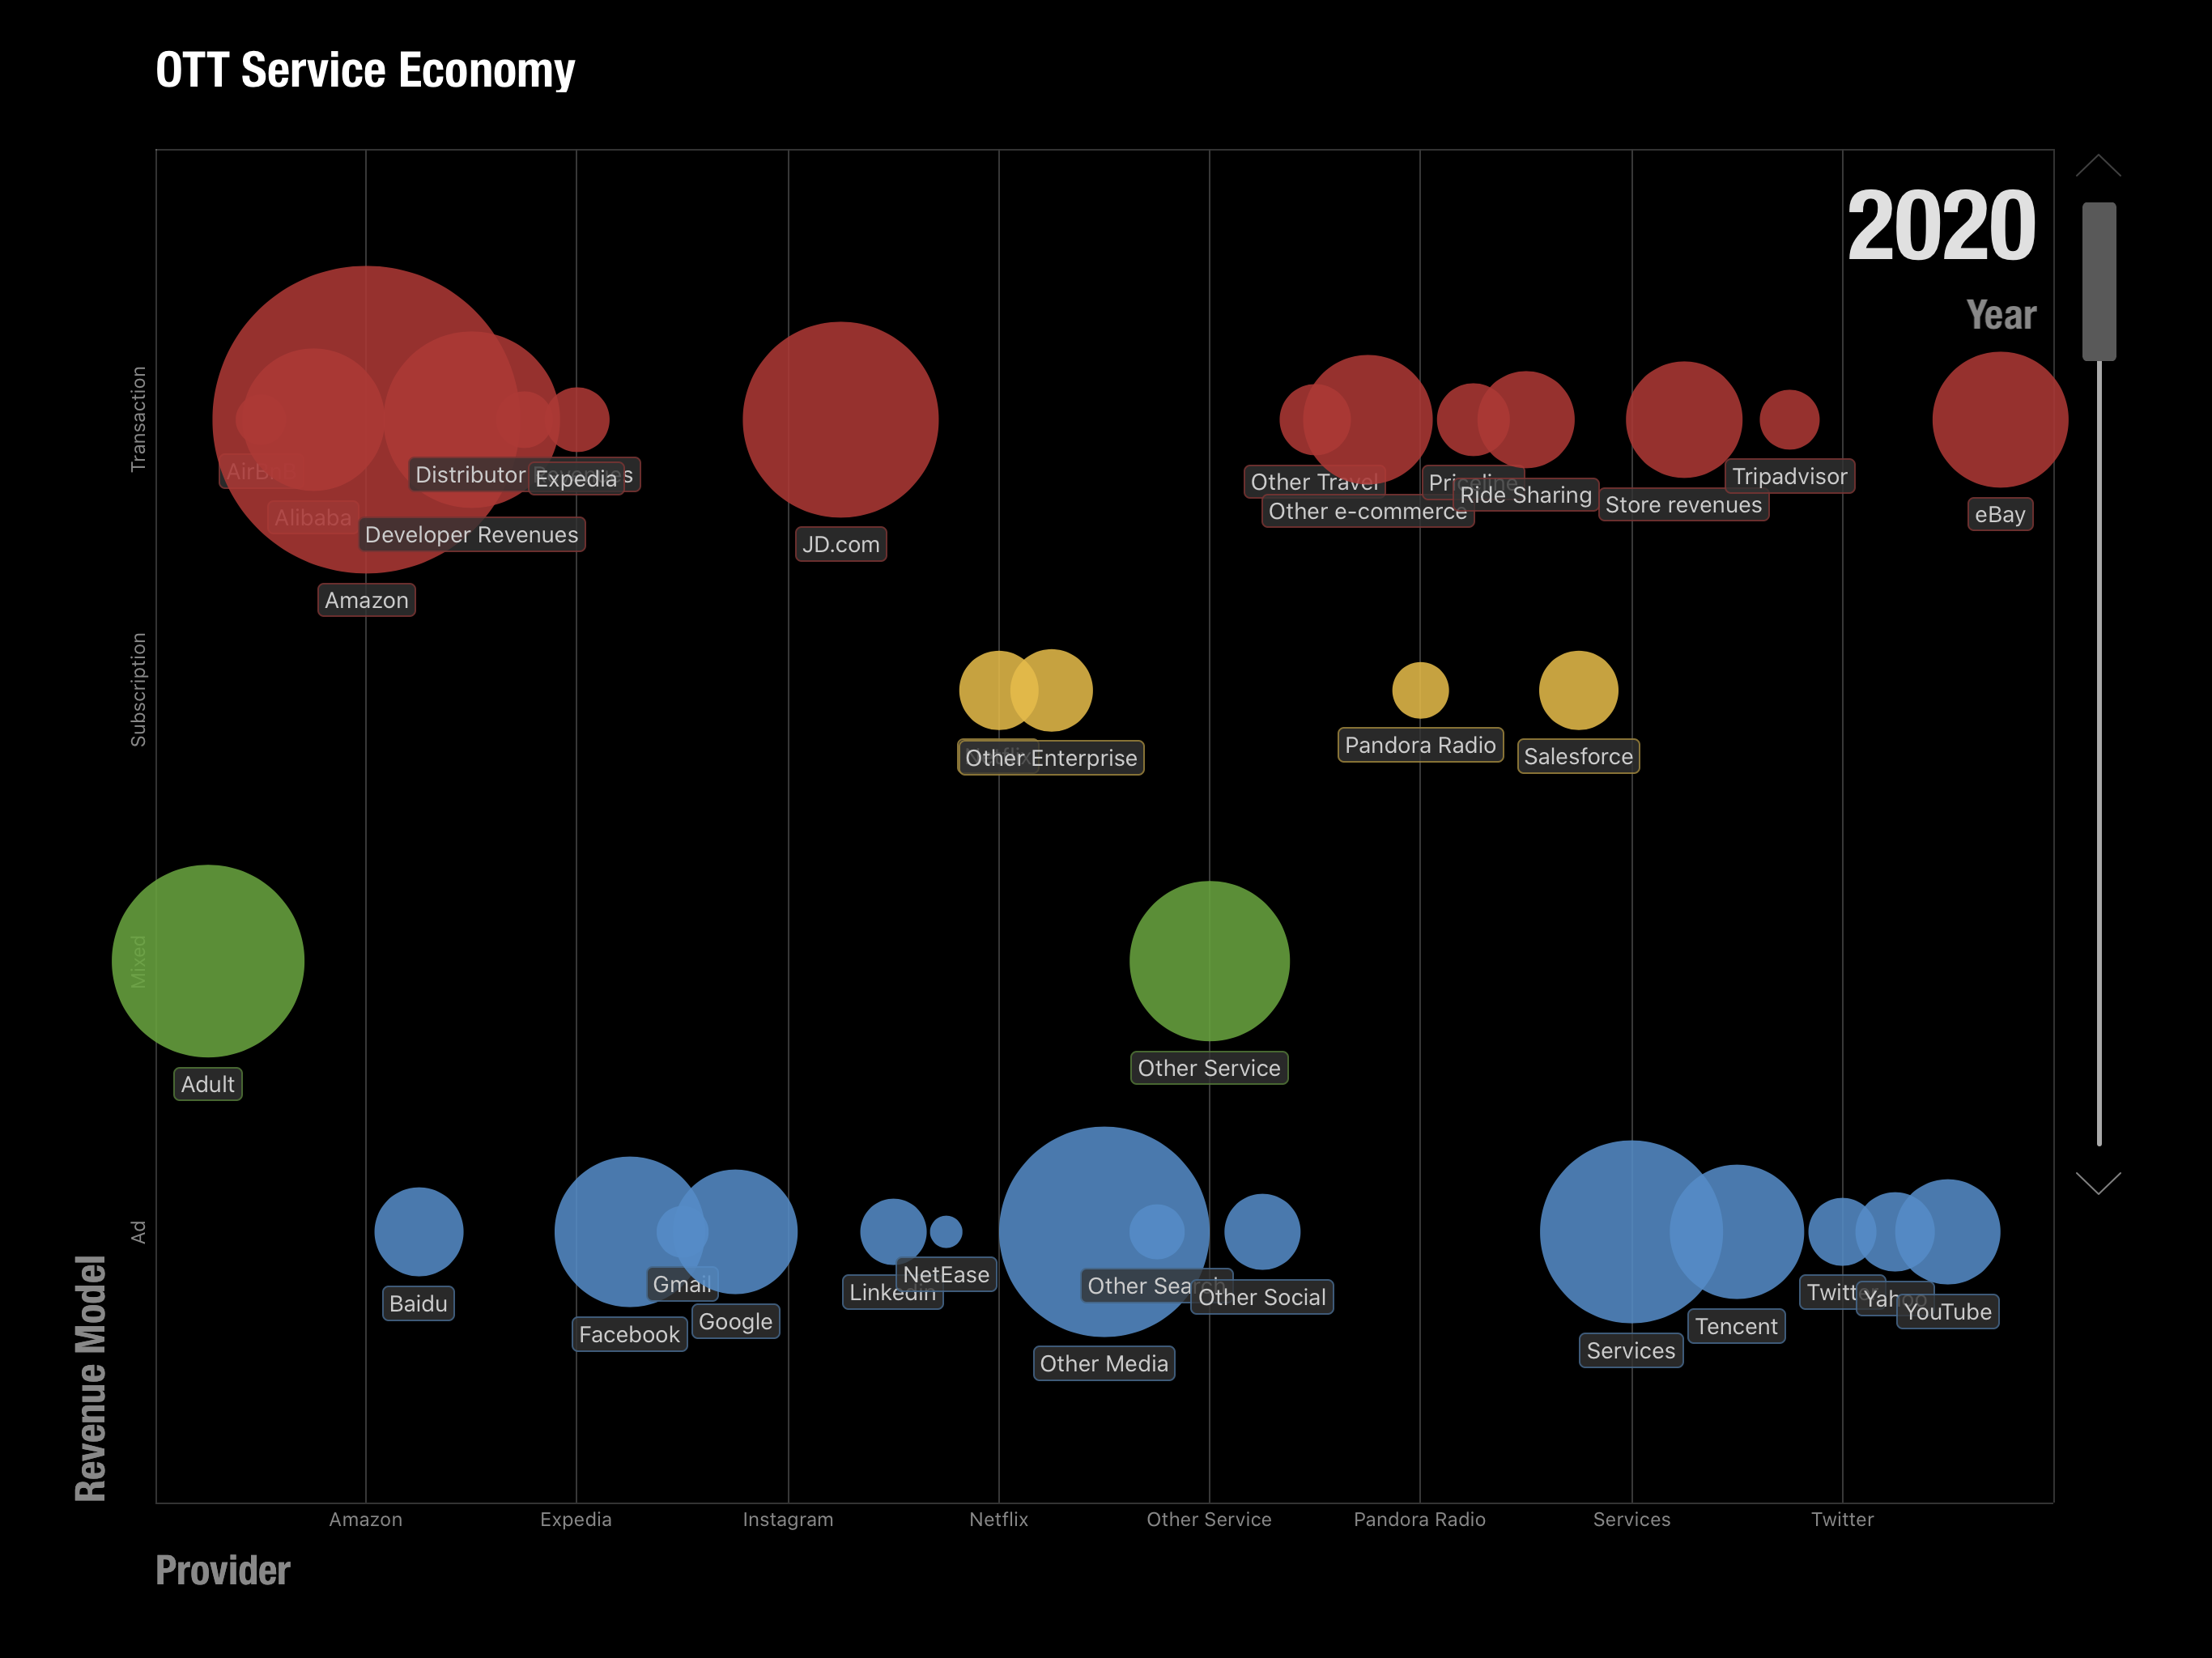
    Over the top (OTT) service components by revenue model in 2020 estimated in 2016.
    Allocation of OTT Revenues Across Service Types and Business Models and Platforms 2015 (estimated in 2016)
    Allocation of OTT Revenues Across Service Types and Business Models and Platforms 2019 (estimated in 2016)
    Composition of service revenues per user ($/year) for mobile platforms in 2015 (estimated in 2016)
    Composition of service revenues per user ($/year) for mobile platforms in 2020 (estimated in 2016)

    Of course there are several potential errors in this methodology. The categories were not all inclusive. I used Social, Media, Search, Maps, email, Messaging, e-commerce, Travel, Enterprise, Storage, Transportation, Travel and Other as the top level categories. There are many products and services who would end up in Other. Moreover, these categories were anchored by the top companies in each category and the share of the top names was not always clear. Finally, the growth rates for these categories were based on historic trends which could change either way.

    The online services ecosystem (all platforms) was thus estimated to be $450 billion in 2015, growing to $820 billion by 2019 and $914 billion by 2020.

    The mobile split would vary by segment but would be roughly 75% by 2020 (25% would not be mobile). The final assumption was based on the split among the existing mobile platforms. I put a multiple of roughly 50% for iOS and 35% for Google Android and the rest for China Android.

    Multiplying all these assumptions gave me a figure of $275 billion for the iOS portion of the global online services market in 2019. (Incidentally, Android was estimated at $207 billion and China Android $110 billion.) Note that this does not mean this was an expectation of Apple's revenues or that this was the opportunity of Apple obtaining any percentage of this revenue. It was simply the value of what would transact through iOS, a platform which would act as a commerce enabler. This was to be the size of the iOS "ecosystem" or co-dependency between Apple and the companies delivering through its platform.

    Ecosystems are a powerful idea. As I recall, this term applied to mobile was coined by a Palm executive in the late 1990s when he referred to the value of all the apps built for the Palm Pilot. The biological term refers to the system of multiple species living in close proximity. It implies an equilibrium as each species benefits from the others and the environment. There might be predators and prey but biodiversity is the successful construct.

    The idea of an ecosystem for a platform was also the core strength of Microsoft's Windows which created the network effects around it and it has been the goal of every platform since. The nature of computing and networking implies that these systems grow faster and are more resilient than the more traditional value networks of other businesses or industries.

    Now this ecosystem was something we wished to highlight in 2016 as a core strength for Apple. It was not considered as such at the time and I thought putting a figure of $275 billion in 4 years' time was a way to highlight the potential. Time since has proven us right.

    This week Apple highlighted the result of another research team who attempted to measure the iOS ecosystem. Their conclusion was that billings and sales facilitated by the Apple App Store Ecosystem in 2019 was $519 billion. More than twice the amount I had so optimistically forecast four years earlier.

    The authors also emphasize that this is a conservative estimate and should serve as a baseline.

    I feel partly vindicated about that figure as my attempt at a figure was intended to highlight the scope of the ecosystem and it is better to have underestimated it than overestimated it. The authors' methodology was also similar in being bottom-up summation of components by categories of services but the information available today is enhanced by the new data Apple made available on subs and Services revenues and install base.

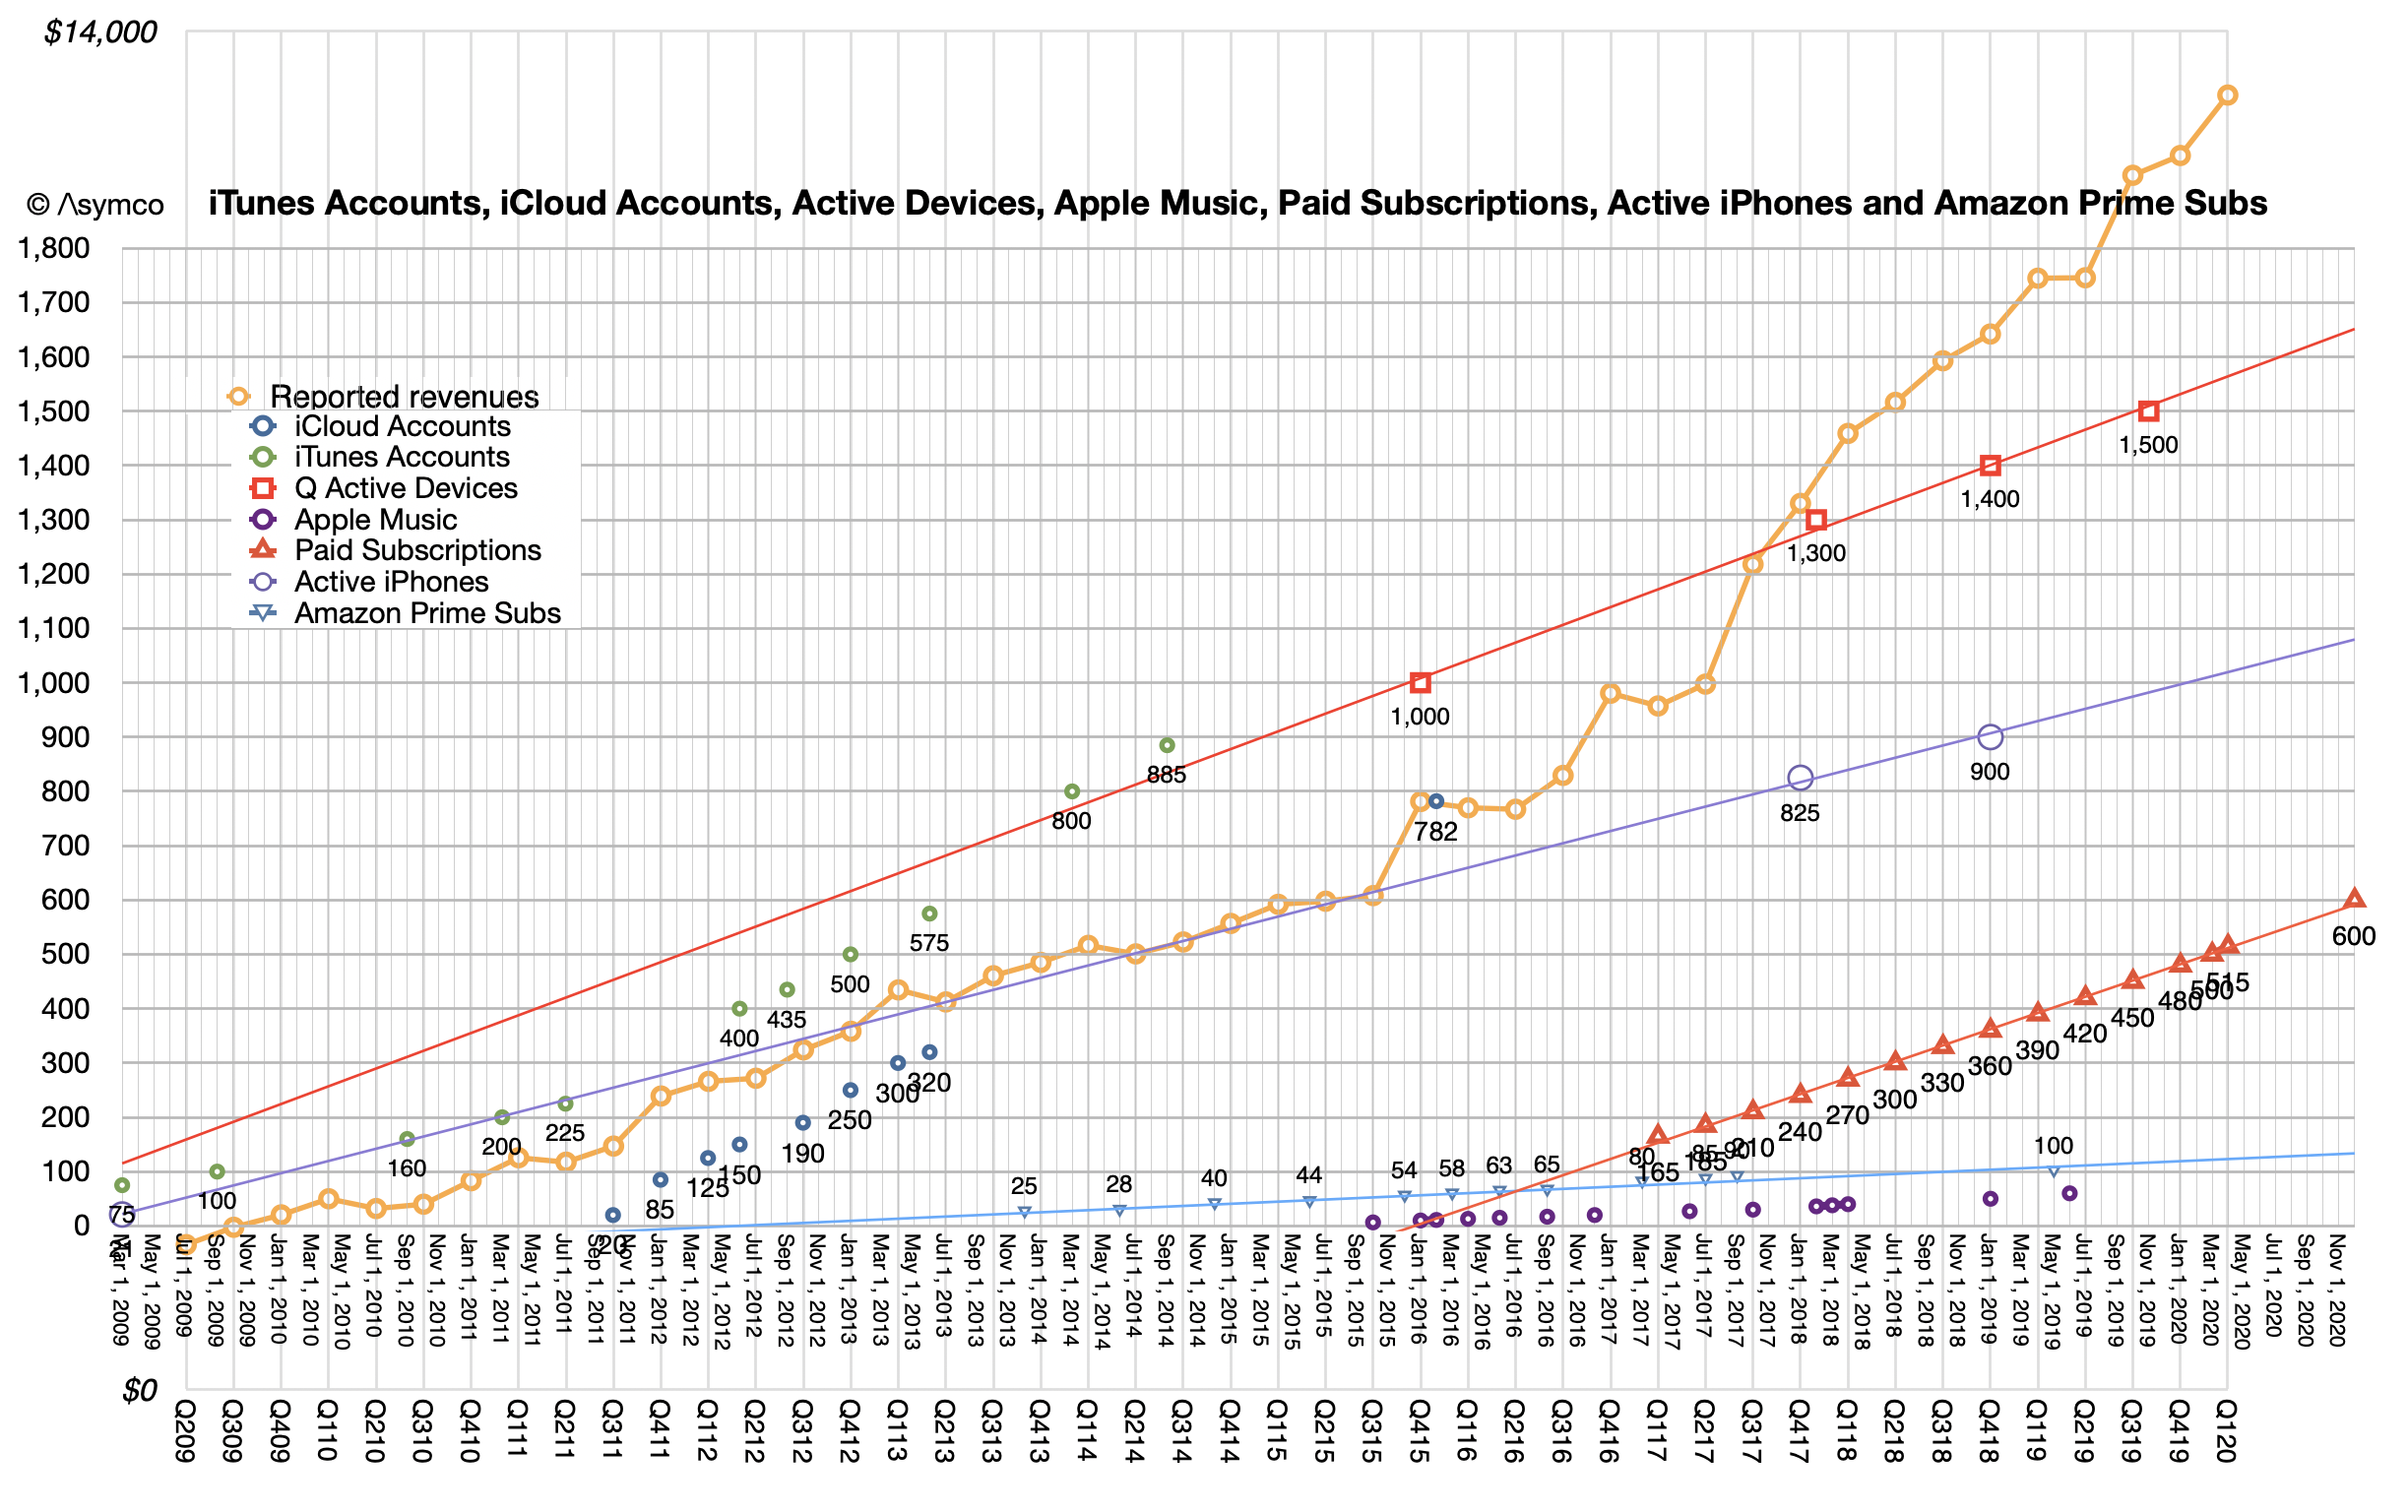
    Note that in the graph below the salient data points of subscribers (red triangles) had not begun until 2017 causing the acceleration in Services revenue (yellow line). Note also the additional square points representing install base.

    This figure of more than half a trillion dollars of value transacted through iOS should give some pause. It it a very powerful figure that can be combined with the other data from Apple:

    • More than 1.5 billion active devices
    • More than 1 billion iPhone users
    • More than 500 million paid subscriptions
    • More than $1/day iPhone hardware revenues for Apple

    The half-trillion per year on services implies between $335 and $520 in spending per user (likely closer to $500) per year. This would be in addition to the approximately $365/yr in hardware spending per user (which Apple books as hardware revenue). In the case of the iPhone there is yet more: the cellular network service which may average $350 per year.

    To simplify, the "average Apple user" spends $1/day for each device, $1/day for the network and $1.4/day on items bought through the device. Adding a margin of error, that's between $3.4 and $4 per day each user spends. Oh, and there are about a billion such users.

    The total spending enabled by iOS thus is close to $1.4 trillion/yr.

    That's a significant amount. It's bigger than many industries. There are only about 12 countries with higher GDP (Spain is about the same.)

    How does Apple benefit from this?

    Apple captures 30% of billings through its App Store. My estimate for these billings were $67.9 billion in 2019 which means App Store billings were 13% of the 2019 ecosystem. Apple's 30% cut of Billings amounts to 3.8% for the whole ecosystem. It's hardly an oppressive number.

    If Apple only captures 3.8% what use is this to Apple?

    The last decade has seen Apple emerge as the world's largest company in terms of market capitalization, and not doing so with a wild multiple of revenue or earnings, quite the opposite. It did this by creating the world's greatest customer base. Not in absolute scale. Android and Facebook have larger customer bases with multiple billions of users.

    No, Apple's one billion users are simply the best billion users. They are the most likely to stick with Apple and they are the most likely to buy more from Apple and—this is crucial—they are the most likely to buy everything else. Those other companies whose sales come from Apple customers have been taking note. They know that Apple customers are desirable customers and choose to target Apple customers, as much as they can. Associating your company with Apple makes a lot of economic sense.

    I will admit however that my argument that Apple created a customer base is contrived. The fact is that Apple creates products and services and those products are the root of its power to attract the right customers. By choosing to create the best products it coincidentally chooses to create the best customers. The power flows from product not from pricing or positioning. This is a lesson lost for many.

    Developers and regulators might feel Apple's massive power is perhaps too much. In the last decade, the narration around Apple has shifted from Apple being perpetually "doomed" to it being too dominant. Although I'm sure there are some who will try to conflate the two declaring that dominance will inevitably result in doom, most critics of Apple went from laughing (at it) to crying (about its practices).

    The argument that Apple should change its practices developed to price as it does, distribute as it does or design as it does because it was too successful or is "unfair" is getting the causality wrong. Dominance won't be altered by a few points of percentage change (on a tiny fraction of ecosystem transactions). Fairness won't be altered when there are thousands of business models and many remain to be invented. Case in point is pornography which is not permitted on the App Store but which exists in abundance thorough other access methods.

    The argument is that Apple should be more generous. That it should decrease the "cut" it takes for distribution. Or that it should not enforce revenue split for the customers it exposes to others.

    But this is problematic on many levels. The playing field for all developers needs to be level. The customer must be respected and access to that customer should be constrained or certainly metered. Abuses must be policed and that requires leverage.

    These practices are inter-dependent and the effect multiplicative, not additive. Apple has a monopoly on iOS and on MacOS and WatchOS and iPadOS. It does this to control the experience, security and safety of the user. It's that control which created the customer in the first place. It should naturally control access to its hard-earned customers.

    It does not monetize the distribution of content or apps unless the developer/creator directly charges for the product or service. Distribution is not cost free and to offer it for free is a subsidy which would create additional market and innovation disincentives. The loyalty of Apple users is evidenced by the 600 million paid subscriptions (end of year estimate) that are booked through the App Store. Developers benefit directly as a result.

    One could argue that the abundance of services which don't distribute through the App Store is evidence that the system works as intended. Apple's App store front is its property and it reflects its core values.

    Being on the shelf in the App Store means you operate on the terms of the shelf owner. If the rules are not agreeable then the half trillion dollars of ecosystem activity is testament to the availability of alternatives.

  3. Lasts Longer (2.0)

    Research

    About a year and a half ago in Lasts Longer I noted that "keeping iPhones in use" became a top priority for Apple's design for sustainability. I considered this provocative because it prioritizes usage and users over units sold, in contrast to how the company was perceived by investors. This new focus was reinforced by the company's dropping of unit shipments data and the addition of Services data including subscriptions count and gross margins.

    Apple effectively transformed itself into a services company with customer acquisition, subscriptions (measured by average revenue per user) and retention/satisfaction as key operating metrics. The 1.5 billion active devices and ~1 billion active iPhones and 500 million paid subscriptions are the new data points rather than units sold.

    To succeed with this new Lasts Longer strategy, one of the objectives should be that devices become more durable and their durability should in-turn result in more minutes of use and thus more return on initial purchase price. But how can we measure this? We don't have precise data on the use time. We have some anecdotes but no official data. We do know the iOS operating system is now designed to work on older hardware but that does not give us a measure of what is in use.

    Luckily we now have an indicator that can help: Bank My Cell published a new data set on various used phone prices. This is a gold mine.

    The data consists of prices for about 220 used phone models that changed hands in 2019. The prices are given for the beginning of the year (earliest date when the model was sold) and the end of the year (latest date when the model was sold.)

    It's thus possible to see how various models from a number of companies changed in price during the year. The date of initial release of the phones is also given (though initial selling price isn't. It's a bit tricky to determine initial selling price because the model may have been sold for an extended period of time and discounted through that period.)

    What we do have allows comparisons between different manufacturers to see, especially for recent (late) models, just how big the drops have been in prices.

    I recommend reading the original post to see some of the comparisons between brands. In addition I chose to illustrate some of the differences with the graphs below.

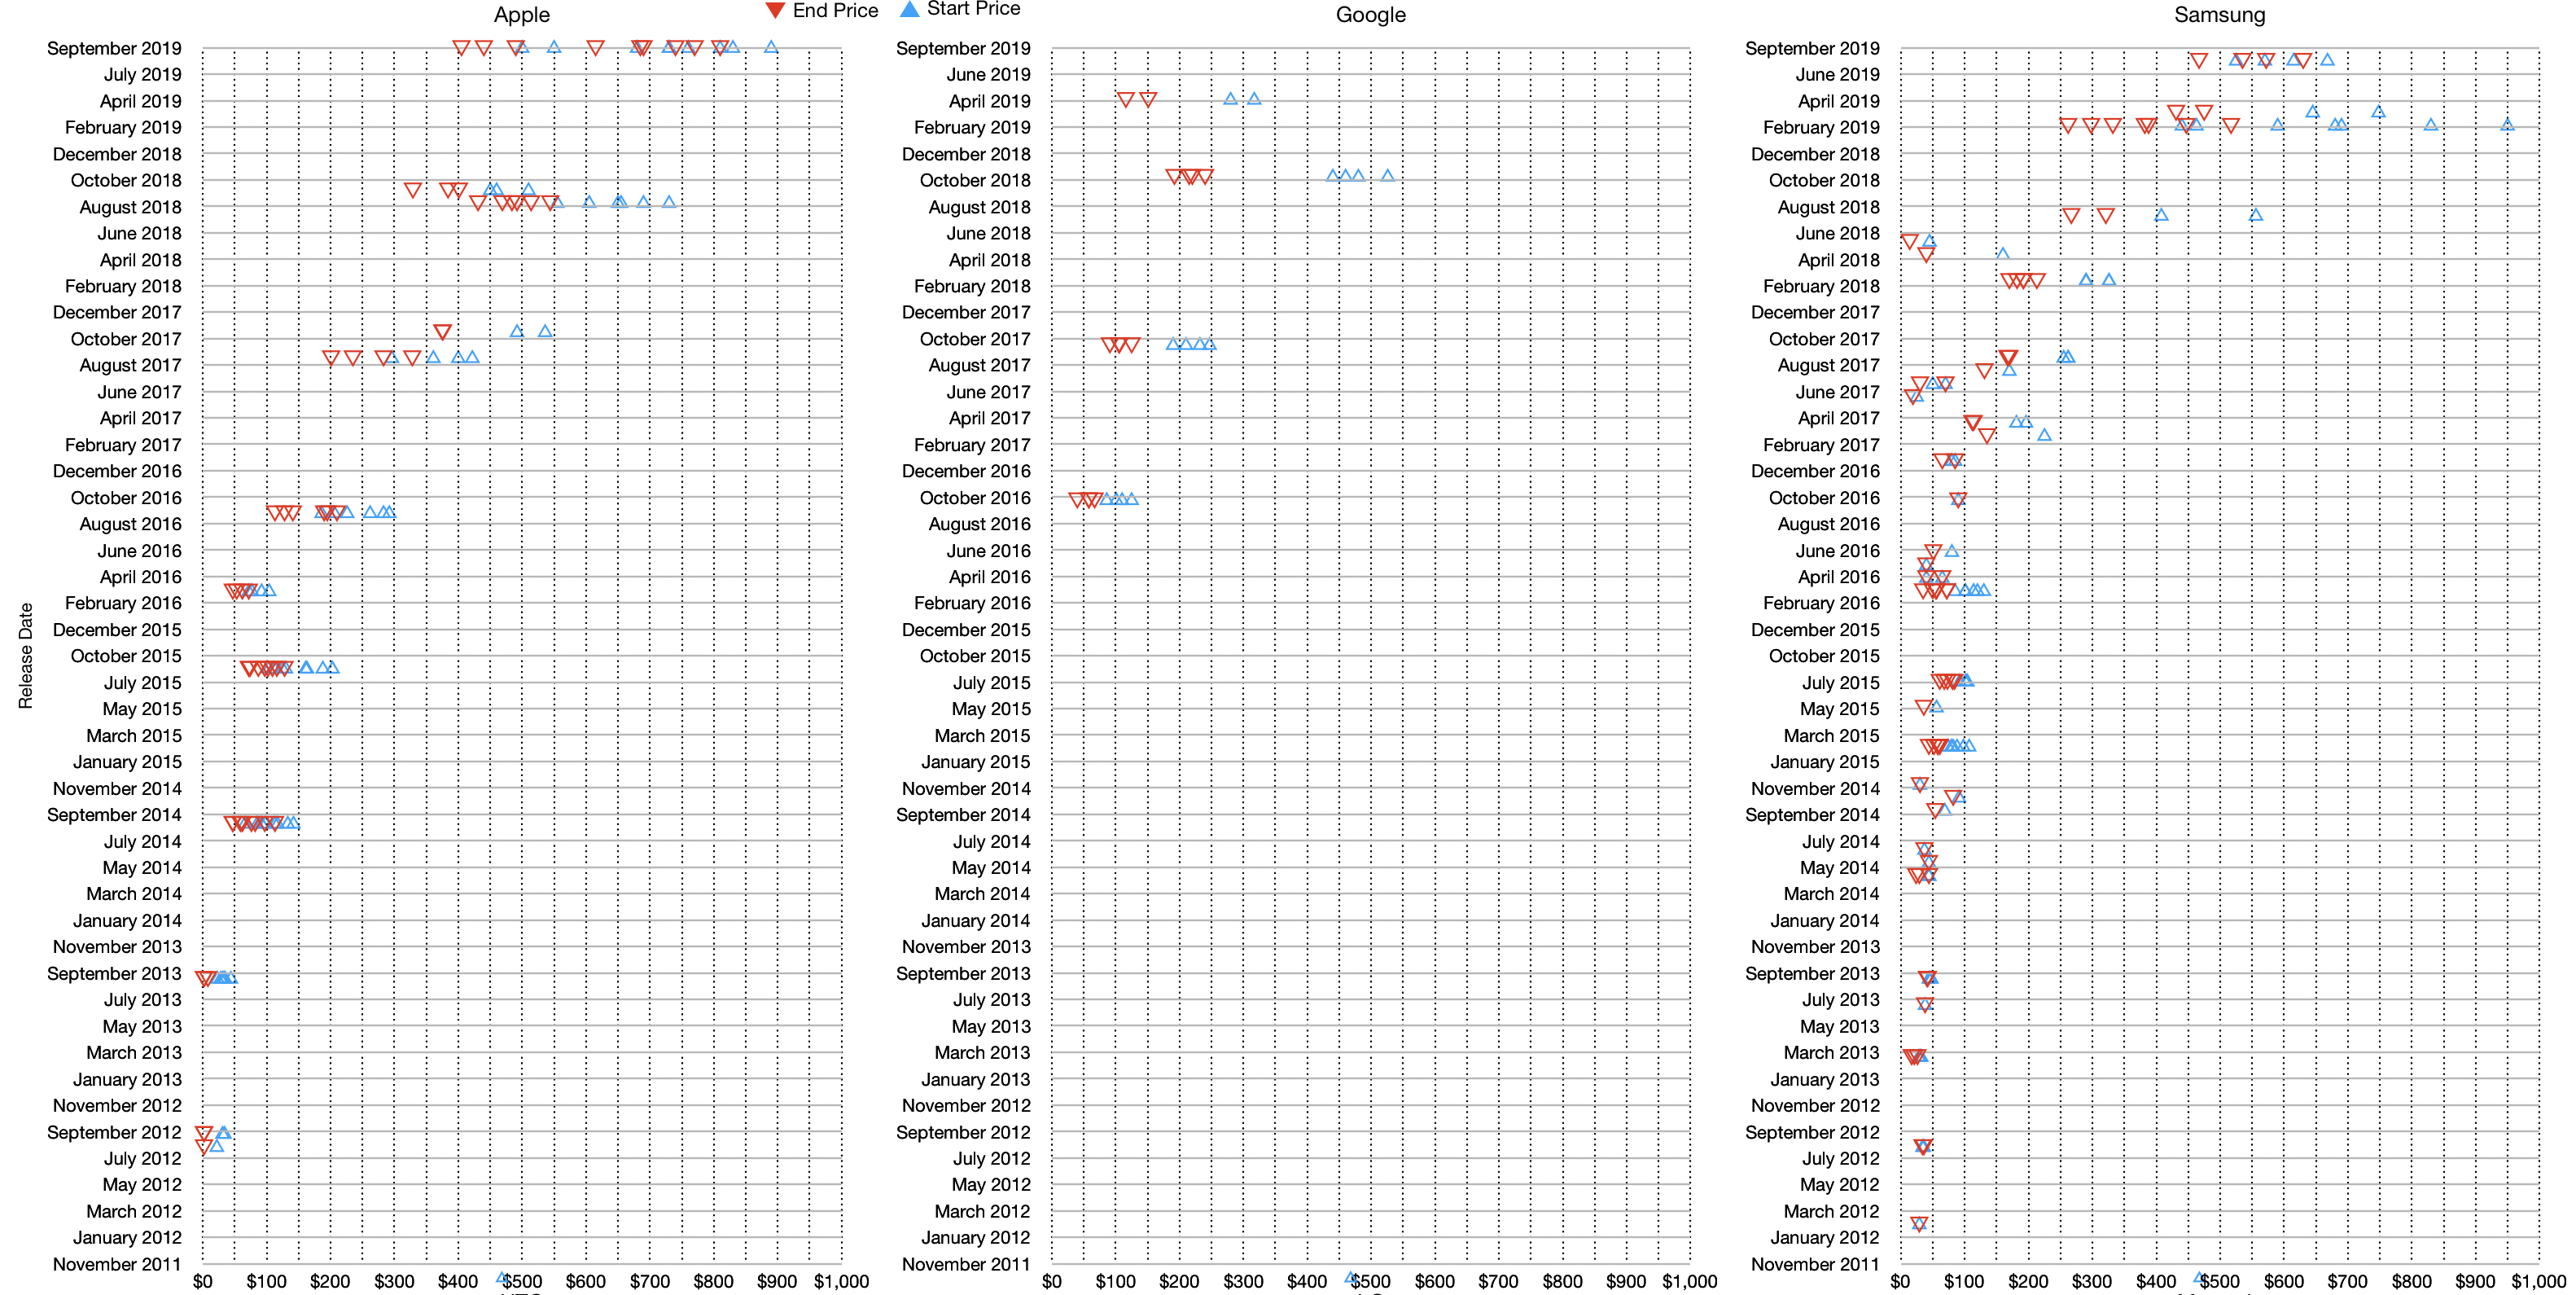
    These graphs show phone model prices at the beginning of 2019 (blue) vs. the end of 2019 (red). The models are not individually identifiable but they are shown by the year of introduction. So, in the case of the iPhone, the 2019 cohort (those released around September 2019) are the top line, then the 2018 group is shown in the second line and on down. Thus the oldest iPhones traded during 2019 were iPhones 5, initially released in 2012.

    To read the graph, you can scan each line to see the gap between the red and blue triangles to see how much the phones roughly fell in value. The comparison above is between Apple, Google and Samsung.

    Here are some patterns I noticed:

    • Google phones had larger drops during the year than equivalent iPhones. Just how much the drops were is listed by the original post: "Google lost an average of -51.68% between Jan-Dec 2019. The Pixel 3 (2018) was the fastest depreciating and highest value loss at -56.70% (-$267)".
    • The overall picture of Samsung's phones is hard to discern. Flagship Android phones ($700+) dropped in value roughly twice as fast as Apple's. But the the overall picture is messy. Budget phones are mixed with premium and the average pricing seems to quickly go near zero.
    • iPhones have a more valuable "mid-range" for models more than 2 years old. Android phones fall hard in the mid range and cluster around zero quickly. This is the heart of the "old but valuable" proposition.

    Depreciation rates might seem academic but depreciation is an indicator of a real perception of value and that in itself is a reflection of utility. Users are likely to pay for a used product only if they think it can still be useful in proportion to the price. New product buyers might pay for other things like prestige, status signaling or just wanting to be first. But used buyers are more mindful of what the product can do--they are less likely to benefit from signaling.

    Analogously, the used car market often shows the underlying quality or reliability of a car model. If a luxury car plummets in value it means that it becomes a huge burden to late usage, usually due to servicing costs. In previous decades luxury cars were also durable cars but with complexity they became money pits.

    In the used phone market hardware repair and maintenance are less consequential but there is a concern for software support, security and privacy. The serviceability of the battery, the camera quality and the fit and finish of the body matter.

    Buyers are not stupid. The market speaks words of wisdom. A phone that is worth more will reflect more inherent utility. Remember that a phone is unlocked more than 80 times a day. If it has 4 years of use then it get unlocked 116,000 times. That's not "uses" but unlocks. Actual usage in terms of taps, swipes, or glances could be triple that figure. There are phones on the list that are 7 years old. It's not unreasonable to assume that a moderately well used iPhone has enabled a quarter million interactions.

    Remember that phones are used all day, every day. At home and at work. In cars and in planes.

    Even on weekends, and on holidays. And even when you're "social distancing".

    In fact, the more physically isolated you are the more likely you are to rely on the phone as your social lifeline. In difficult times the product people turn to first and last isn't one of luxury or frivolity. It's a product that keeps you informed, connected, lets you help others and may even keep you alive.

    It's in difficult times that the true character of a product shines through. The smartphone, derided, mocked and blamed for all kinds of societal ills is what we turn to first to avoid getting ill.

  4. Just in Time

    Research · 73 comments

    The iMac launched May 6 1998, exactly 20 years ago. It is not the most significant computer to ever exist. It was a clear descendant of the original Mac which established the "all-in-one" desktop computer category. That category, to which it still belongs, is a modest segment. The last time Apple reported portable sales separately was in late 2012 when the desktops/servers and pro systems combined made up only 20% of all Mac sales by units. If iMac were 10% of Mac sales, it would represent about 2 million units in 2017.

    Desktops evolved into laptops and personal computing evolved into pocket  computing. Becoming more personal means more intimacy and this is leading to wearable computing. There is more beyond that to be sure.

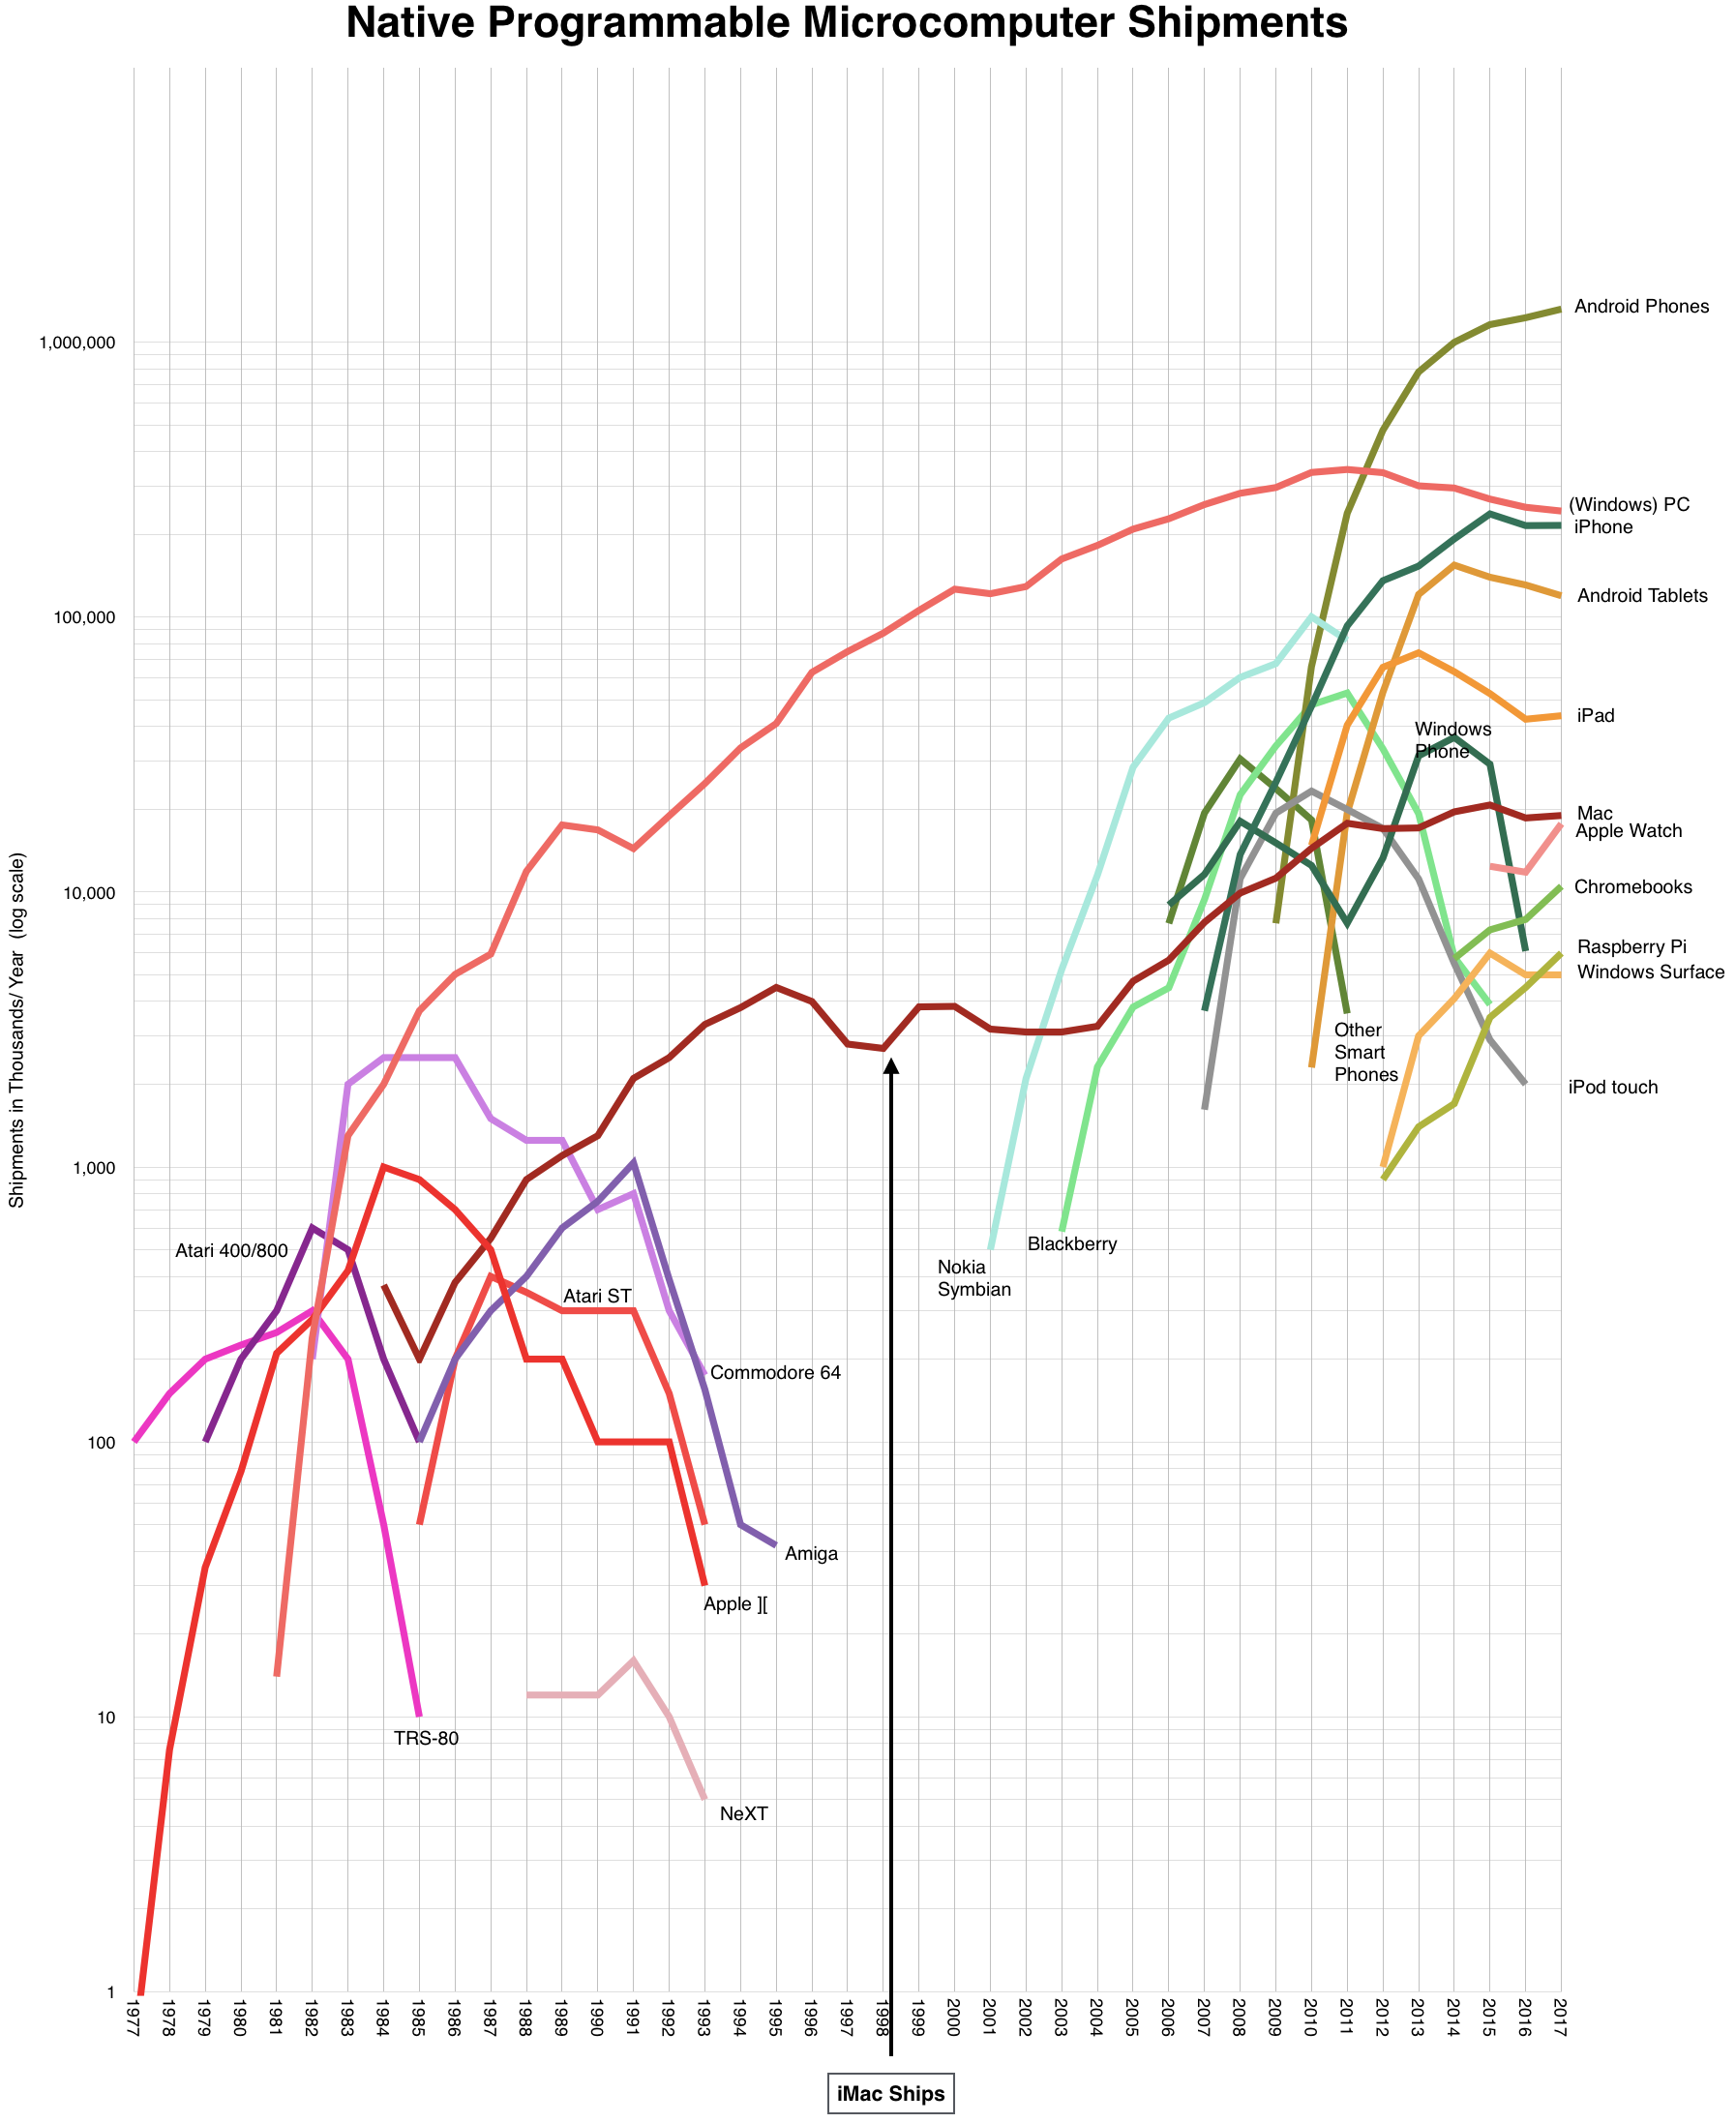
    But the iMac is a historically significant machine. It allowed Apple to start on a new trajectory. It did this by first offering a financial lifeline. Sales of Macs, which were at the time the only source of revenues for Apple, increased from 2.7 million to 3.8 million a year. This at a time when Windows PCs were shipping about 100 million units. That was enough to ensure survival. Today Mac units are five times higher while Windows PCs are about 2.5 times higher. The following graph shows the impact of iMac on the Mac's trajectory. 

    Second, the iMac was the first host of OS X, an operating system built on Unix which made it extremely flexible. iMac gave Apple the space for OS X to be developed and to be optimized for various hardware. The experience with OS X and its inherent scaleability (down as well as up) meant that it could be considered for the post-PC devices of the future.

    Lastly, iMac's design screamed "consumer product" which went from signaling inferiority to superiority. It set a standard for novelty, creativity and dynamism in the category that was considered second-rate. In the early 2000s consumers began to lead in the adoption of new technologies. DVD drives, internet connectivity, wifi, instant messaging, media consumption exploded. All the while institutions, hung up on legacy, began to block technologies. At this pivotal moment, the iMac spoke with its looks. It didn't just imply a new order, it stated it.

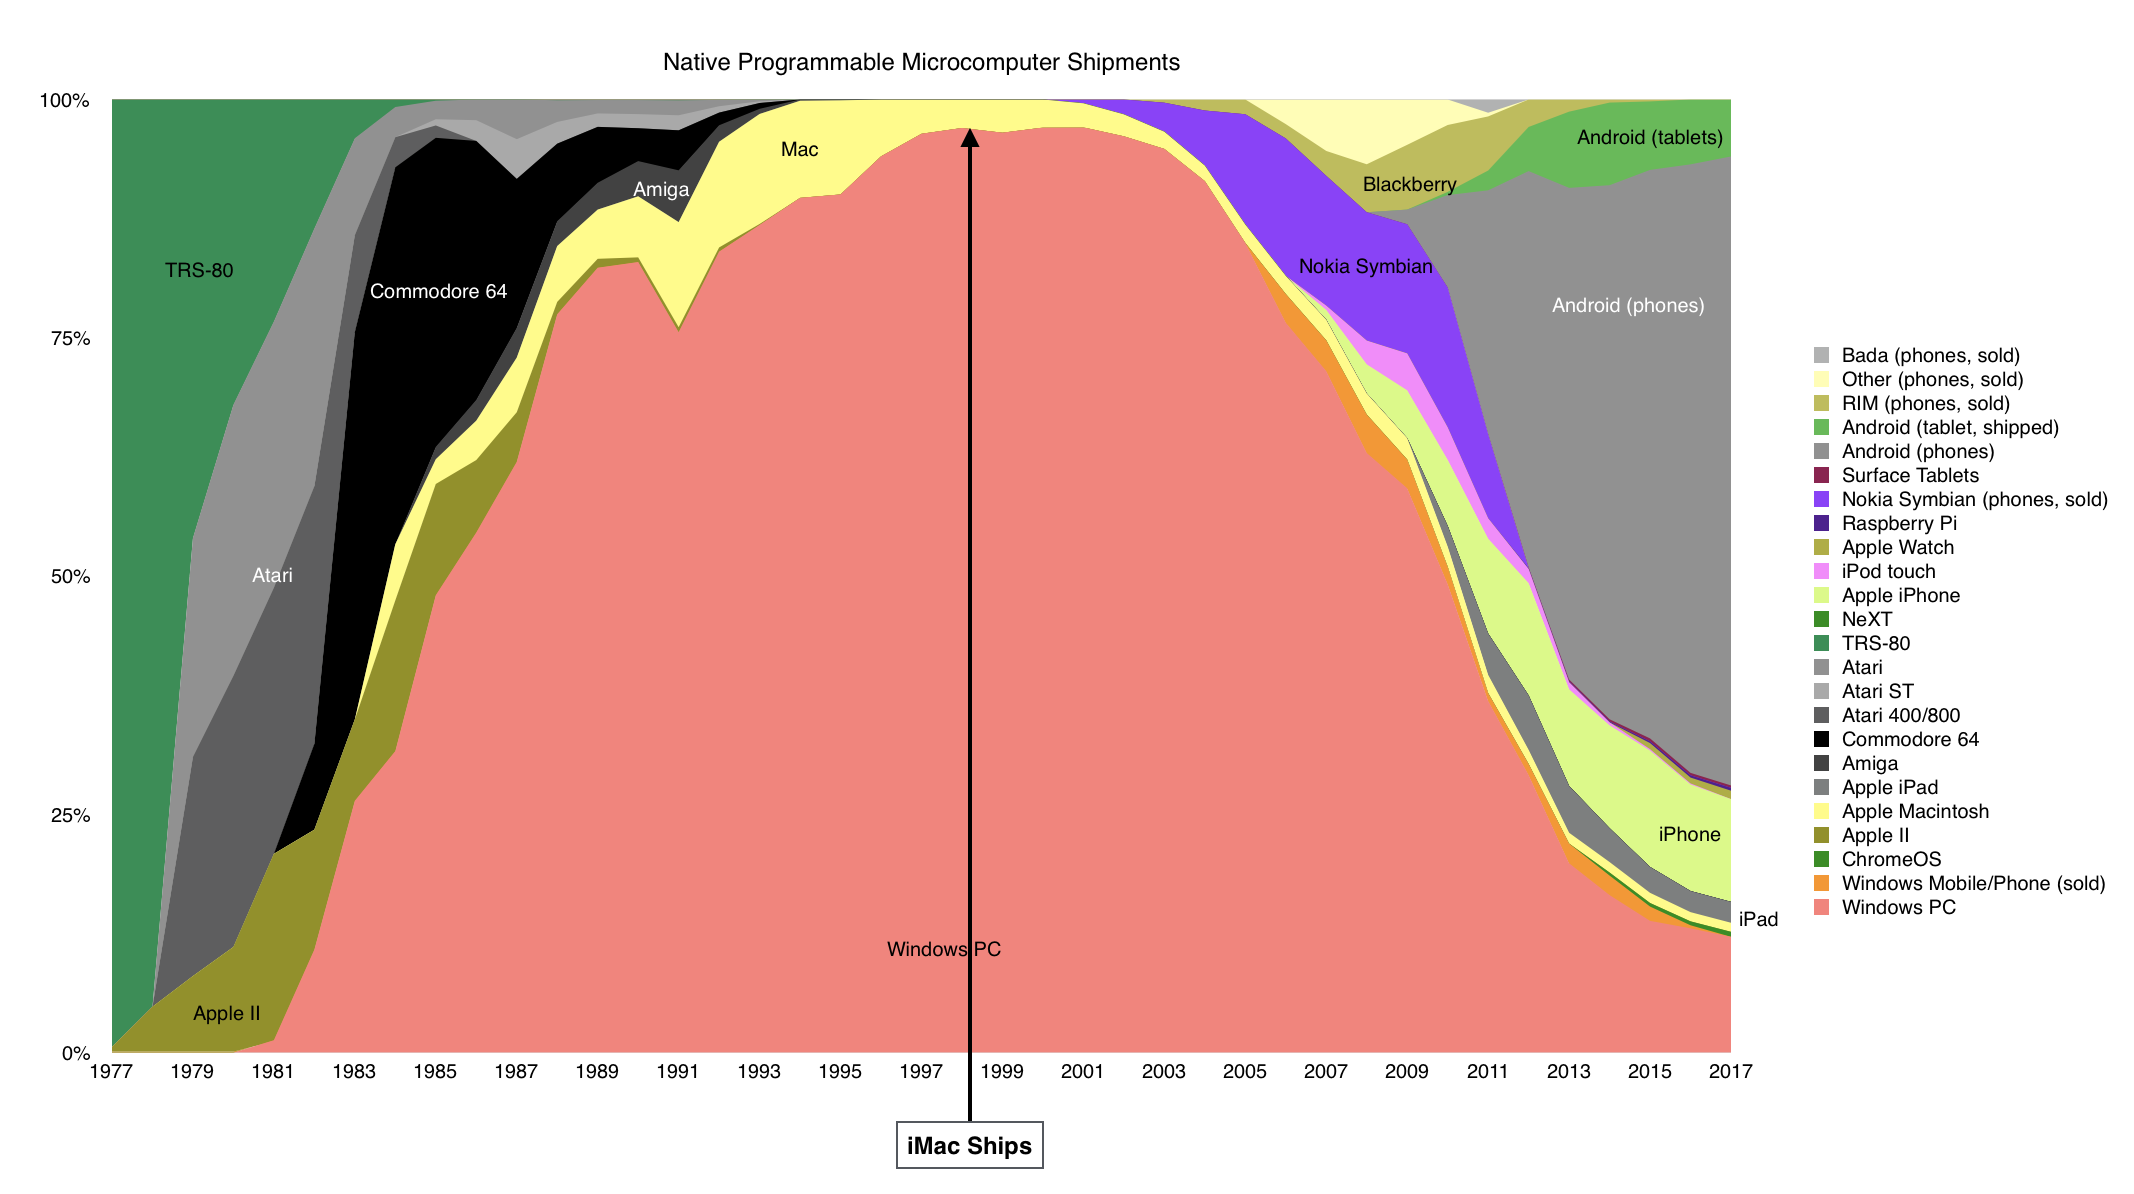
    To me the incredible aspect of the iMac's entry is its uncanny timing. It came not only just in time to save Apple but exactly half-way between the first two ages of computing. In the following graph showing "share of computing" you can see it as launching precisely at "peak Windows".

    In retrospect you have to wonder if Apple, with the iMac, was lucky to survive into this next era or if that era would have ever happened without the iMac. It's a question of causality which quickly devolves into an un-winnable argument about stochastic vs. deterministic existence.

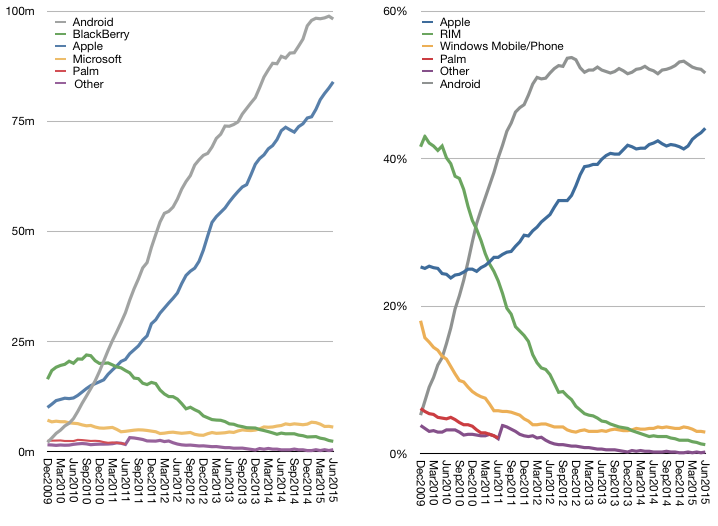
    Regardless, the result was felt more than seen. The computing industry was pivoting. The results are seen also in the graphs above. The iMac came right in the middle of the "desert" of platform choice of the late 1990s. By the 2000s mobile platforms detonated on the scene. The iPod was Apple's first entry, in 2001, but it was not a computer. It was an appliance. A stepping stone at a time when the early platform contenders Nokia, Palm, Microsoft and BlackBerry surged before realizing that they did not have sound foundations upon which to build ecosystems. Their advances could not be consolidated.

    The spoils went to the later entries of iOS and Android. The resulting disruption was shocking and disorienting. Not only did the old order get up-ended but the magnitude of the new was 100x the old. The iMac enabled at least a trillion dollars of value to be created and made Apple the biggest company in the world.

    As you would expect, at the time, 20 years ago, none of this change was anticipated. iMac was a 'cute' computer. Toy-like and obviously unprofessional. It attracted and relished contempt.

    So now we are at a point where the second era of computing is at its apex. With markets near saturation, the device business is inflecting from growth to possible stagnation if not decline. There are two platforms--though unlike Windows, Android is fragmented and iOS is not just on one form factor. Nevertheless there is stasis. The touch UI which begat nine billion devices is normative. The next interaction metaphor has not emerged as an obvious successor.

    The question for today is what is the new iMac? What is the enabler for change? It's not easy to spot. It is not the thing of the future but it points to the future.

  5. Estimating Apple's Second Calendar Quarter

    Research · 8 comments

    Apple reports second calendar quarter results in about a week. I propose the following estimates:

    Fiscal Q3 2017:
    Rev ($B) 45.321
    EPS ($) 1.62
    iPhone (units) 41 million
    iPad (units) 9.8 million
    Mac (units) 4.35 million
    Watch (units) 2.5 million
    Services ($) 7.2 billion
    Other products ($) 2.6 billion
    Gross margin (%) 38.4

    The revenue estimate is visualized in relation to guidance (revenue between $43.5 billion and $45.5 billion) and shown in the context of previous actual revenues below:p

    The estimates are also consistent with additional guidance provided:

    • Gross margin between 37.5% and 38.5%
    • Operating expenses between $6.6 billion and $6.7 billion
    • Other income/(expense) of $450 million
    • Tax rate of 25.5%

    The estimates (and guidance) suggest modest growth of 7% in revenues and 13.7% EPS. The predictability of the quarter suggests that attention will mostly be focused on guidance for the next quarter.

    Expectations can vary quite a bit because of the effects of a new launch. The product mix, pricing and timing are all unknown at this time.

    What is known however is that the customer base for Apple is increasing and loyalty is higher than ever. What I sense, coming from very few data points, is that there are more iPhones in use than ever before. A few years ago when the market was less saturated it was easy to assume that commodity Android phones and tablets would surge and swamp iPhone/iOS usage.

    This has not happened, indeed the data suggests that iOS usage is stronger than ever and that there are many more "switchers" moving from Android to iOS than vice-versa.

    This may surprise some but if we look at the PC market, a similar phenomenon has been taking place for years. Mac usage grows and Macs are more visible and valuable than PCs.

    It's important to note that in the latter, post saturation stages, the markets for both phones and computers are increasingly driven by brand value. This resistance to commoditization is due to buyers' perceptions of quality moving beyond utility and of the prioritization by buyers of new measures of performance. These new measures defy measurement.

    Much of what is therefore required of market analysts is intuition.

  6. The First Trillion Dollars is Always the Hardest

    Research · 61 comments

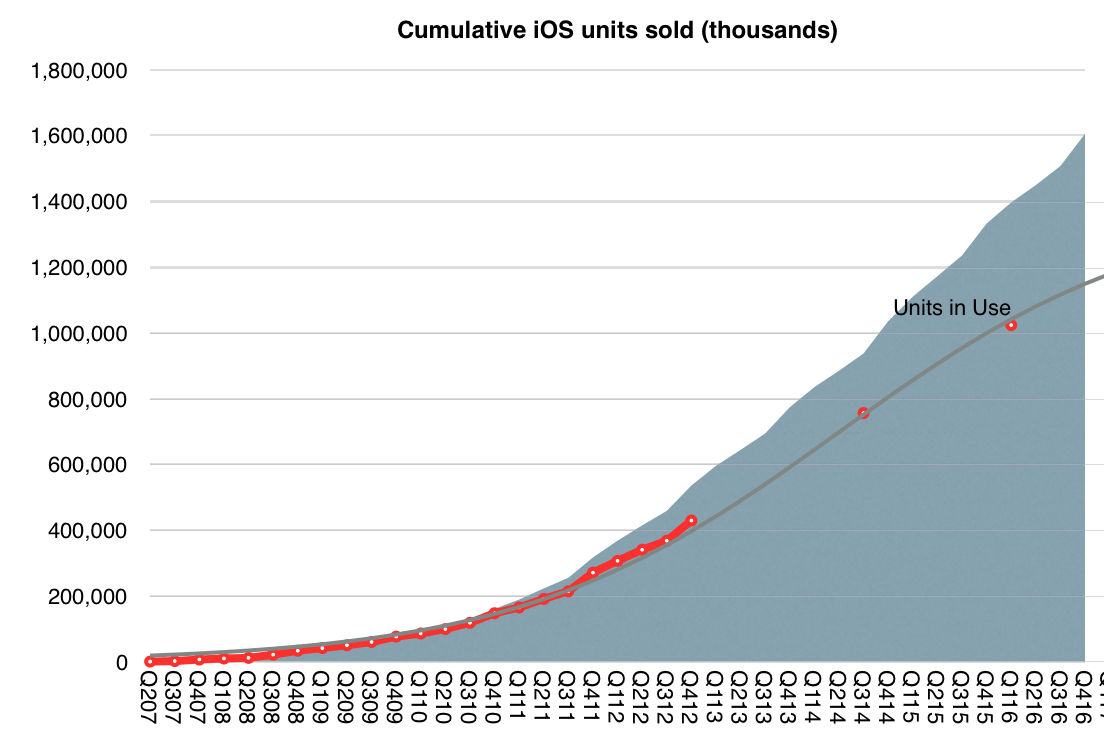
    In its first 10 years, the iPhone will have sold at least 1.2 billion units, ((Includes forecast for first six months of 2017)) making it the most successful product of all time. The iPhone also enabled the iOS empire which includes the iPod touch, the iPad, the Apple Watch and Apple TV whose combined total unit sales will reach 1.75 billion units over 10 years. This total is likely to top 2 billion units by the end of 2018.

    Screen Shot 2017-01-11 at 10.15.00 PM

    The revenues from iOS product sales will reach $980 billion by middle of this year. In addition to hardware Apple also books iOS services revenues (including content) which have totaled more than $100 billion to date.

    This means that iOS will have generated over $1 trillion in revenues for Apple sometime this year.

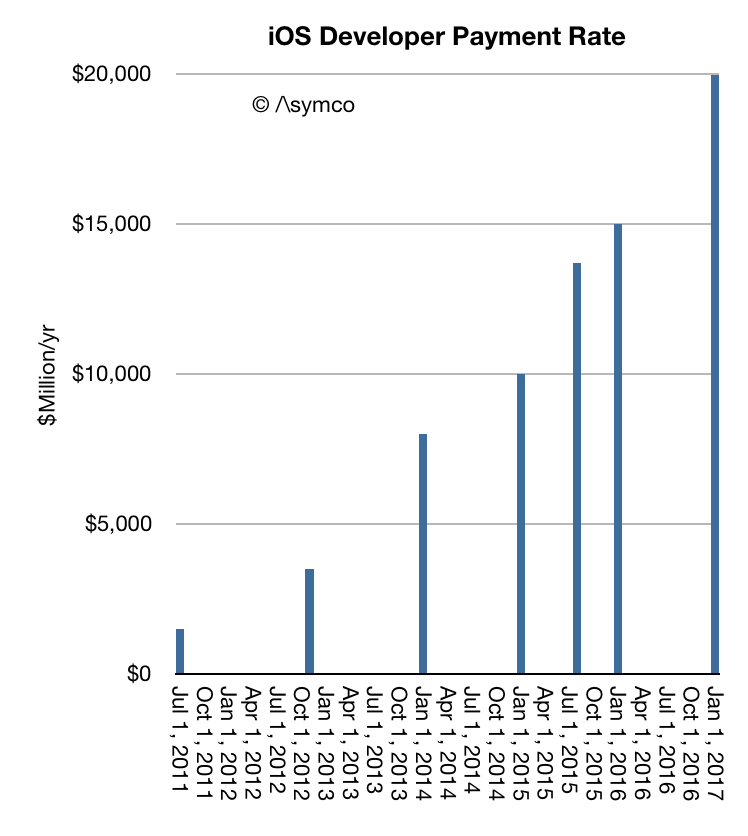
    In addition, developers building apps for iOS have been paid $60 billion. The rate of payments has now reached $20 billion/yr.

    screen-shot-2017-01-11-at-9-41-29-pm

    Not included in this payment total are "mobile-first" or "mobile mainly" businesses such as FaceBook, Twitter, Linkedin, Tencent, YouTube, Yahoo, NetEase, Pandora Radio, Google Search, Baidu, Google Maps, Gmail, Instagram, Amazon, eBay, JD.com, Alibaba, Priceline, Expedia, Salesforce and Other Enterprise Software, Ride Sharing Apps, AirBnB and many other services which monetize independently of the App Store.

    I estimate that the cumulative revenues enabled by iOS across these businesses have exceeded $500 billion, with a rate of revenue soon to reach $300 billion/yr.

    The revenue numbers can only hint at the change in behavior among users. An iPhone is unlocked 80 times a day. Assuming 600 million devices in use there are 48 billion sessions on iPhones every day. 17.5 trillion sessions every year. It is these instances of interaction and engagement which are desired by all businesses built on top of the ecosystem.

    These instances of engagement must be multiplied by the quality of the customers which Apple captures. iOS users spend more and are more loyal than those on alternative platform thus qualifying the platform as "premium" and thus adding to its value in the eyes of developers, content producers and service providers.

    As the install base of iOS increases and as users hire the devices to do more and spend more time with them the virtuous cycle of value creation will continue and accelerate.

    There is a temptation to think that such a business is fragile and will be disrupted. Challengers appear daily and the number of iPhone "killers" is not measurable. One can cite the billion users of Nokia phones which defected. One can cite the loyalty of BlackBerry users that evaporated. One can even cite the juggernaut of Windows and how it became impotent. One can cite the vast number of Android devices offered at low prices.

    But there are reasons to believe that the iOS empire is far stronger and resilient.

    Unlike Nokia's phones, Apple's product is an ecosystem with network effects and dependencies on software and services. It's also a monolithic product with a singular interface and form factor.

    Unlike BlackBerry, the iPhone does many jobs--too many to count. Indeed the iPhone evolves and changes its core value over time.

    Although different in many ways from Windows there are strong similarities in terms of loyalty and persistence of users. iOS even developed a dominant position in enterprises. Microsoft's attempt to become a hardware company is a testament to the confluence of the two business models.

    And whereas Android was originally seen as the "good enough" iPhone, potentially disrupting it, it turns out to be the ersatz iPhone. Chances are higher that users will switch from Android to iPhone and not the other way. Again, the reasons have more to do with the ecosystem and quality of users (which are hard to measure) than with the hardware (which is easy to measure.)

    As we look toward the second decade of the iPhone, the expectation isn't one of another "big bang" but a process of continuous improvement. The market is nearing saturation so the goals must be to capture more switchers from Android. Apple has achieved this with the Mac: survival, persistence and eventual redemption.

    More exciting is the apparent expansion of a network of ancillary "smart" accessories. The Apple Watch, the AirPods, Pencil and possible new wearables point toward a future where the iPhone is a hub to a mesh of personal devices. The seamless integration of such devices is what has always set Apple apart.


  7. The new switchers

    Research · 67 comments

    During the last quarterly earnings call, Tim Cook said that Apple has seen the highest switching rate from Android ever. That there is switching isn't surprising. We've seen many surveys which show higher loyalty with iOS than with Android. But it's been very hard to spot the evidence in the data which is visible publicly. Both iOS and Android are adding users and sales for both platforms are still increasing.

    The switching effect is easier to discern when the market is not growing overall. In that situation one platform's growth has to be at the expense of another. However, some markets do show evidence of "churn" in users.

    Screen Shot 2015-08-10 at 8-10-12.52.52 PM

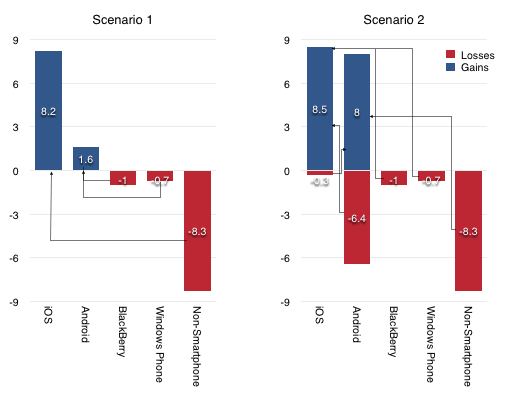
    Consider the ComScore data on US platform users (above). If we look at the last six months' data ((these data are actually three month averages)) we can count that there are about 8.2 million more Americans using iPhones than there were six months ago. At the same time, there are 1.6 million Android users. One million users left the BlackBerry platform and about 700,000 left Windows Mobile. The data also suggests that the total number of first-time smartphone users is about 8.3 million.

    Now, we could say that Android recruited all the Windows and BlackBerry users that switched (1.6 gained equivalent to 1.7 million lost) and Apple recruited all the new-to-smartphone users (8.2 million gained by Apple vs. 8.3 million non-consumers).

    Screen Shot 2015-08-10 at 8-10-12.44.31 PM

    But this is not very plausible. It's much more likely that Apple converts existing smartphone users while Android converts first-time users.

    In this scenario, 8 million non-users first started using Android while 1.7 million BlackBerry and Windows users switched to iPhone. But that leaves the question of what happened to the missing 6.3 million that Apple should have gained.

    That's where the switching number comes into the picture. This Scenario 2 is shown in the figure above and suggests that although Android gained 8 million new users, it lost 6.4 million to iPhone for a net gain of 1.6.

    Apple may have also lost a few users to Android but overall gained switchers from other platforms, mainly Android. This is what would support Tim Cook's comments.

    Thinking further ahead, as the markets mature globally, they may well evolve into the way the US market evolves today. Apple's brand promise ensures loyalty while competing platforms slowly "leak" users. If this sounds eerily familiar then you'd be right. This is exactly how the PC market behaves today.

  8. Samsung's profit center

    Research · 41 comments

    Will there come a time when Samsung will earn more profits from the iPhone franchise than from its own Galaxy product line?

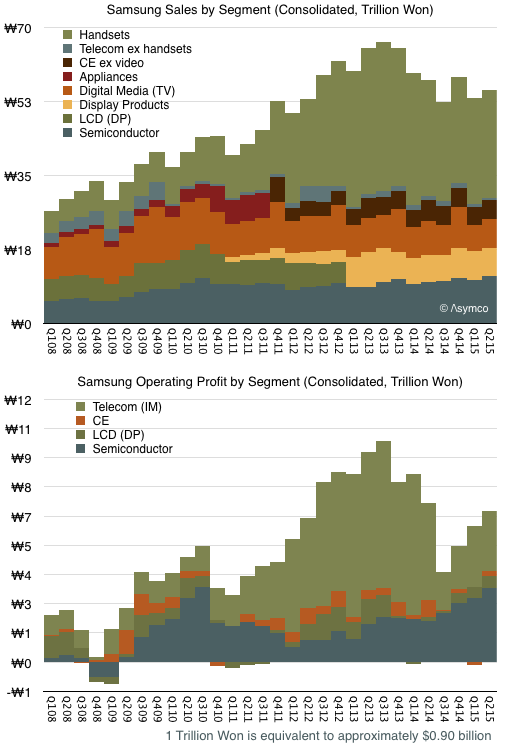
    The problem for Samsung is that although it still sells the most phones ((over 80 million but we don't have a precise figure)), and the most smartphones, the price and margins for these products are collapsing. The pattern is shown in the graphs below:

    Screen Shot 2015-07-30 at 7-30-8.20.29 PM
    Screen Shot 2015-07-30 at 7-30-8.20.22 PM

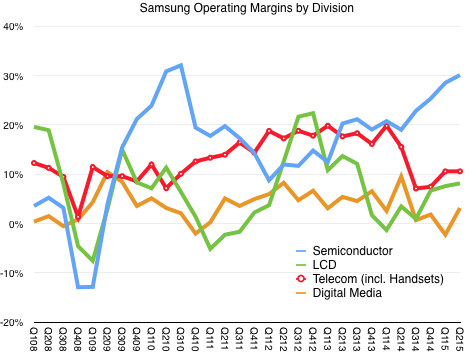
    Phone operating margins peaked in Q1 2014 at 20% but are half that level today. These margins have dropped to levels Samsung had in 2009, before the Galaxy launched and before they had any substantial revenues from smartphones.

    In contrast, the semiconductor group is growing both revenues and margins. Margins and operating profits are both 50% higher than those of devices.

    We also know that Apple is Samsung Semiconductor's single biggest customer. We can't be sure how much of the total revenue/profit comes from Apple but if the pattern continues then Apple could be the greatest contributor to Samsung's profitability in the near future.

    How could this be? Wasn't Samsung supposed to "disrupt" Apple?

    The reality is that Samsung's own smartphones are being disrupted by good-enough Android devices, typically made by Chinese brands. This low-end disruption is also affecting LG, another phone maker and Apple supplier.

    Unlike Samsung and LG, Apple is less susceptible to low-end disruption. What Apple offers is a brand promise, an ecosystem, associated products and services and what amounts to a new market. It's this parallel value network that competes with Android/Google, rather than with Samsung.

    Samsung is a supplier in the Apple network and a licensee in the Google network. As a result, it has a near monopoly position with a platform controller (Apple) and a commodity position with a platform licensor.

    Neither position is one of control, but the current market stage benefits Samsung within the Apple ecosystem more than  in Google's ecosystem. It's a situation analogous to one where Intel made both x86 chips and PCs that ran Windows. Long term it's likely that the sole-source chip business does a lot better than the multi-source systems business.

    That should be a warning to others who hoped to survive as Android OEMs. They don't have semiconductors to sell to Apple.


  9. iPhone, killer

    Research · 253 comments

    Screen Shot 2015-05-13 at 5-13-8.20.01 AM


    Searching for "iPhone killer" returns millions of hits. It's hard to remember any phone/product/service/platform/initiative/merger/startup which was not at some point considered an iPhone killer. A sampling is offered here.

    In reality, the killers seem to have all faded away while the iPhone continues. We could just shake our heads and move on, but a deeper analysis is possible. Take a look at the graph above. Note that iPhone's (and hence Apple's) ascent has not caused decline in its nominal competitors. When seen in the context of the graph above, the success of the iPhone has in fact been complementary to those companies who would be its killers.

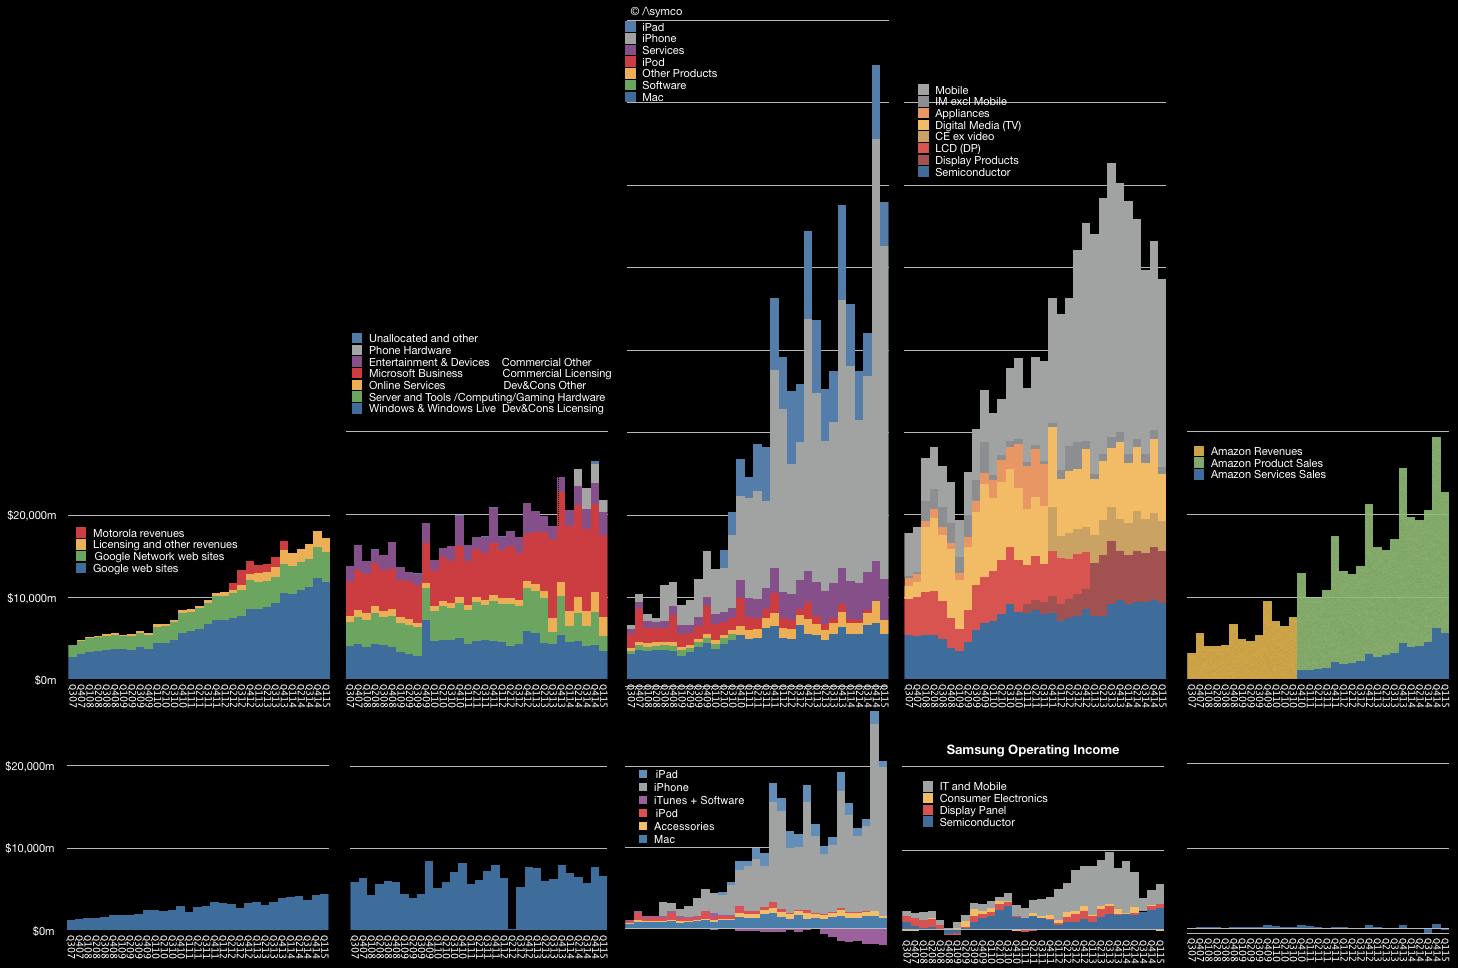
    Consider that the iPhone drives a large portion of Google's revenues as it is the home to many Google services and engagement through the iPhone is higher than any other platform, including Google's own. iPhone users tend to make better customers. In exchange Google pays a great deal for traffic acquisition on iOS devices. The placement of search on Safari is probably the biggest single cost item on Google's income statement ((Estimates are a few billion dollars a year.))

    The iPhone example drew Google to build Android as a facsimile and that, coupled with Brobdingnagian spending on marketing, led to Samsung's Galaxy success. That success seems to have peaked and the brand is now a victim of low-end disruptors which copied it and the iPhone in turn. However, Samsung electronics benefits from the iPhone in terms of its semiconductor division. Apple is Samsung's biggest customer and the semiconductor division is now the largest source of operating profits.

    The explosion of Android has led to IP licensing revenues for Microsoft and now Microsoft is extending its software applications to iOS, hoping to participate in the iOS ecosystem rather than competing with it. The time may come when Microsoft shows growth from the iPhone.

    Finally, although it may seem oblique, Amazon is benefiting from the iPhone. Instead of killing it with the Fire ((presumably as a low-end disruption)), the iPhone and iPad offered much more mobile shopping opportunities to the Amazon store. Data shows that iOS leads in shopping traffic and order size precisely at a time when Amazon obtains its largest volumes. Amazon's AWS also handles a great deal of iOS-originated traffic.

    This alternate reality shows that the benefits from the iPhone revolution are broad and deep. It's not just the direct revenues (($25 billion paid so far)) from app sales on the App Store but also the creation of entire new communications modalities (Instagram, Snapchat, WhatsApp) new services (Uber, Airbnb) and the multi-billion dollar accessories markets. These benefits are largely unmeasured and therefore not visible in accounting systems. They are perceivable however.

    Users perceive the value, developers perceive the value and, in the end, the only account that matters, the brand, accrues these perceptions to grow in value.

    As the brand flourishes, the perception of vulnerability dissipates and the narrative shifts from Apple getting killed to killing it.

    It's taken eight years and 500 million loyal users but, perhaps, just perhaps, this change in perception is entering the collective consciousness.


  10. The 2015 "Sleeper Ideas" List: Trends, Stocks, And Private Companies To Watch - Forbes

    Research · 16 comments

    My choices:

    1. Cyanogen. This company should develop a credible path for AOSP (non-Google Android) especially in India. I expect a lot of traction as OEMs who embrace Android reject Google.

    2. iPad. Not as a consumer product but for the Enterprise. The iPad grows up into a solid product for business while being replaced by phones in consumer “jobs to be done”.

    A few more ideas are listed here: The 2015 "Sleeper Ideas" List: Trends, Stocks, And Private Companies To Watch - Forbes.


  11. Faster Followed

    Research · 76 comments

    Samsung's smartphone ascent was breathtaking. From having essentially zero market share in the category in late 2010 to becoming the largest vendor took less than two years. In doing so it grew to become the largest phone vendor, smart or not--a goal which eluded them during the previous decade of effort. Samsung went on to capture not only the lion's share of unit volumes, they also took almost all the profits in the Android mobile phone market.

    And in a market filled with competitors. Literally hundreds of vendors and thousands of products were available at every conceivable price point. Samsung did away with HTC, LG, and Motorola. HTC, the first Android vendor (and first to market with Windows Mobile), Motorola, Google's launch partner in the US and "Droid" brand partner (and future owner).  Google's own Nexus products. Samsung Galaxy ruled them all.

    Galaxy swamped the Chinese market and the Indian market, the largest in the world. They were so powerful that they were singled out both by Microsoft and Apple for IP royalties.

    All within two years or the average life-span of one smartphone.

    But something went wrong in 2014. Growth in shipments suddenly stopped. This was not a problem with the overall market, which kept growing. The slowdown did not affect other vendors, especially the up-and-coming Lenovo and Xiaomi and the second and third tier vendors whose names are  known only in the local markets they serve.

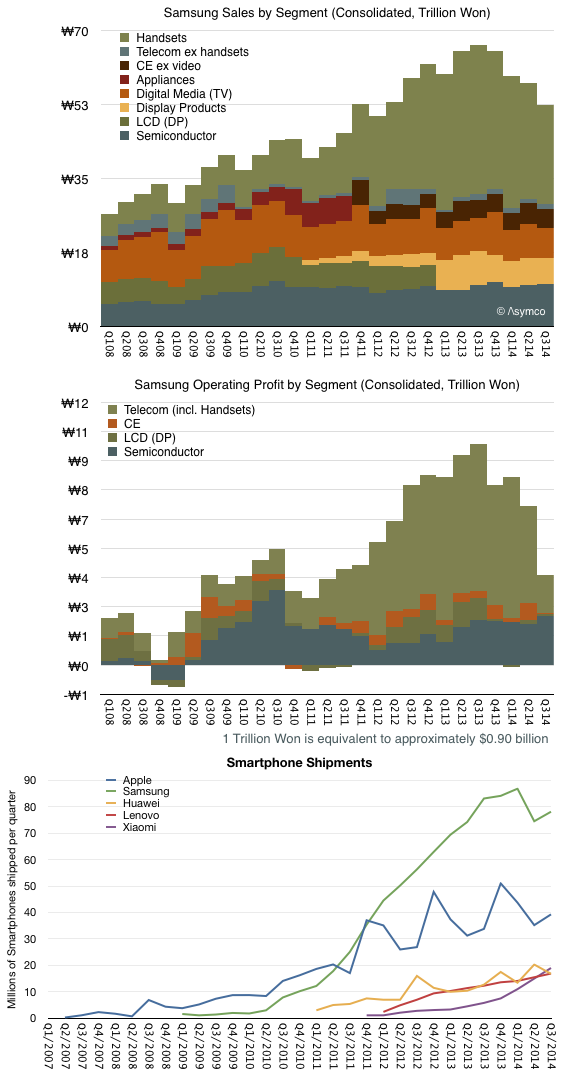
    The result of this slowdown is shown in the following graphs:

    <>

    Screen Shot 2014-10-30 at 10-30-4.11.19 PM

    Note how the wobble in units shipped was foretold by slowing revenues and an even more profound effect in profits. Peak revenues and profit occurred in Q3 2013 while volumes continued to grow until Q1 2014. Even in the last quarter, shipments are at near year-ago levels. Profits however have dropped to 2011 levels.

    At the same time, Apple shipments continue to grow as do those of Lenovo, Huawei and Xiaomi. Xiaomi in fact is growing in a trajectory eerily parallel to that of Samsung from 2010. It just hit the same level of volume that Samsung had in Q2 2011. And Samsung had been making phones for decades while Xiaomi is barely two years old.

    Having seen a boom/bust rise/fall pattern with other vendors (e.g. Nokia and Blackberry) it should behoove us to ask what are the causes of success and failure in this business. Samsung management suggests that they perceive speed of action, product mix/portfolio choices and hardware experimentation are the keys to their success.

    However, competitors which are rising rapidly (at the expense of Samsung) are not acting in the same way. Xiaomi is patterned as a Chinese Apple, offering design, brand, attention to detail and software as differentiation. Lenovo is building on its computing roots and expanding with acquisition. Huawei and ZTE leverage networking business and operator relationships.

    The crisper answer to causality may be that the market is bifurcating into an "upper" market where new jobs-to-be-done are being explored with integrated offerings (Apple and Xiaomi) and a "lower" market which is in the throes of low-end disruption. Both are competing with non-consumption though the upper market is service non-consumption and the lower market is feature non-consumption.

    Samsung is stuck right in the middle ((Just like Nokia was.)) It defines itself on the basis of what exists. It competes only within a defined market and positions itself agains existing products. They claim to be "better" than the competition and make the point loudly with their advertising. However, being better is never a solid foundation. At some point you'll be either good enough or someone more agile will be faster than you.

    At some point the fast follower exposes themselves to being faster followed. Better to find new lands to conquer.