The Re/Code conference begins this week, and Apple executives Eddy Cue and Craig Federighi will be answering questions from Kara Swisher and Walt Mossberg.
Here are some questions I hope they ask:
For Eddy Cue:
Why is there no app store for Apple TV? Even though the product is running essentially the same hardware and software as the iPhone and iPad and iPod touch and even though it connects to the iTunes stores, there is no option for developers to build apps for it or for consumers to use their TVs to run iOS apps. I might add that it’s been seven years since the platform launched and that’s a long time to wait.
As Amazon has been granted a monopoly on the distribution of ebooks by the US federal government, why not compete by selling ebooks as apps? Apps were used as ebook containers well before the iBookstore launched and there were tens of thousands of “book apps”. Why not encourage authors and publishers to build apps by offering tools which make it easy to do so? I might add that if you do this for authors, why not do it for musicians and video producers? Why have separate stores for different media when they are all just content?
YouTube is becoming the TV of choice for millions. Before it becomes that choice for billions, what are you doing to encourage user-generated video content distribution through your ecosystem?
Apple’s Services revenues are growing remarkably quickly. The number of users is over 800 million. Do you see an opportunity for services to become a more independent business at Apple? In other words, why not bring iTunes to Android?
For Craig Federighi:
Marc Andreessen uses the phrase “Software is Eating the World” to describe the disruption that software-enabled businesses are having on those who don’t depend on software. You are the head of software at Apple; what’s on your plate? In other words, what do you see the opportunity for software at Apple beyond enabling device sales? I might add that although you are leading Software Engineering at Apple, Software and Services are part of Eddy’s organization. Does this separation make sense?
It’s likely that iOS will be used by more people than Windows in the near future. What do you see as the obstacles to iOS replacing Windows for what most business users use daily?
If you believe that iOS can replace Windows (at least in some tasks), do you think the iPad will ever replace the Mac?
This was originally posted on LinkedIn on May 28th.
iPad sales were unexpectedly slow in Q1. Tim Cook explained it as follows:
iPad sales came in at the high end of our expectations, but we realized they were below analysts' estimates and I would like to proactively address why we think there was a difference. We believe almost all of the difference can be explained by two factors.
First, in the March quarter last year we significantly increased iPad channel inventory, while this year we significantly reduced it.
Second, we ended the December quarter last year with a substantial backlog of iPad mini that was subsequently shipped in the March quarter whereas we ended the December quarter this year near supply demand balance.
We continue to believe that the tablet market will surpass the PC market in size within the next few years, and we believe that Apple will be a major beneficiary of this trend.
Tim Cook went on to say "over two-thirds of people registering an iPad in the last six months were new to iPad"
In a later discussion, Luca Maestri said:
As Tim explained earlier, our iPad results and the comparison to the March quarter last year were heavily influenced by channel inventory changes. Specifically, this year we sold 16.4 million iPad into our channel and sold through almost 17.5 million, reducing our channel inventory by 1.1 million units.
Last year, we sold over 19.4 million iPads into our channels and sold through 18 million, and therefore increased channel inventory by 1.4 million units. As a result, the year-over-year sell through decline was only 3% compared to the sell-in decline of 16%.
We exit the March quarter with 5.1 million of iPad channel inventory which left us within our target range of four to six weeks. iPad continues to lead all other tablet by far in terms of user engagement, size of ecosystem, customer satisfaction and e-commerce.
In a later Q&A:
Steven Milunovich - UBS Securities: Tim, I understand that the iPad is not as weak as it appears on a sell-through basis, but still it's relatively flat over the last year in terms of sell-through. What are your thoughts in terms of why that is and can that accelerate with Office on the iPad going forward?
Tim Cook - CEO: It's a good question. Let's talk about iPad a little more than we did in the comments.
When I backup from iPad, here is what I see. It absolutely has been the fastest growing product in Apple's history, and it's been the only product that we've ever made that was instantly a hit in three of our key markets, from consumer to business including the enterprise and education.
And so, if you really look at it in just four years after we launched the very first iPad, we've sold over 210 million, which is more than we or I think anyone thought was possible at that period of time. It's interesting to note that that's almost twice as many iPhones that we'd sold in a comparable period of time, and over seven times as many iPods as we'd sold in the period of time.
So, I think it's important to kind of to put that in perspective. We've come a long way very, very quickly. Looking at it by market a bit, which I think is important. I think Luca mentioned a little bit of this in his comments. In the education market in the U.S., we have a 95% share. So the focus in education is on penetration, is on getting more schools to buy and my belief is the match has been lit, and it's very clear to the educators that have studied it is that student achievement is higher with iPad in the classroom than without it. So I'm confident we've got a really great start in education far beyond the U.S. now. This is happening in many, many parts of the world.
In the enterprise market, we're seeing virtually all, 98% of the Fortune 500, they're using iPad. We're seeing – according to Good Technology who looks at activations of tablets – the latest data we have from them is that 91% of the activations of tablets in enterprise were iPads. So this is also an astonishing number and many of those enterprises are writing apps that are key proprietary apps for running that business, and this is great for that company because they're more productive as a result of that. So once again, just like in education in a way, what we have to do in enterprise is focus on penetration, it has to be deeper and broader.
But in terms of having people begin the process, beginning writing apps, we're doing a pretty good job of that. In the retail market, if you look at the U.S. as a proxy, the NPD numbers for March just came out a few days ago and we had 46% share and embedded in that 46%, there's a lot of things in there that I personally wouldn't put in the same category as iPad, and that are weighing the share down. It's certainly a market we wouldn't play in and in a type of product you would never see an Apple brand on. So, we feel like we're doing well there.
Office; I believe does help. It's very unclear to say how much. I believe if it would have been done earlier, it would have been even better for Microsoft frankly, there is a lots of alternatives out there from a productivity point of view, some of which we brought to the market, some of which many, many innovative companies have brought. But I do see that Office is still a very key franchise in the enterprise, in particular. I think having it on iPad is good, and I wholeheartedly welcome Microsoft to the App Store to sell Office. Our customers are clearly responding in a good way that it's available. So, I do think it helps us particularly in the enterprise area.
The other things you look at on iPad that are just blow away its customer [satisfaction], is 98 [percent]. There is almost nothing in the world with a 98% customer sat and the intention-to-buy numbers look good with two-thirds of the people planning to buy a tablet or planning to buy an iPad. The usage numbers are off the chart, far and exceeding Android tablets, four times the web traffic of all Android tablets combined.
So, when I backup from all of these, I feel great. That doesn't mean that every quarter, every 90 days is going to be a number that everybody is thrilled with. But what it means to me is that the trend over time – over the arc of time, that things look very, very good, that iPad has a great future. And of course the thing that drives us more than any of this are the next iPads if you will, the things that are in the pipeline, the things that we can do to make the product even better, and there is no shortage of work going in on that nor any shortage of ideas.
So when I backup from all of this, I can't help but still be extremely excited about where we are. I think we did a reasonable job of explaining what we think the disconnect was between what we had expected, which we hit it at the high end of our expectation and the street's view of this one. I believe the vast majority of it is that first thing was just channel inventory that maybe we should have been even clearer on last quarter to take into account. But I'm very bullish on iPad.
That's quite a long set of explanations for was essentially was a flat quarter for the iPad. I can't add more to this, but I do want to focus on the bold part of the quote above. "But what it means to me is the trend over time – over the arc of time, that things look very, very good".
How can we see the long arc of time?
The tool I've used for this is the measure of penetration. Historically products which become "mainstream" or widely adopted follow an S-curve during that adoption. The curve is remarkably predictable given a limited set of points. I've discussed how the adoption of smartphones is predictable in the US, EU5 (( And UK specifically and several broader global regions)) and how even particular platforms might be predictable in the context of rates of adoption.
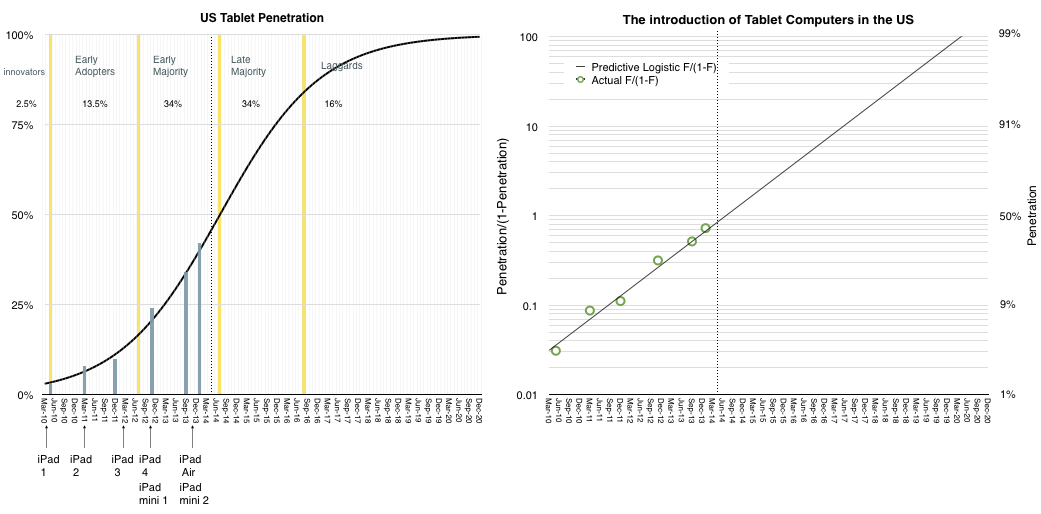
We are fortunate that data also exists for tablets. The Pew Research Center's Internet & American Life Project has published a short history of tablet adoption in the US. I've plotted this data and imposed an S-curve on the data which fits it rather closely.
The results are shown below:
In the graph on the left, the blue bars represent actual measurements of penetration (18+) while the black curve represents a best fit for the adoption rate.
Note that I've added the launch dates of all the iPad models and sectioned the curve into adopter categorization on the basis of their willingness to adopt.
I've also drawn a dotted line on the point where we are in the present.
In the graph on the right I've also duplicated the data using the transform of penetration to log scale penetration/(1-penetration). This shows the relative fit of the data in a more visually comfortable way.
The usual caveats apply:
This is US only
These are adults only
The iPad is not the only competing product
Nevertheless, this is a fairly strong proxy for the market. First, because the US has been leading adoption of almost all consumer product categories in history. Second because adults are a representative sample of users and third because iPad is market share leader.
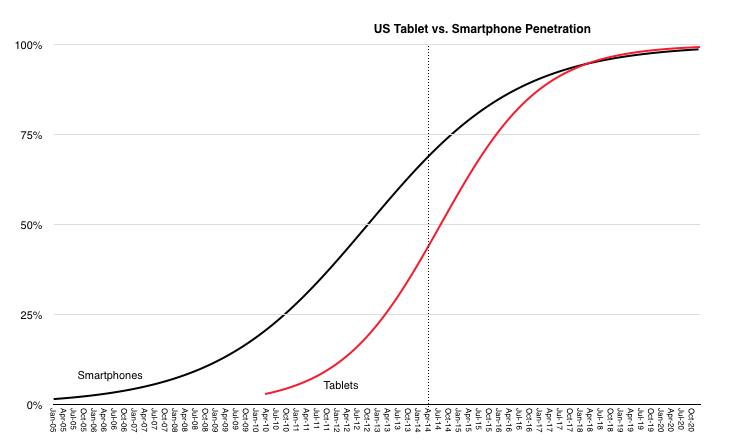
What the penetration data shows is an extremely rapid rate of penetration. In comparison with the smartphone, the tablet is rising much faster. This is shown below:
They are likely to saturate at around the same time but the tablet started much later.
So how does this explain the slowing iPad sales?
It's possible that saturation for tablets could come well below 100% and that we are on a different curve than the model above. However, the ubiquity of the product and broadness of appeal, even within non-consumer (i.e. education and enterprise) makes it difficult to reconcile. In addition, the penetration data is self-evident. It's improbable that penetration goes to 42% as it just did, and then stops suddenly. These decelerations of adoption have been observed historically but they are usually explained by cataclysms such as wars and economic contractions, neither of which are affecting the US right now. If a product solves an important "job to be done" then it gets adopted in a predictable way by a given population.
The anecdotal evidence provided by the company and others coupled with the survey data collected for the population of US users implies that the iPad is solving numerous important jobs and is therefore continuing on a predictable trajectory and that a discontinuity has not occurred.
Management started by saying the iPad sales volume was not surprising to them and that they have not changed their long-term expectations. The penetration data seems to support their confidence.
In the postmodern computing world that we live in, the measure of success isn't revenue or profit or units sold but the number of users that an ecosystem can attract. Therefore the monthly active user (MAU) unit of performance seems to be in vogue right now. E.g.:
Facebook claims Messenger has more than 200 million MAUs
WhatsApp has 500 million MAUs, 48 million of whom are in India
Line last month announced that it had 400 million users (active or not)
WeChat claimed 355 million MAUs
Viber claims 105 million MAUs
Startups are aggregating these millions of MAUs in order to obtain valuations for raising capital ((It's been said that it's difficult to get funded with only 10 million MAUs)) and the faster the growth in MAUs the more "successful" the company is considered.
When companies are acquired it's common to take the transaction value and divide it by MAUs to get an idea of "what an user is worth". This is because there are no revenues to measure and MAUs are taken as a proxy. However, the process by which a MAU becomes a dollar of profit is, to put it kindly, circuitous.
For most (all?) it's not yet clear how it happens especially since not all MAUs are created equal and MAU loyalties can change rapidly and if we added all the projected revenues each MAU will contribute to each app on her device we might reach some absurdity. In actuality, today, for the companies listed above, there are no revenues at all directly from their services.
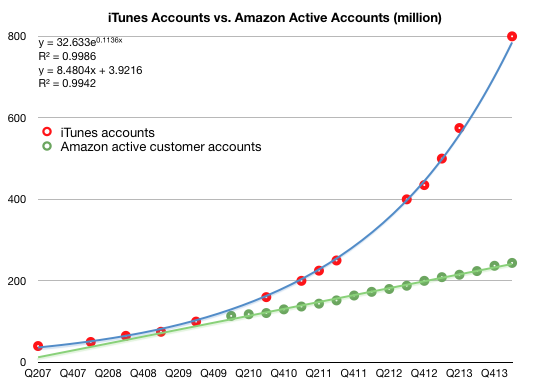
In violation of this convention, there are some companies which manage to obtain revenues from their users. Two such are Apple and Amazon. In the last quarter Apple reported having 800 million iTunes accounts. ((adding, for some unknown reason, that most of them have credit cards.)) These aren't MAUs since the activity level is not noted, but we do know how much is spent on iTunes and services. In addition, Amazon cites 244 million active customer accounts representing accounts which generated purchases within the last 12 months.
This allows us to compare Apple and Amazon in terms of accounts, revenue per account, and, via some analysis, even profitability per account.
The following graphs tell this story. First, the total number of accounts:
Note that I added trend lines to both graphs and their formulas.
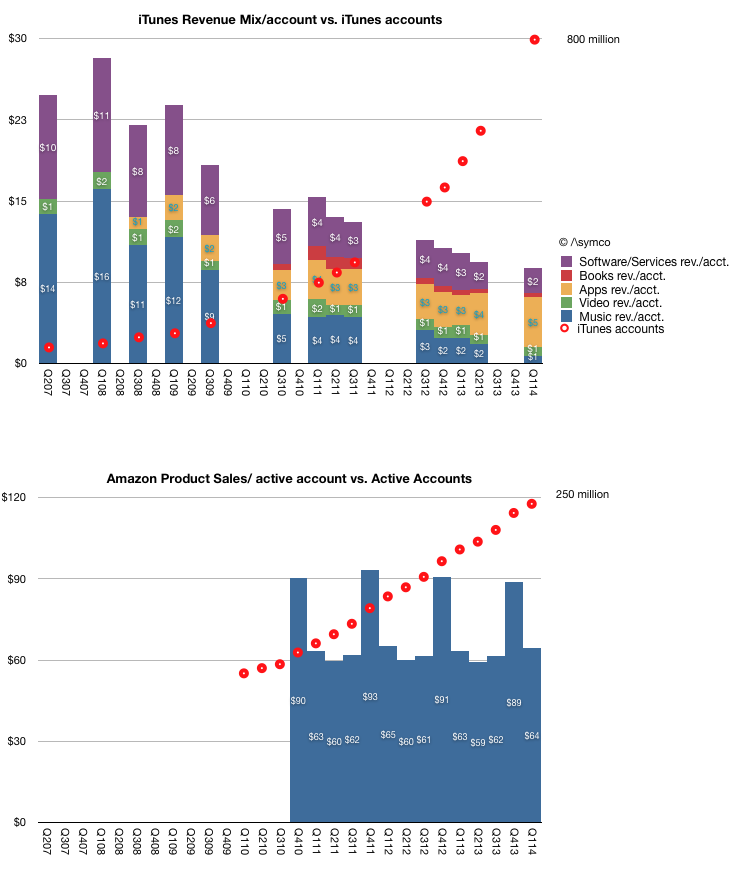
The following are the revenue per account for iTunes (further broken into estimated iTunes segment revenues per account.) and for Amazon. Note that the vertical scales are different.
This view shows just how different the economic value of users can be. In the case of Apple, it's growing its user base at (literally) exponential rates. The revenues per user does, understandably, decline. This is because new/later users don't spend as much as early users. There might be some stability toward the later stages of adoption in revenue per user. The other point about iTunes data is how the mix of revenues has shifted from music to Apps and Services pointing out how users can be migrated across revenue sources over time.
In the case of Amazon it's growing its user base at a linear rate (note equation). The revenue per account remains very steady however.
Broadly speaking, it would seem logical that the speed of user growth has an effect on the quality of those users. This relationship should guide further thinking about the quality of hundreds of millions of users acquired within a few months.
Apple's user growth is a function of expanding its device portfolio and distribution. Apple has shown that there are limits this type of growth. Achieving 830 million or so iOS device sales within 7 years is an amazing feat and one can forgive not having achieved billions more since they managed to obtain significant hardware and service/content revenues from most of them and that those who reached higher figures more quickly didn't manage the same revenue per user.
Amazon's user growth is a function of expanding its logistics and merchandise mix. This is also not easy to do globally. Arguably, Amazon cannot scale in the exponential rates seen by Apple or the other MAU aggregators because it has to depend on trucks and roads and regulators to complete most of its sales.
I suppose, in conclusion, that there is no "right" or "wrong" business model for a user base. Both Apple and Amazon are doing well in building their customer bases and creating loyalties which will serve them well in the future. However whereas there is no right or wrong revenue structure per user, it seems to me that there ought to be some such structure. In most cases this remains a matter of faith rather than reason.
In this inaugural episode we open with the biggest question facing the biggest technological innovation of our time: the limit to growth of the Internet. The Internet is the backbone of our post-industrial society as much as the railroad was the backbone of the industrial revolution. Even more so, the diffusion of internet consumption is the fundamental engine of growth at a time when industrial economies are all mired in syndromes of underinvestment and misallocation of resources.
And so it matters greatly if and when the Internet will "inflect" in growth, going from acceleration to deceleration. Mobile computing sustained this acceleration, bringing computing and connectivity to the billions for whom the PC would always be beyond reach. But even with the expansion of device-based usage limits are in sight.
The implications could be profound. Frothy valuations and optimism could evaporate. Venture Capital could find few exits and the "second Internet Bubble" could burst. On the other hand, maybe the data shows that opportunity is largely unmet. Quantity of users is but one proxy. How can growth and business model innovation continue?
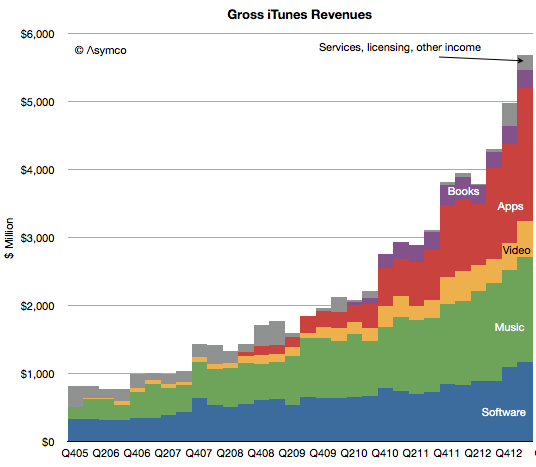
The increase in net sales of iTunes, Software and Services in the first quarter of 2014 compared to the first quarter of 2013 was due to growth in net sales from the iTunes Store, AppleCare and licensing. The iTunes Store generated a total of $2.4 billion in net sales during the first quarter of 2014 versus $2.1 billion during the first quarter of 2013. Growth in the iTunes Store, which includes the App Store, the Mac App Store and the iBooks Store, was driven by increases in revenue from App sales reflecting continued growth in the installed base of iOS devices and the expansion in the number of third-party iOS Apps available. Net sales of digital content, including music, movies, TV shows and books, from the iTunes Store was relatively flat in the first quarter of 2014 compared to the first quarter of 2013.
During the last quarter Apple changed the pricing for iWork and OS X to zero ((OS X server is still priced at $20 and iWork for previously unlicensed devices and computers is still priced above $0)).
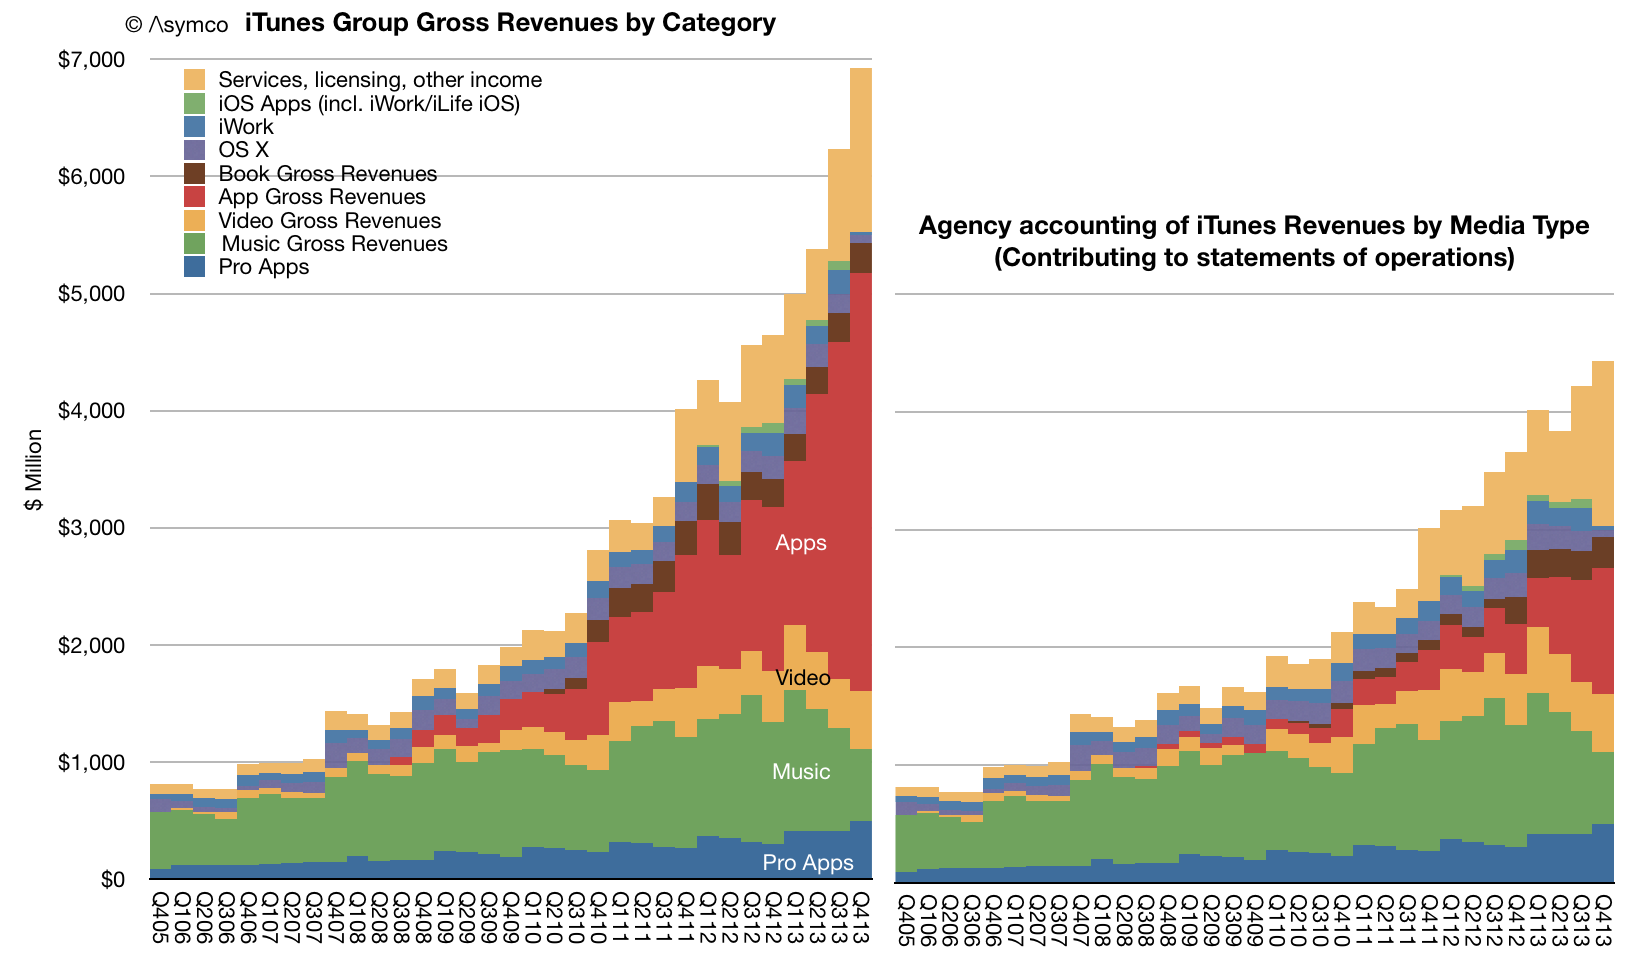
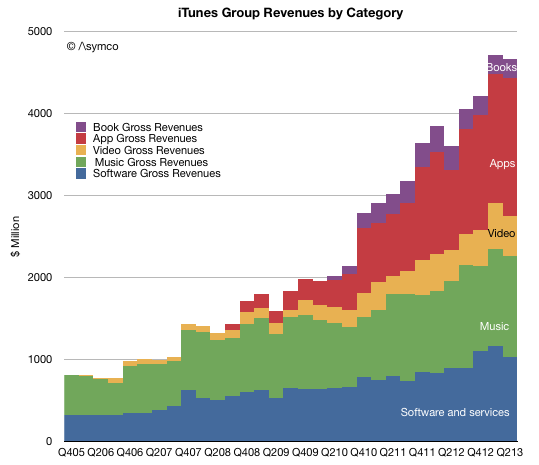
I estimate the net effect to have been a reduction in revenues from those software titles of about $350 million for the quarter. Nevertheless, increases in services and app revenues means that the iTunes total reported revenues increased to a new record.
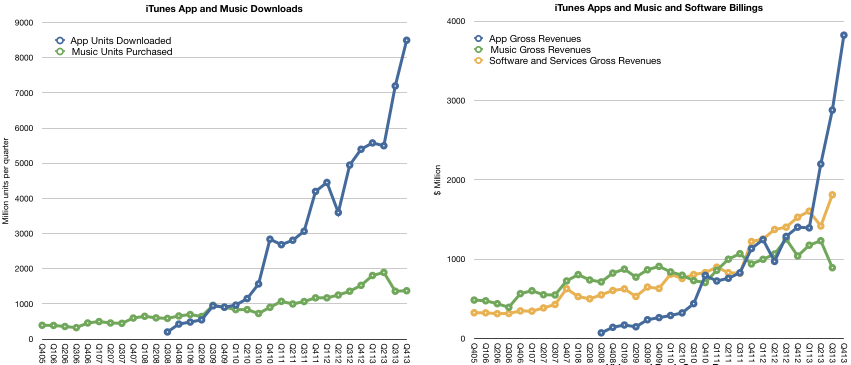
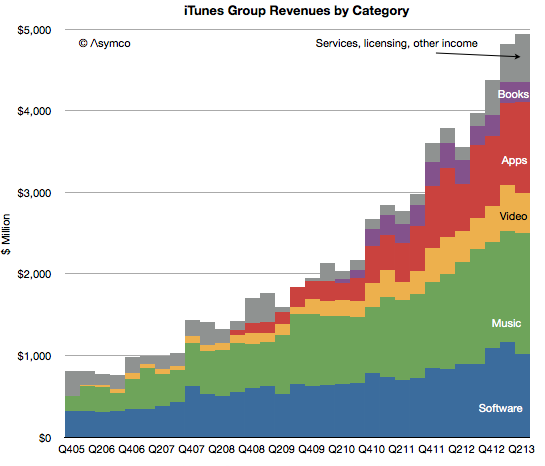
The total with estimated contributions by media and service components is shown below right.
Note that revenues do not reflect total billings. As Apple reports only the 30% of App transaction values, the full iTunes/Software/Services transaction values are shown in the above graph on the left.
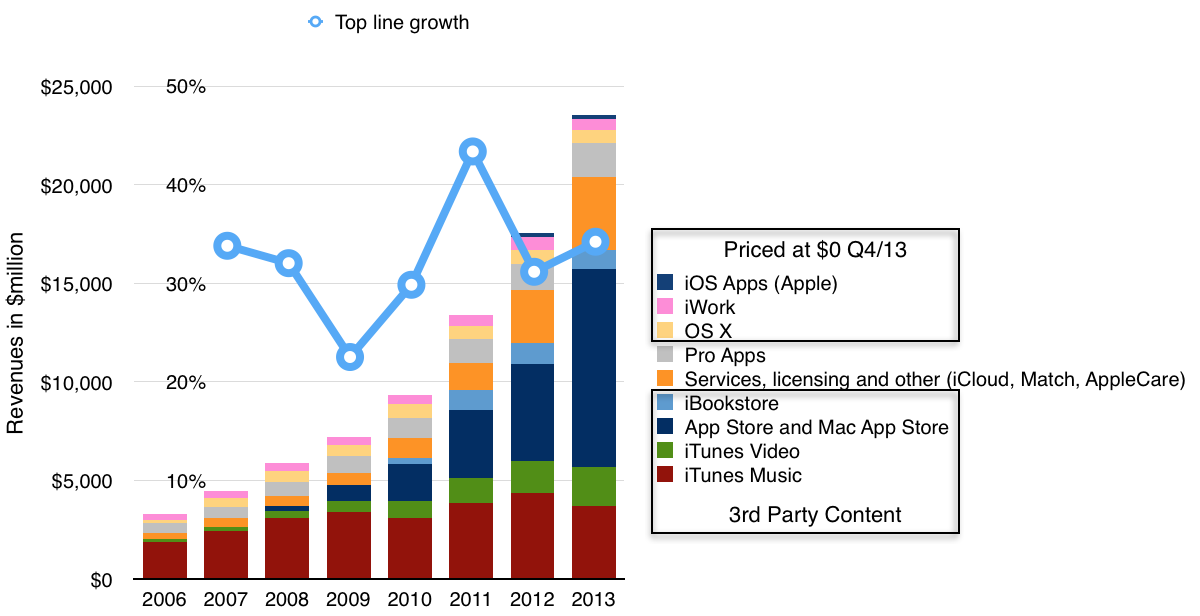
The "gross" revenues are now nearly $7 billion per quarter. On a yearly basis the iTunes/Software/Services group had gross revenues of $23.5 billion with growth of 34% y/y.
Other estimates for full year 2013 growth are:
Third party content +46.6%.
Music downloads -14%
Video +19%
Apps +105%
Books -9%
Services +37%
Pro apps +29%
OS X -8%
iWork and iLife -8%
Although iTunes/Software/Services are not usually included in a "sum-of-the-parts" total contributing to Apple's overall enterprise value, the scale of volume and value of transactions is becoming harder to ignore.
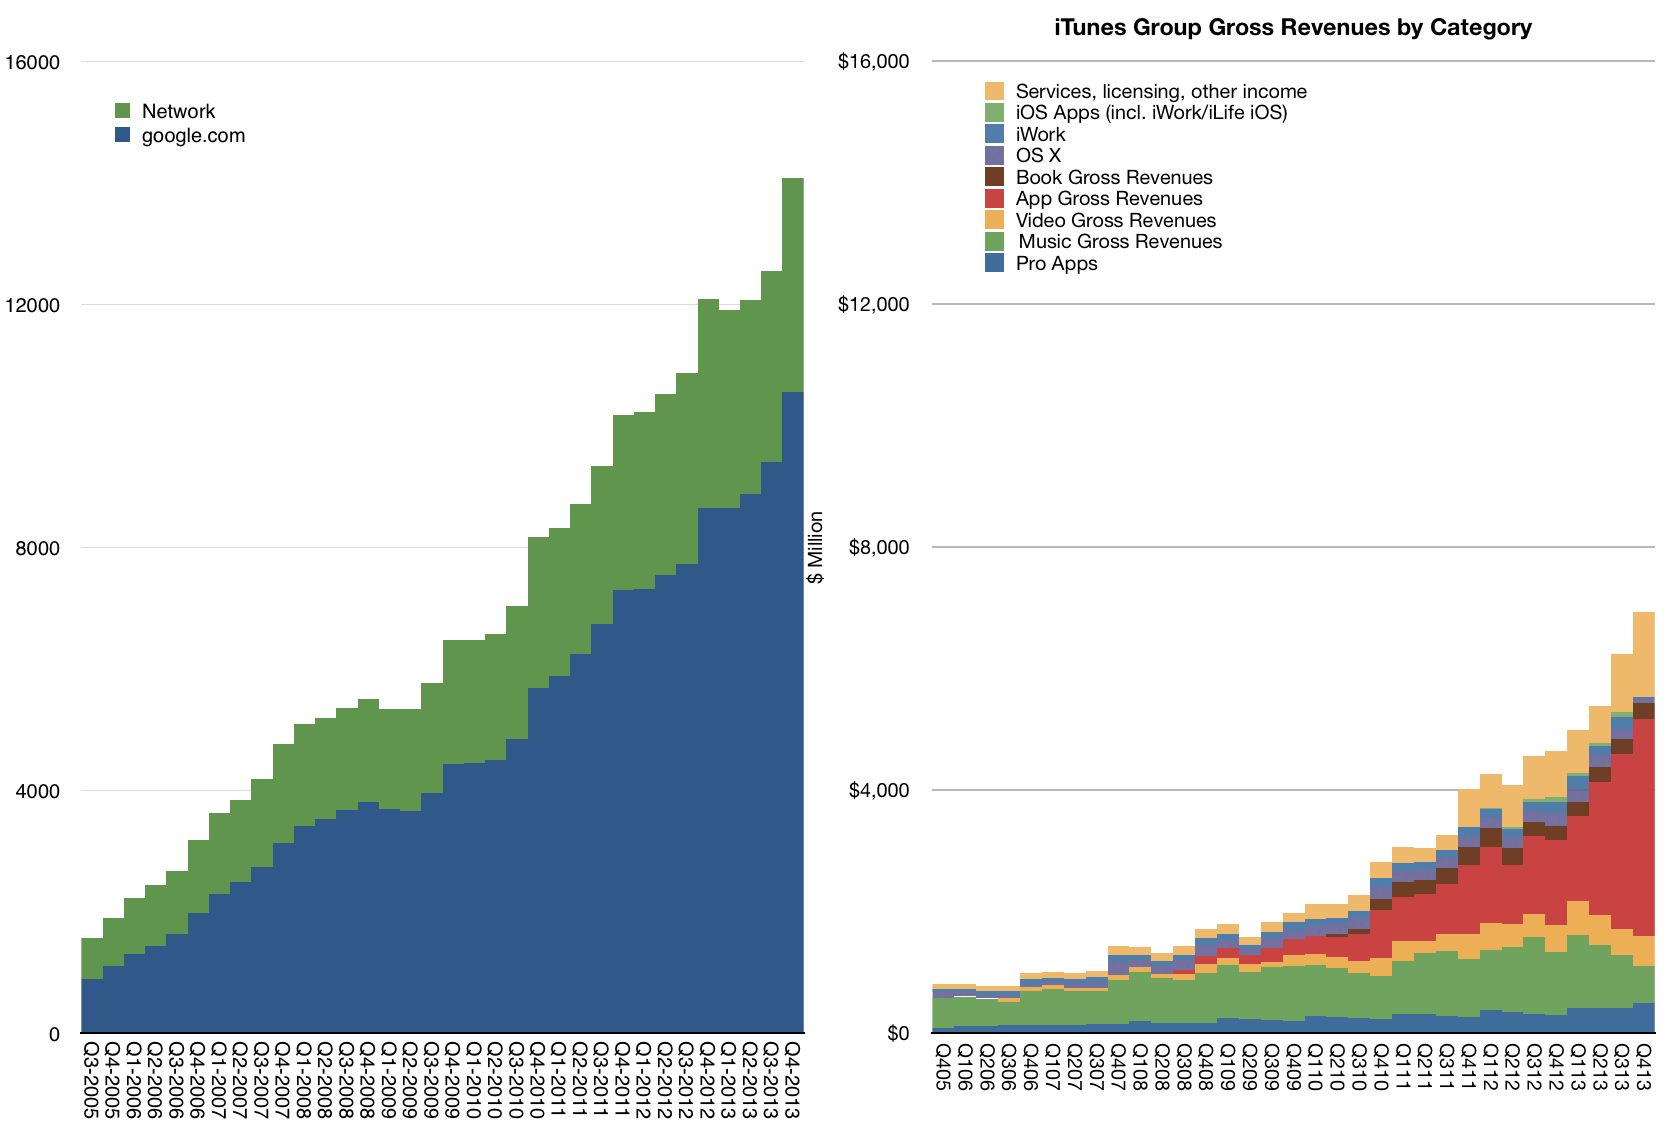
To illustrate this, I plotted the history of gross iTunes revenues vs. Google's search business ((Excludes Motorola and "Other" segments as reported by Google))
On a yearly basis iTunes/Software/Services is nearly half of Google's core business and growing slightly faster.
The iTunes "empire" of content and services would be ranked as number 130 in the Fortune 500 ranking of companies (slightly below Alcoa and above Eli Lilly).
Exactly one year ago, on January 7th, 2013, Apple announced that the App Store reached 40 billion downloads ((Unique downloads excluding re-downloads and updated)). Here are additional data points from that release:
20 billion downloads in 2012
2 billion downloads in December 2012
500 million active iTunes accounts
775,000 apps
sold in 155 countries
300,000 native iPad apps
over $7 billion in developer payments
This year, on January 7th, 2014, Apple announced a new set of data points:
$10 billion spent on the App Store in 2013
$1 billion in December 2013
3 billion app downloads in December 2013
1,000,000 apps
sold in 155 countries
500,000 native iPad apps
$15 billion in developer payments
The obvious:
225,000 apps were added in 2013
200,000 native iPad apps added in 2013
App download rate for December increased by 50%
No new countries were added in 2013
$8 billion was paid to developers in 2013 (more than in all previous years put together)
The less obvious:
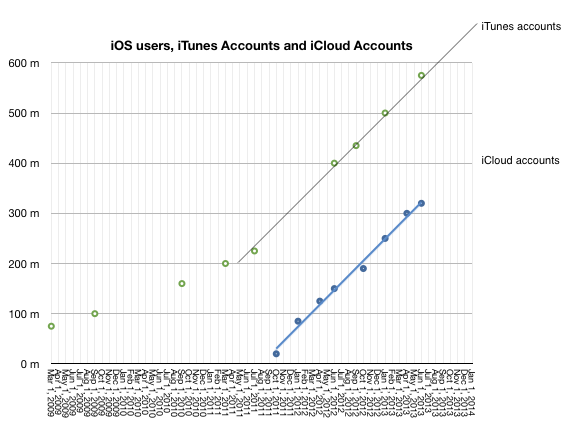
No update on iTunes accounts this time but there was a mid-year update (June 10th) which put iTunes accounts at 575 million. iTunes accounts have grown linearly since mid 2011 so it's quite probable that the current total is above 650 million.
Given mid-year updates to earnings/revenue and the October 22nd update that 60 billion total apps were downloaded and the May 15th update that 50 billion total apps were downloaded it's possible to estimate with confidence that there are now 68 billion total apps downloaded and that were about 27 billion app downloads in 2013. This is an increase of 35% in the yearly download rate. As noted above, the December growth alone was 50%.
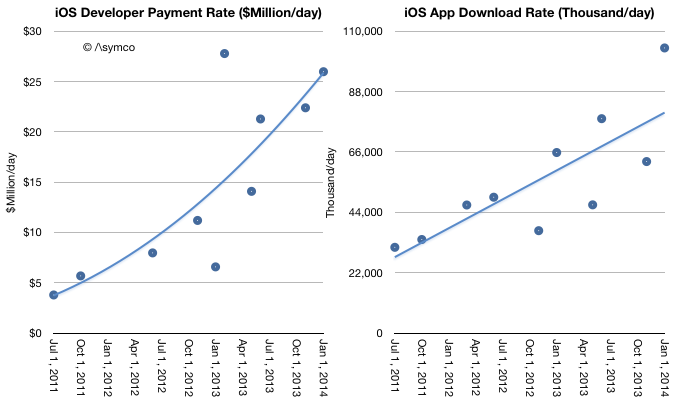
Given mid-year updates on developer payments, and download rates we can estimate revenues per app have increased. As in-app purchasing has taken off it's no longer meaningful to assign a "purchase value" to each download. The rate of payments to developers is increasing faster than the download rate. Currently $26 million is paid out every day while about 100 million apps are downloaded daily. Note that the trend lines below are arbitrary:
As other reports have noted, there was a decrease in music downloads in 2013. This is also evident when backing into a download total for music given the earnings data and the above evidence of app growth. My estimates below may be overly generous for music unit downloads as they also assume lower pricing. Overall gross music revenues through the iTunes music store ((Excluding new iTunes radio and revenues from services such as Match)) are flat for the year and may even have begun declining precipitously. App revenues are more than compensating for this.
The iTunes content economy is grossing about $17.5 billion/yr. Apple's own software and services (reported as part of the iTunes segment) add another $6.2 billion/yr. The combined total of $23.7 billion/yr. is slightly lower than what Apple net sales were during its fiscal 2007 year or what Amazon sold in 2009.
A complete report on the iTunes economy and pro-forma iTunes income statement is available for purchase at store.asymco.com.
So much for the data. What is really happening?
First, it's tempting to look at music and suggest that music downloads are suffering from streaming, just as it was tempting to suggest that CD buying was suffering from piracy (and later, downloads.) But this is falling into the trap of defining a product's use by the metrics used to measure transactions. These metrics are but a proxy for what consumers are actually doing with their time.
Consumers have a fixed time budget, a more rigid constraint than their spending budget. Competition for a slice of a consumer's time budget is far tougher than competition for a slice of a consumer's wallet. So what's amazing is that apps have successfully grabbed a share of this time budget. I believe that the reason they succeeded is that they initially fit into niche time slices that were previously unoccupied. ((Interestingly, this was how music, especially digital music as enabled by the iPod, gained traction))
Downtime or "boredom" was filled with app interaction. This includes some social media consumption. These are not immersive experiences. They are "casual", inconsequential and trivial. At first anyway. And that's the rub. As apps enter a consumer's world they initially take on non-consumption, which is easy to beat. But as the experiences become increasingly compelling they "move upmarket" and compete more aggressively with existing media consumption patterns.
For instance, one might allow casual gaming to take root in non-consuming contexts such as commuting, waiting, and escaping time niches. But if the experience becomes addictive, the gaming takes over time previously spent watching TV or using console games. The same can be observed for app-based experiences of social media, shopping and chatting.
This is the insidious march of a disruptor. It gains a foothold in a context where it has no competition and then relentlessly gets better, eventually displacing the far better suited alternatives. This is what I believe is happening with apps. They are asymmetric in their competition with established media and as a result they are easily ignored and brushed off as irrelevant competition. That is until the incumbent media sees a sudden drop in consumption. Even then, the culprit blamed is not the upstart but some structural issue.
Music would appear less vulnerable to this app-based substitution because it's an eyes-free experience and can be easily consumed concurrent with another activity. There is however, a subtle de-emphasis and hence devaluation of the experience as it fades into the background. The "job it's hired to do" changes.
Second, and relatedly, the other meta-observation is that apps are media. They are produced, marketed and priced in ways analogous to other media types. This has implications for the artist/producer/creator. For them movement into apps is natural and effortless. It's how developers moved into them without thinking twice. Trouble is that this transition is not at all simple for those who distribute media.
I tweeted that the media industry deplored the shift of "digital pennies for analog dollars" ((Original quote was made by Jeff Zucker, president of NBC Universal, in 2008 in reference to the future of TV)) as the packaging of their product changed. The angst and trauma suffered by the media industry when dealing with what could be seen as a trivial change in the encoding of content are the stuff of lore and legend. Moving to apps could be even more troubling. Mainly because there is already a distribution channel in place. And it's owned by a set of companies whose motives and business models are completely different.
The app economy shows that there are big opportunities in "digital pennies" and that the figures are beginning to match even the "analog dollars". In fact, I suspect eventually digital pennies will dwarf analog dollars. The trouble is that these pennies will not be earned at the same control points. Bits are already big bucks. They're just not the bits we are used to.
Apple's latest product launch (new OSX, iPads, Macs and iWork/iLife) came with a change in pricing for software. OS X and iWork and iLife and updates are now made available free on new Macs and, in the case of the suites, on iOS devices as well.
Recall also that iOS updates are now free as well and that OS X had been reduced in price from about $129 to $29 with Snow Leopard in August 2009 and to $19 with Mountain Lion in July 2012. The iSuites have also dropped in price over time so the pattern of evaporating software prices is long-running.
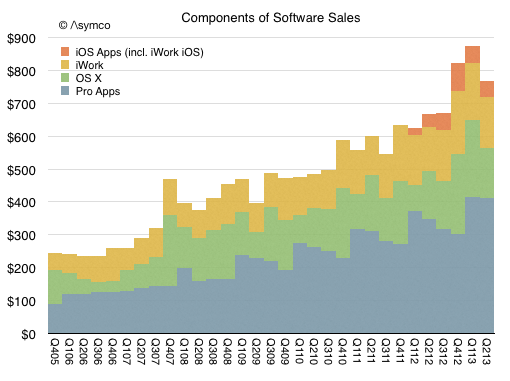
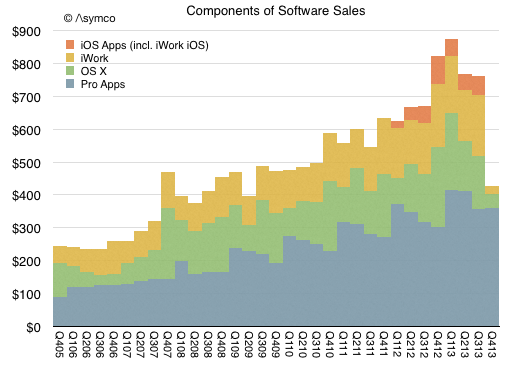
But how fast and what is the impact? The historic performance Apple's Software business is not easily determined since it was always blended with additional businesses. Until September of last year, Software was reported as part of "Software and Services" and since then as part of "iTunes, Software and Services." Some assumptions allow the following picture to be drawn:
One additional wrinkle to the Apple software story is that OS X and iWork/iLife are not all the software titles available. Apple's software includes Pro apps as well as the non-free OS X server. The non-free software US prices are:
Aperture: $79.99
Final Cut Pro: $299.99
Motion: $49.99
Compressor: $49.99
Logic Pro X: $199.99
MainStage 3: $29.99
OS X Server: $19.99
Apple Remote Desktop: $79.99
Given that and additional assumptions can lead to the following picture of the components of Apple's Software sales (in $ million/quarter).
Given this picture of the software business and the change in pricing, here is my forecast for the third and fourth quarters (in $ million/quarter):
The foregone revenues could be as much as $450 million from what would have been received with existing pricing model.
So the question that naturally arises is whether this is "worth it". Whether by offering free software hardware or service revenues rise.
Perhaps. Certainly service revenue in the form of iCloud might rise with more usage of iWork and iLife. But I don't think that this is the calculus underlying the decision. Remember that Apple does not have a Profit/Loss accountability. It's not necessary (and perhaps not even preferred) that a division balances costs and revenues. ((The graphs in this post (and the preceding 1900 on this blog) were created using Numbers.))
Fundamentally Apple remains a systems company where software is a key element in its definition of value. That is not changing. What is changing instead is the bundling of application software with the systems software and the system itself. The presence of iWork and hassle-free updating of that suite (and the same for the OS) means that utilization rates will increase.
I believe the logic for Apple is that usage of the products determines their value and therefore placing powerful software in the hands of more users means they will value the entire system more. This leads to the notion of greater "stickiness" or "lock-in" but also to higher satisfaction and loyalty, rate of upgrades and even more third party purchases and yet more usage.
This is the virtuous cycle platform custodians seek to engender. This is what Apple is trying to build and the transition of apps into the system bundle is part of this re-enforcement.
One wonders how long before Apple's approach becomes the norm for other platforms.
We can put all of our products on the table you’re sitting at. Those products together sell $40 billion per year. No other company can make that claim except perhaps an oil company.
For those of you laughing, that was three years ago. The revenues quadrupled since to a total of $170 for the last four quarters. But the more interesting thought is that the table has not gotten bigger. When Tim spoke the iPad had just been announced but was not yet for sale. So we can't be sure if he thought it should be on the table or not, but it does not take up that much space.
It would be fun to actually lay out all the Apple products on a table to see how big it would be. The trouble is that there are many things Apple sells which take up no space at all. Things like iTunes content or services and AppleCare.
So rather than trying to imagine a table full of Apple products (some of which are non-phyisical) I thought a more fitting analogy would be to allocate the revenues from these products to a table and thinking about how much space relative to each other the products would take.
To make conversion easier, I picked a rather large table; 10 feet long, big enough to fit a small conference room. What would this table covered in product revenue look like?
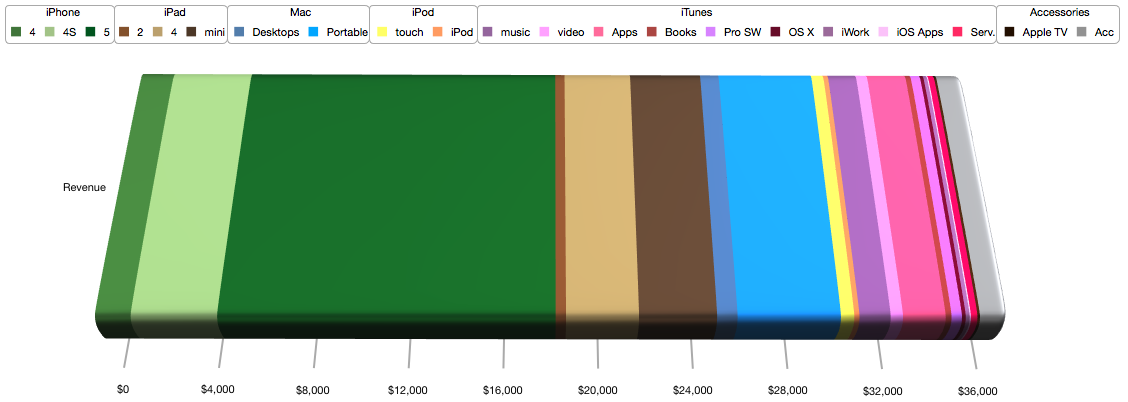
My estimate is that it would look like this:
I color coded the product lines as shown in the legend: Greens for iPhone, Browns for iPad, Blues for Mac, Yellow for iPod, Red/Purples for iTunes and Grey for Accessories.
At this categorization the table would allocate the following space to each category:
iPhone (Greens): 60 inches or about half the table.
music 4.1 video 1.6 Apps 5.6 Books 0.8 Pro SW 1.4 OS X 0.5 iWork 0.5 iOS Apps 0.2 Serv. 0.9
Accessories (Greys): 4 inches.
Apple TV 0.3 Acc 3.6
If this colorful table were used to support the actual products, where each product would have to fit within its color band, then the truth of one saying would become apparent: good things come in small packages.
In the latest quarter the iTunes group top line grew by 25%.
Additional newly reported items:
Quarterly revenues dipped slightly to $4 billion (second highest after $4.1 billion last quarter).
iTunes Stores billings (i.e. gross content revenues) were $4.3 billion
Reached the best month and best week ever for App Store billings at the end of the quarter.
iTunes billings translated to quarterly revenue of $2.4 billion, up 29% from the year ago but flat q/q. Company reports “strong growth in revenue in both content and apps.”
New content added includes HBO GO and WatchESPN available on Apple TV. Apple TV catalog now includes over 60,000 movies and over 230,000 TV episodes.
Users have downloaded more than 1 billion TV episodes and 390 million movies from iTunes to-date. They are purchasing over 800,000 TV episodes and over 350,000 movies per day.
iOS developers have now created more than 900,000 iOS apps including 375,000 apps made for iPad. Apps created grew by 50,000 overall and 25,000 iPad apps.
Cumulative app downloads have surpassed 50 billion.
App developers are being paid at the rate of $1 billion per quarter.
App developers have been paid over $11 billion for their sales through the App Store (half of which was earned in the last four quarters.)
There are now over 320 million iCloud accounts
There are 240 million Game Center accounts
Almost 900 billion iMessages have been sent
Over a 125 billion photos have been uploaded and over 8 trillion notifications were sent.
Some observations and estimates:
Music revenue growth remains at around 15% while video revenue growth remains around 25%
Apps continue to accelerate with a near doubling of revenues
Book revenues are contracting as pricing pressure is being felt
The software group grew moderately at 15% as Apple’s apps are reaching saturation within the iOS user base and as Mac sales stagnate.
As a reminder, you can order the iTunes Business Review from the Asymco Store.
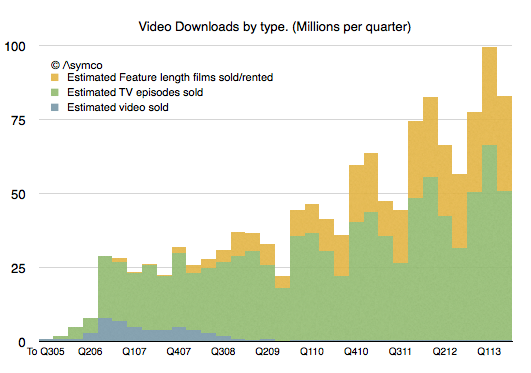
It's been five years since we had an update on TV show downloads and six years since we've had an update on movie downloads from Apple. In Q3 2008 Apple announced 200 million TV show downloads and in Q2 2007 2 million movies. That's a long period with no information making a tough extrapolation to the present.
Nevertheless, I tried. My estimates for these two quantities were 963 million TV Shows and 108.2 million movies to date.
So I was quite surprised to see that figures for both TV show downloads and Movie downloads were published today. The figures were 1 billion and 380 million respectively.
My TV show forecast has proven to be very accurate but I severely underestimated movie download rates. Apple states that the movie download rate is 350k/day. My estimate was only about 126k/day.
After adjusting for the new data, the picture of downloads that emerges looks like this:
The overall iTunes gross revenues by sub-component becomes:
As a result, my new estimate for the rate of spending on iTunes video is about $1.75 billion/yr. This is much more substantial than prior estimates mainly because movies are much more valuable. A tripling of the download rate shows up as a significant rise in the profile of video vis-à-vis the other media types.
Apps and software are firmly defined and music was somewhat clear. The upward adjustment in Video means that I have to reduce either Music or services. I presently am reducing service revenues but might adjust music as well.
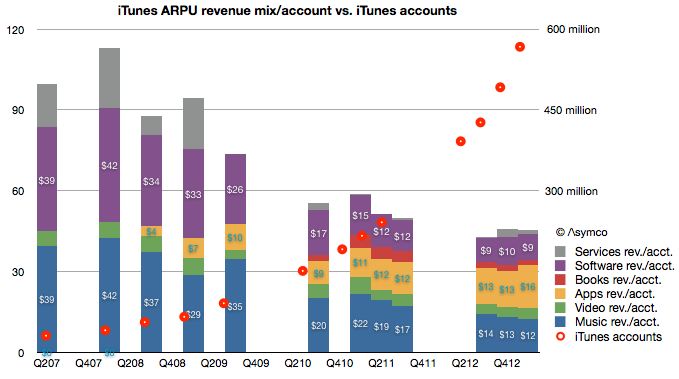
The overall picture of iTunes is becoming clearer every day. We have more information about number of users (575 million), what they spend on media and software and services ($20 billion/yr.) and, increasingly what they spend on each media type (about $9/yr on Software, $2/yr on books, $16/yr on apps $12/yr on music and $4/yr on video.)
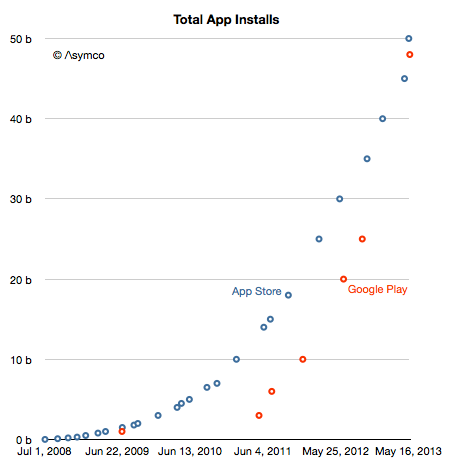
By the end of May there will be 100 billion mobile apps installed on iOS and Android devices.
Not bad for a five year old medium.
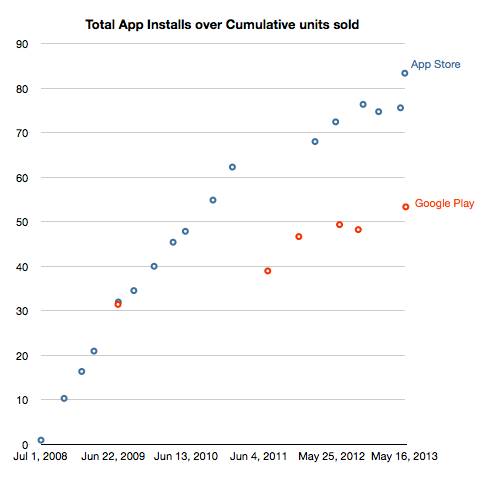
With respect to attach rate, the total downloads/install base are currently 83 apps per iOS device sold and 53 apps per Android device activation. The history of this is shown below:
The sheer weight of Android units will generate more downloads but on a per device basis the iOS devices do seem to consume more apps and the gap is not narrowing. What would be valuable would be the revenue per app on Play (the figure for iOS is about $0.23). That, as far as I know, remains unknown.