Asymco

Asymmetric Intelligence

app

  1. Tim Cook's answer to my first question

    Research · 114 comments

    Tim Cook was asked the first question (on the iPhone portfolio). His answer is paraphrased here:

    We haven't so far. That doesn't shut off the future. Why? It takes a lot of really hard work to do a phone right when you manage the hardware and software and services in it. We've chosen to put our energy on doing that right. We haven't been focused on working multiple lines.

    Think about the evolution of the iPod over time. The shuffle didn't have the same functionality as other products. It was a really good product, but it played a different role — it was great for some customers it was strikingly different than other iPods. The mini played a different role than the classic did. If you remember when we brought out the mini people said we'd never sell any. It was too expensive and had too little storage. The mini proved that people want something lighter, thinner, smaller. My only point is that these products all served a different person, a different type, a different need. For the phone that is the question. Are we now at a point that we need to do that?

    …

    At a macro level, a large screen today comes with a lot of tradeoffs. When you look at the size, but they also look at things like do the photos show the proper color? The white balance, the reflectivity, battery life. The longevity of the display. There are a bunch of things that are very important. What our customers want is for us to weigh those and come out with a decision. At this point we think the Retina display is the best. In a hypothetical world where those tradeoffs didn't exist, you could see a bigger screen as a differentiator.

    Full interview here, answer begins around minute 37.

    Here is how I interpret the answer:

    • The iPhone portfolio may still arrive. It hasn't so far because the cost/benefit is not there for Apple. On one hand it would take a great deal more sourcing effort and risk while dealing with constraints in production. On the other it would not not offer meaningful additions to the customer base. At least so far. The economics and the demand may change (or have changed) and the time will come for a broader portfolio.
    • The comparison to iPod is not entirely appropriate because as a music player, the iPod had a relatively small set of jobs to do. It was hired for exercise, escapism, isolation, etc. It was not hired for apps and services which extend the medium itself. In other words it was not a computer. As a computer, the iPhone has a near infinite set of jobs to be done and it's the hundreds of thousands of apps which help it perform them. But as a result the iPhone needs to conform to the dynamics of ecosystems and that means consistency of APIs and user experience. It cannot vary in terms of input methods, or be below minimum requirements of screen size or memory and power.
    • Because of the rapidly expanding job space, Apple believes the iPhone was not "good enough" for all these years. The improvements shipped for each generation were all "meaningful" in that they were valuable and absorbable. Users would use the new features (like better screens, cameras, battery, etc.) and they were willing to pay for them (as evidenced by the sustained high average price).
    • On the question of what the extension might be, changing screen size is one dimension but it has to be balanced by performance gains that don't detract from other dimensions. Engineering is all about compromise and consumers pay Apple to make these compromises in an intelligent way. Apple does not come to an answer to the question of balance by launching many products and seeing what works. It cannot afford to dilute its brand with a long list of failures. Other brands may not be affected by trial-and-error approaches to the market but they are discounted by the customer accordingly.
     

  2. The allure of iTunes

    Research · 132 comments

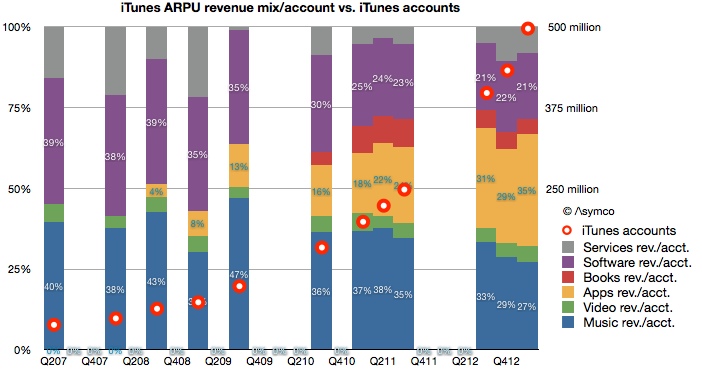
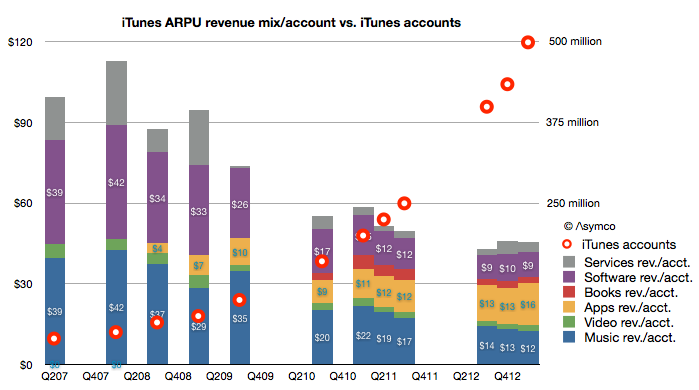
    My estimate of last quarter's iTunes gross revenues suggested a spending rate of $40 per iTunes account. It would make sense to consider how that figure changed over time. The following graph shows the pattern:

    Screen Shot 2013-05-14 at 5-14-9.49.40 AM

    You can read each bar in the graph as the total "ARPU" or average revenue per iTunes user[1].

    I overlaid a graph showing the total number of accounts as reported by Apple to the (retroactively) estimated revenue structure. Account totals are measured with the right axis and ARPU with the left.  Note that I also broke down each component of iTunes as currently defined (Music, Video, Apps, Books, Software and Services.)[2]

    The time frame covered is from Q2 2007, or the quarter prior to the iPhone launch. A few patterns emerge:

    • When there were no iOS devices (and hence no iOS apps) the revenues of iTunes consisted mostly of music sales. Those revenues were, on a per account basis, roughly comparable with Apple's Software revenues.
    • As iOS devices proliferated, the number of accounts (and users) grew. They doubled in the first two years (2007 to 2009) and doubled again in the following year (2010) and doubled again the following year (2011) and doubled again in the following 18 months. This rate of growth was accompanied by a reduction in the iTunes ARPU of about 50% (from $99 to about $45).
    • The reduction in ARPU has moderated in the last few quarters. ARPU fell 10% from $50 to $45 during the last doubling of accounts (from 225 million iTunes accounts to  500 million accounts.) In contrast ARPU fell 20% from $74 to $58 during the penultimate doubling (from 100 million to 200 million)
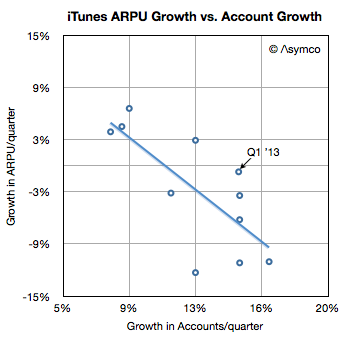
    • However, growth in accounts is broadly inversely proportional to growth in ARPU. In other words, the faster the growth in users the faster the decline in ARPU. The recent moderation in ARPU erosion is also coupled to a moderation in user growth (most recent doubling took 18 months vs. 12 months for previous doubling.) This is as would be expected as a broader, later user base tends to consume less than a narrow, early base. This can be seen in the following scatter plot:
    Screen Shot 2013-05-14 at 5-14-10.35.02 AM
    • When seen as a percent of mix, Apps have grown to be the largest component of iTunes spending. Apps have 35% "share of wallet" while music has dropped steadily from 40% to 27% (or $39 to $12/yr.) This is shown in the following graph.
    Screen Shot 2013-05-14 at 5-14-10.34.45 AM

    As apps have grown to consume more and more of users' time it stands to reason that they should consume more and more of users' wallets.

    And as accounts reach one billion, we can begin to think about the disruptive impact on other media types. Whereas video, books and music are targeted to smaller user bases, apps are broadly consumed. Developers like Rovio or Supercell can offer their products to billions while TV producers can only hope for millions. Apps are becoming the universal medium for entertainment and iTunes the universal distributor.

    Talent is catching on to this faster than those who manage and distribute their work. The inevitable result will be a mass migration of talent away from the established content industries. Old media won't fade due to a loss of users. It will fade due to a loss of talent.

    --

    Notes:

    1. An account is not necessarily a user so perhaps more appropriately the acronym should be ARPA (average revenue per account). Unfortunately that acronym is taken.
    2. The complete model is available for purchase through Asymco Store.
  3. iTunes users spending at the rate of $40/yr.

    Research · 77 comments

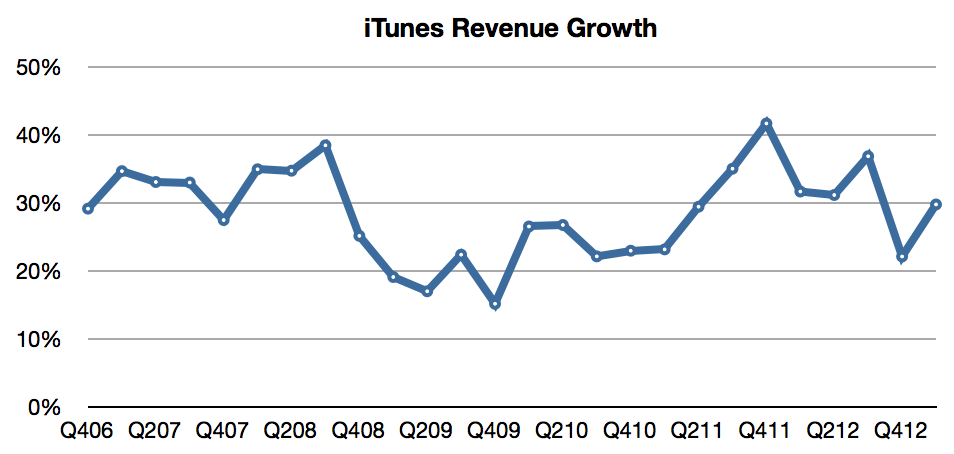
    In the latest quarter the iTunes top line grew by 32%. Additional newly reported items:

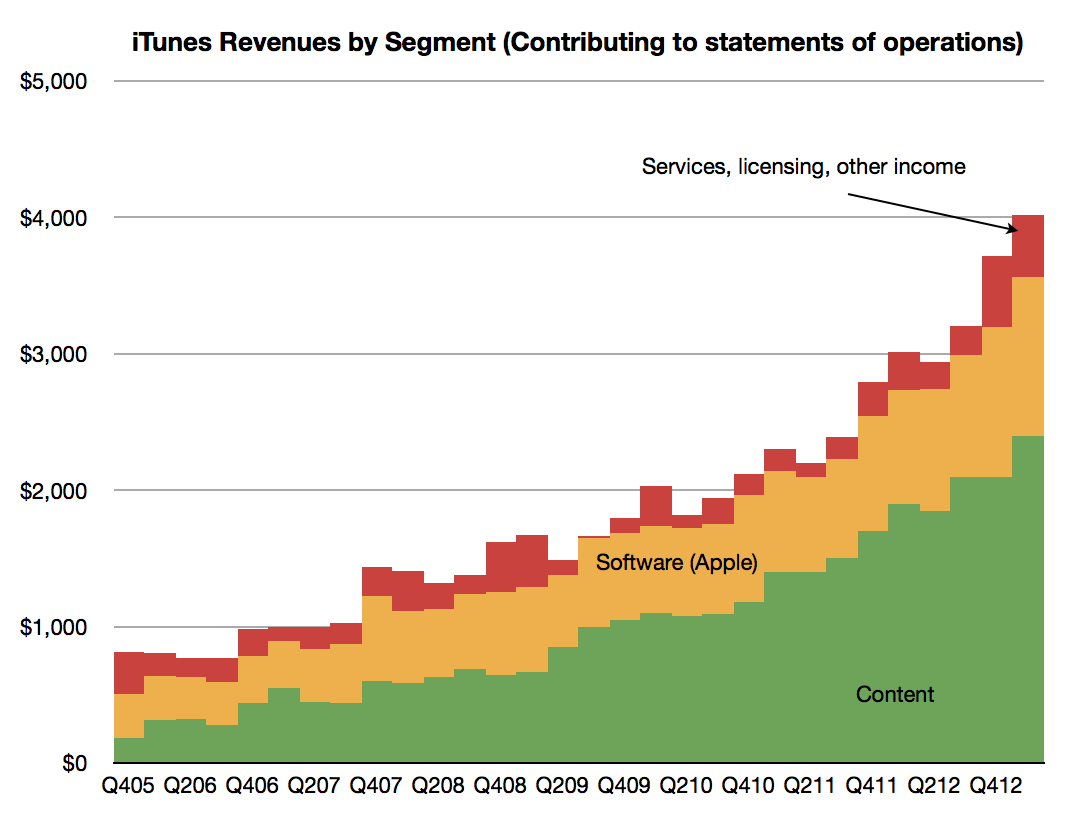
    • Quarterly revenues topped $4 billion (a new high) and the company suggests that this rate is maintainable by stating it has a “$16 billion annual run rate”. The pattern of revenues is shown below.
    Screen Shot 2013-05-12 at 5-12-8.12.30 AM
    • The content portion of iTunes revenues was $2.4 billion, up from $2.1 billion sequentially. Growth into Q1 is not unusual as many holiday iTunes gift cards are redeemed during January.
    • Revenue growth has been surprisingly steady, averaging 29%/quarter for more than six years.
    Screen Shot 2013-05-12 at 5-12-8.20.06 AM
    • Music is now available in 119 countries.
    • The Music catalog now consists of 35 million songs.
    • Movies are available in 109 countries. 60,000 titles are offered.
    • iBookstores are present in 155 countries offering 1.75 million iBooks.
    • There are iTunes App Stores in 155 countries whose residents make up about 90% of the world’s population.
    • iOS developers have created more than 850,000 iOS apps, including 350,000 made for the iPad.
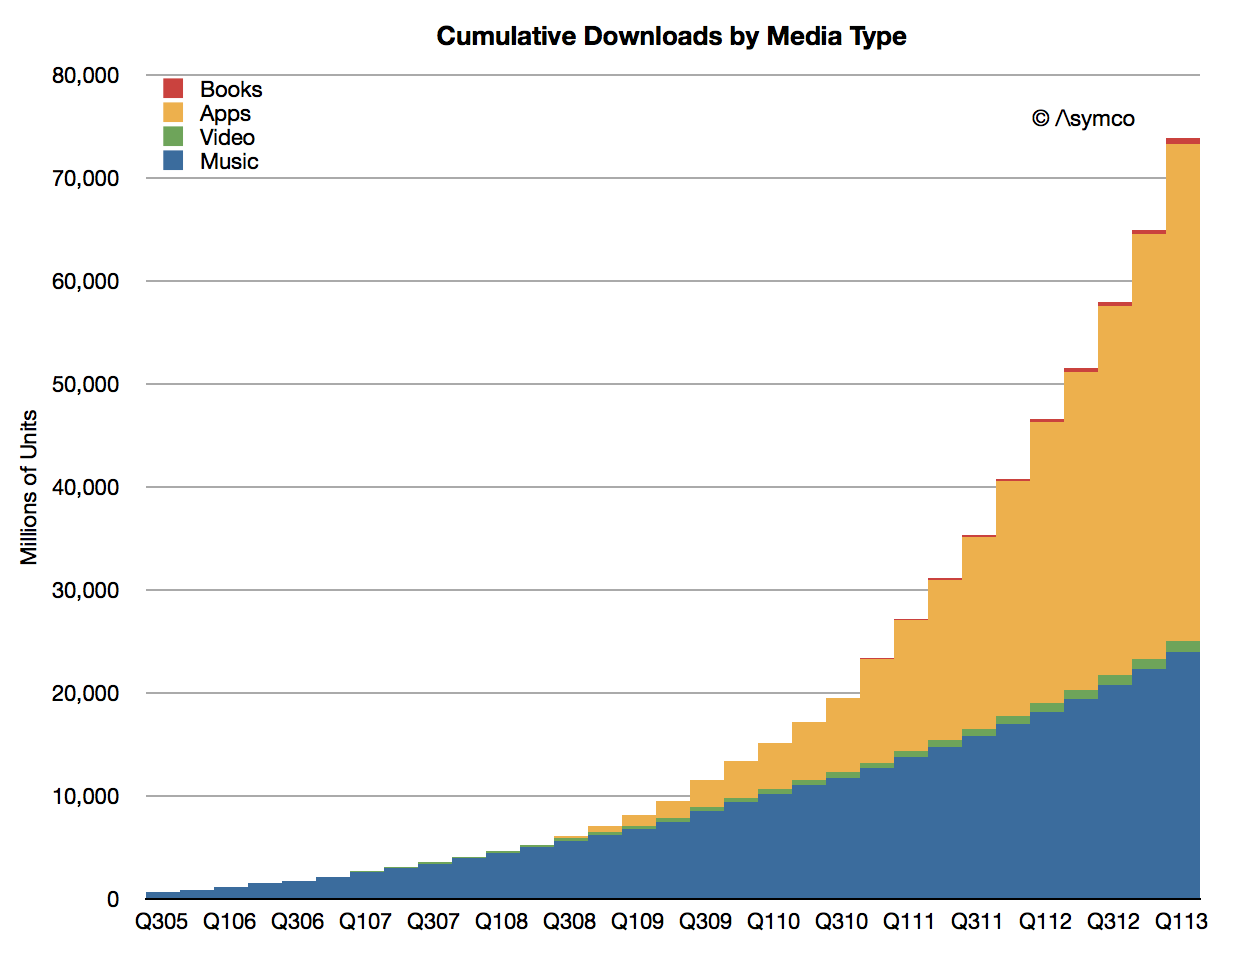
    • Cumulative app downloads have surpassed 45 billion and are on track to reach 50 billion at time of writing (estimated to be reached mid May).
    Screen Shot 2013-05-12 at 5-12-8.21.31 AM
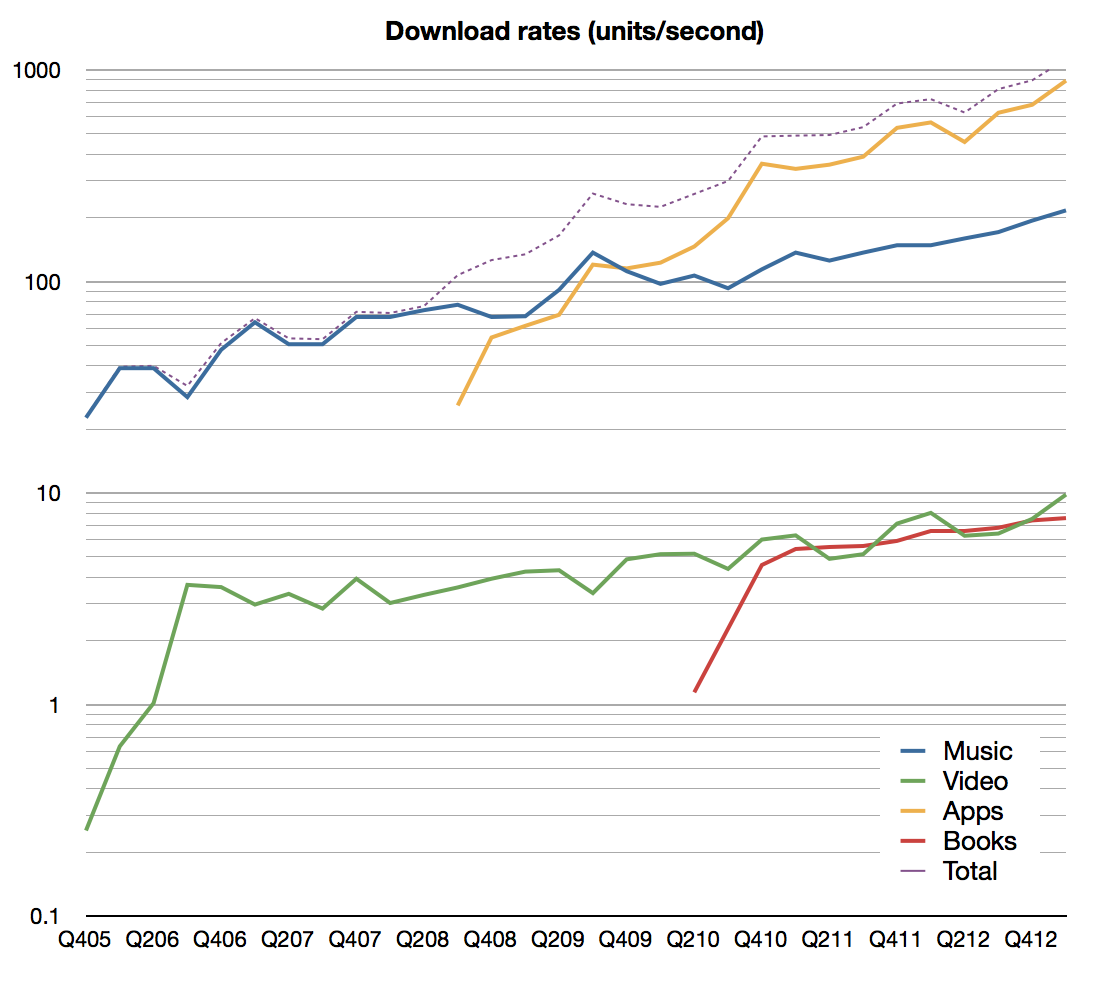
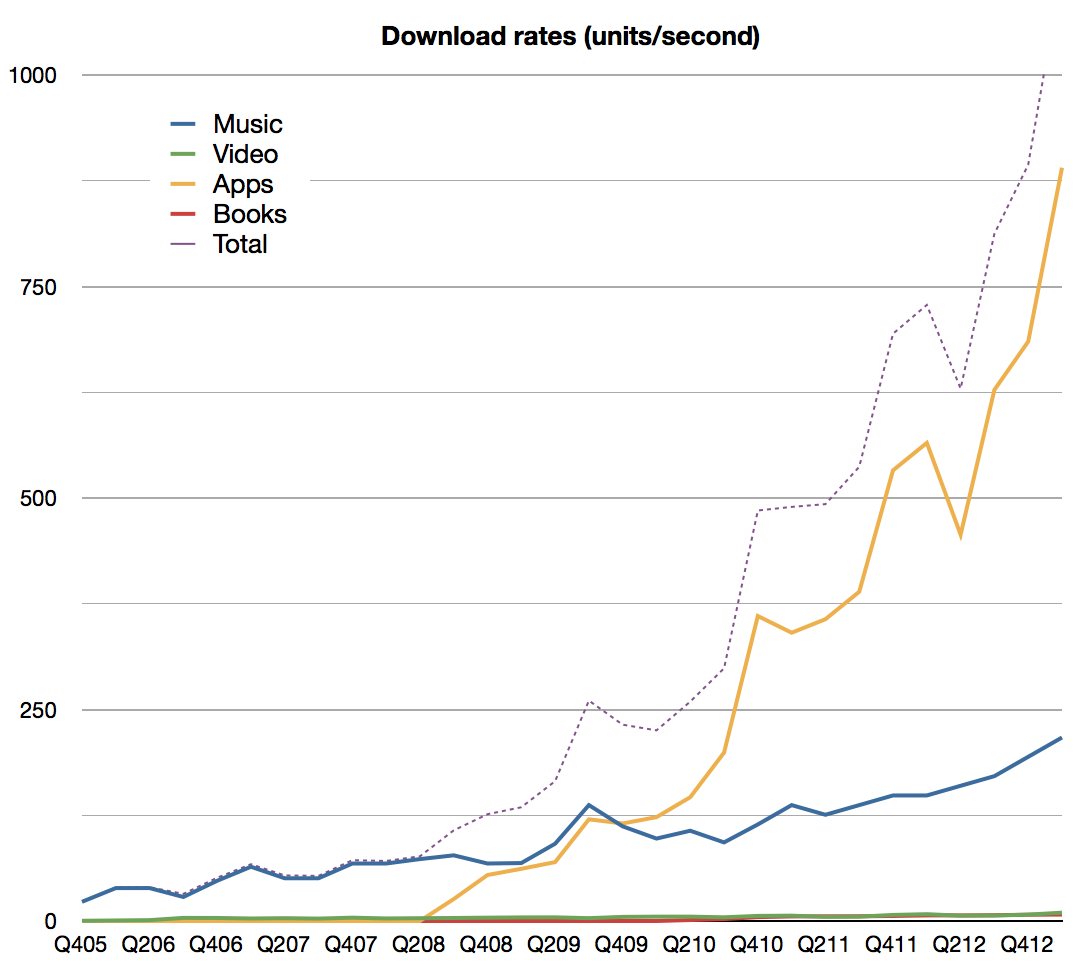
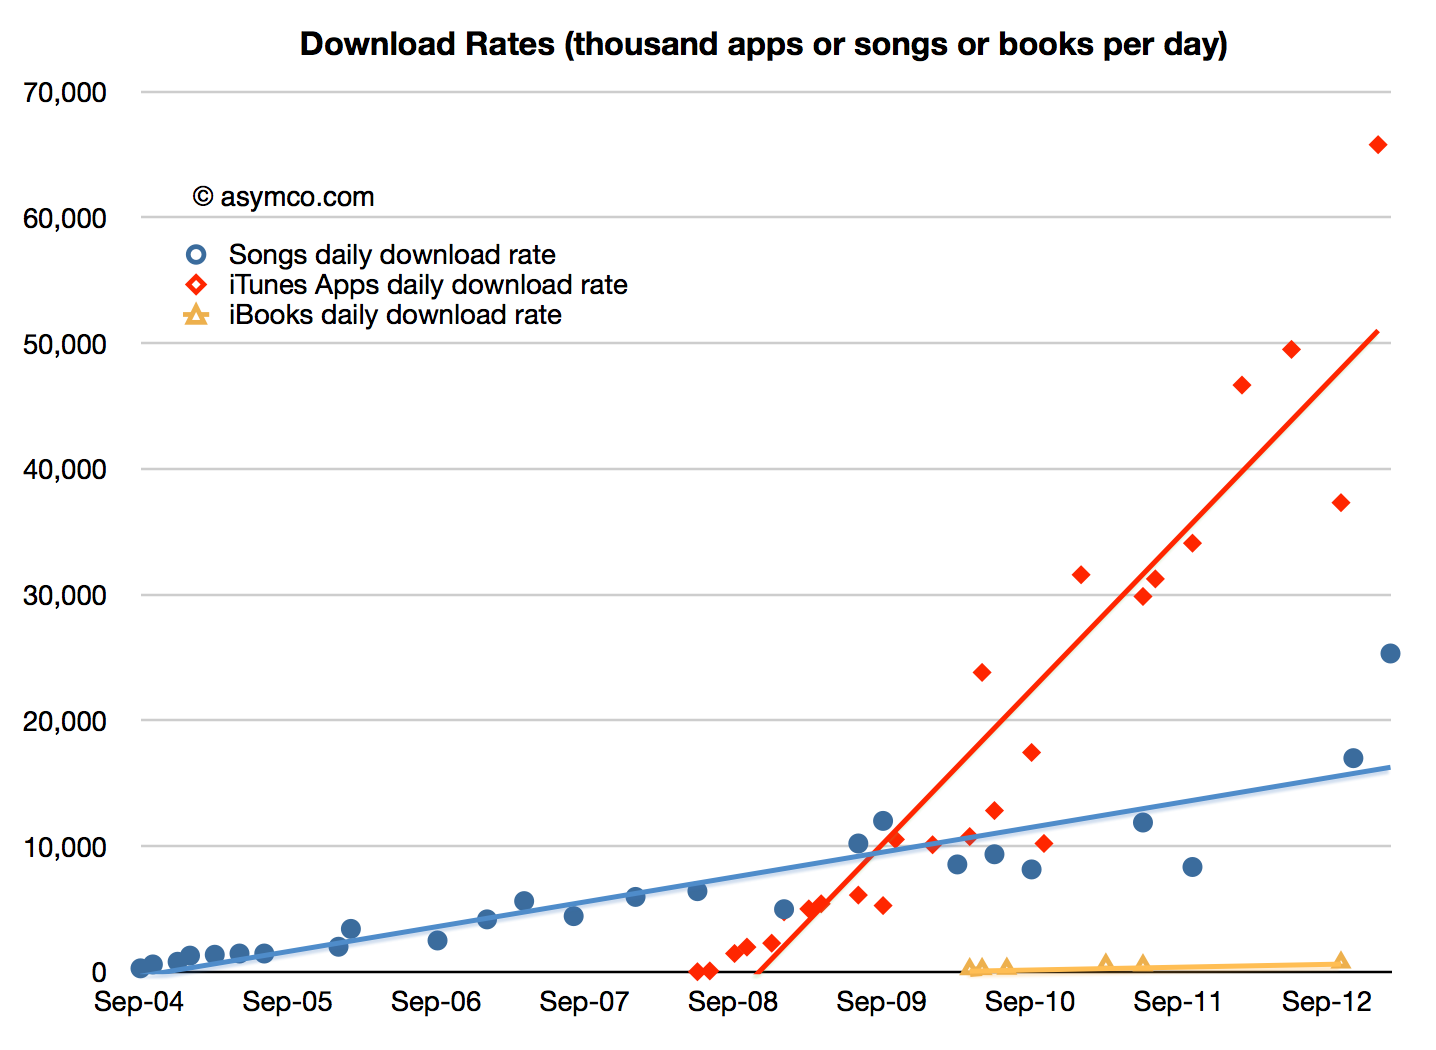
    • The company reports that over 800 apps are downloaded per second. Including all media, the download rate is now above 1000 items per second. Estimated download rates by media types are shown below (note: first graph is plotted on a log scale):
    Screen Shot 2013-05-12 at 5-12-8.34.37 AM


    Screen Shot 2013-05-12 at 5-12-9.07.49 AM


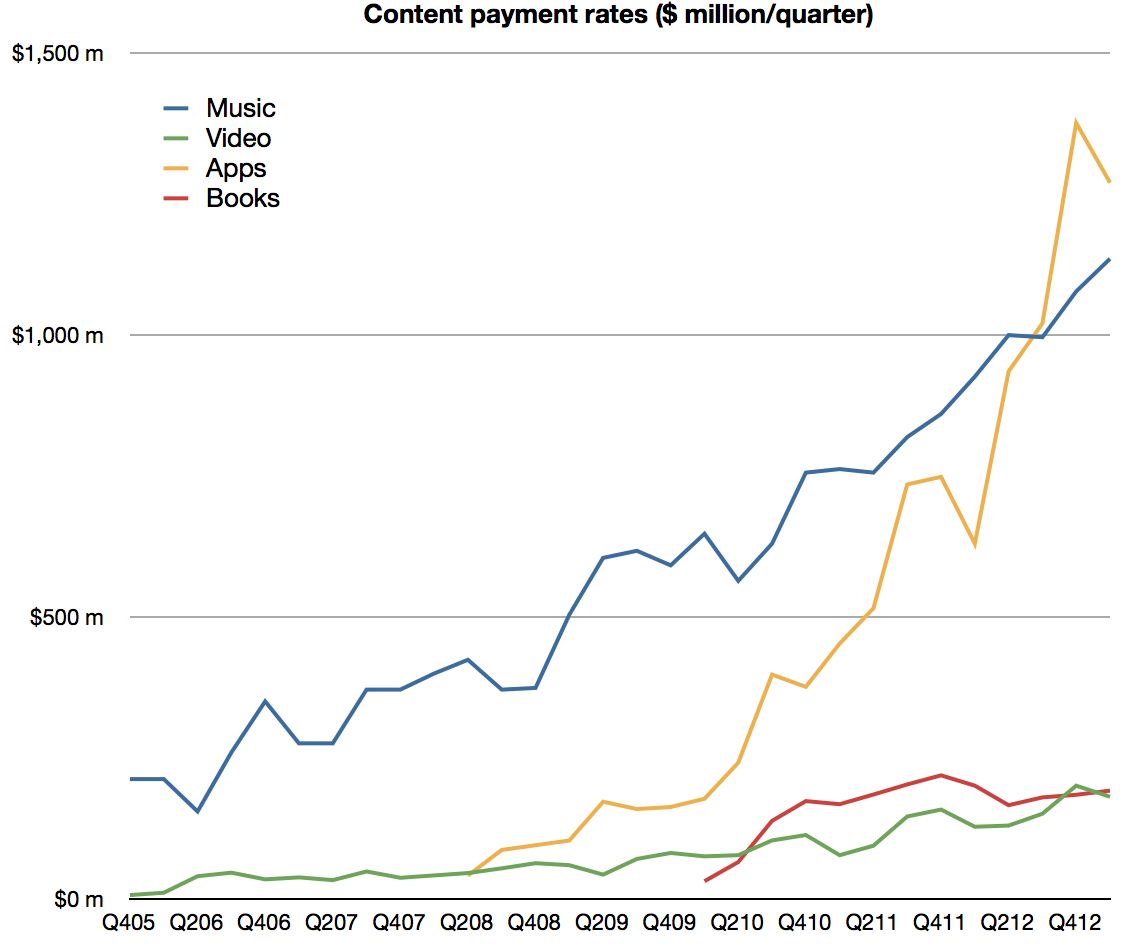
    • App developers have been paid over $9 billion for their sales through the App Store including $4.5 billion in the most recent four quarters. I estimate the split between media types as follows:
    Screen Shot 2013-05-12 at 5-12-9.13.48 AM
    • Canalys estimates that sales from iTunes App Store accounted for 74% of all app sales worldwide in the March quarter.
    • iOS app revenues more than doubled year-over-year.

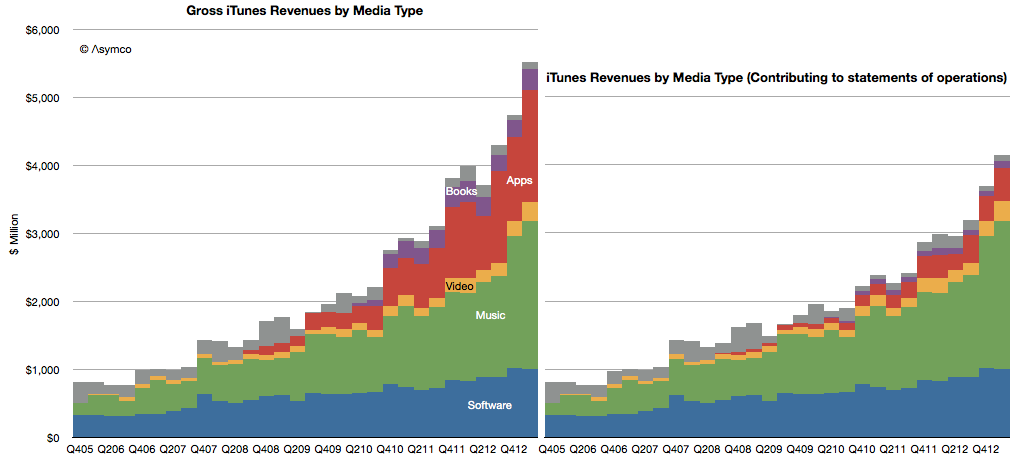
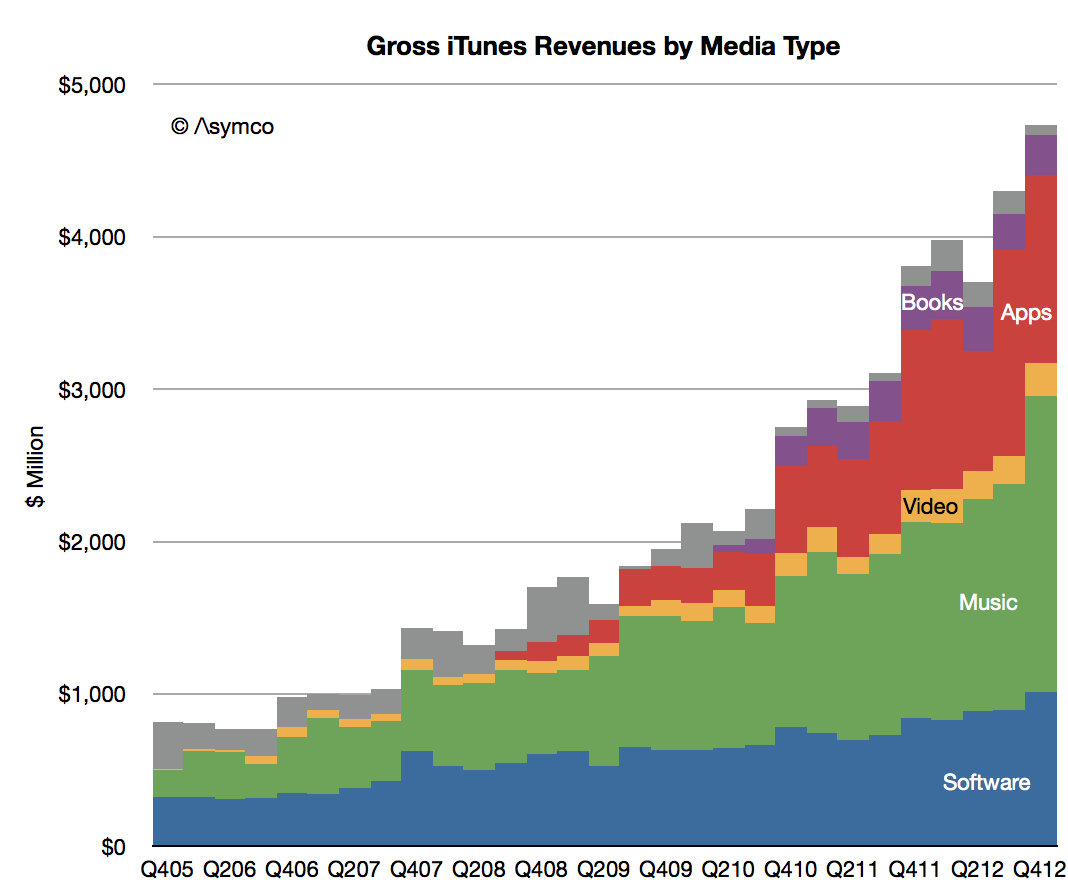
    Including all (gross[1]) content revenues, the sales rate is now nearly $5 billion per quarter ($4.94 billion). Including services, the iTunes consolidated business cleared over $5.5 billion.

    Screen Shot 2013-05-12 at 5-12-9.18.30 AM

    In March Apple reported that they have 500 million iTunes so one way to think about the iTunes business is to say that  iTunes users purchase content and services at the rate of about $40 per year.[2]

    Bless them.

    ---

    Notes:

    1. "For third-party applications sold through the App Store and Mac App Store and certain digital content sold through the iTunes Store, the Company does not determine the selling price of the products and is not the primary obligor to the customer. Therefore, the Company accounts for such sales on a net basis by recognizing in net sales only the commission it retains from each sale. The portion of the gross amount billed to customers that is remitted by the Company to third-party app developers and certain digital content owners is not reflected in the Company’s Consolidated Statements of Operations." From Apple SEC filing 10-K, October 2012.
    2. Apple users spend about $1/day for each Apple device in use making the iTunes franchise an incremental 11% marginal revenue source (assuming one device/user.)
  4. Happy Birthday iTunes Store

    Research · 16 comments

    iTunes (including software and services) revenues in Q1 topped $4 billion and were 30% higher than (re-stated) 2012 Q1 revenues. Accompanying this revenue figure were additional data points from the company:

    • Cumulative app downloads have surpassed 45 billion
    • Payments to developers reached a cumulative total of $9 billion
    • Payments to developers were $4.5 billion in most recent four quarters
    • Now paying $1 billion to developers every quarter
    • 800 apps are downloaded every second
    • iOS app revenues doubled since year-ago quarter
    • App Store accounted for 74% of all app sales in the quarter (citing Canalys)
    • App stores reach customers in 155 countries (850k Apps, 350k iPad apps)
    • iTunes music downloads are available in 119 countries (35 million songs)
    • Movies are sold in 109 countries (60k titles)
    • iBookstore is available in 155 countries (1.75 million titles)

    This data allows for a few inferences:

    • Nearly 70 million apps are downloaded every day
    • The average revenue per game is about 23 cents
    • Gross app revenues are about $16 million per day (of which 11 million is paid to developers.)
    • Gross iTunes revenues were $5.4 billion last quarter of which I estimate:
    •  …App revenues were $1.6 billion
    •  …Music revenues were $2.2 billion
    •  …Video revenues were $287 million
    •  …Book revenues were $312 million
    •  …Apple's software generated $1 billion
    • In addition, I estimate that Services generated $100 million

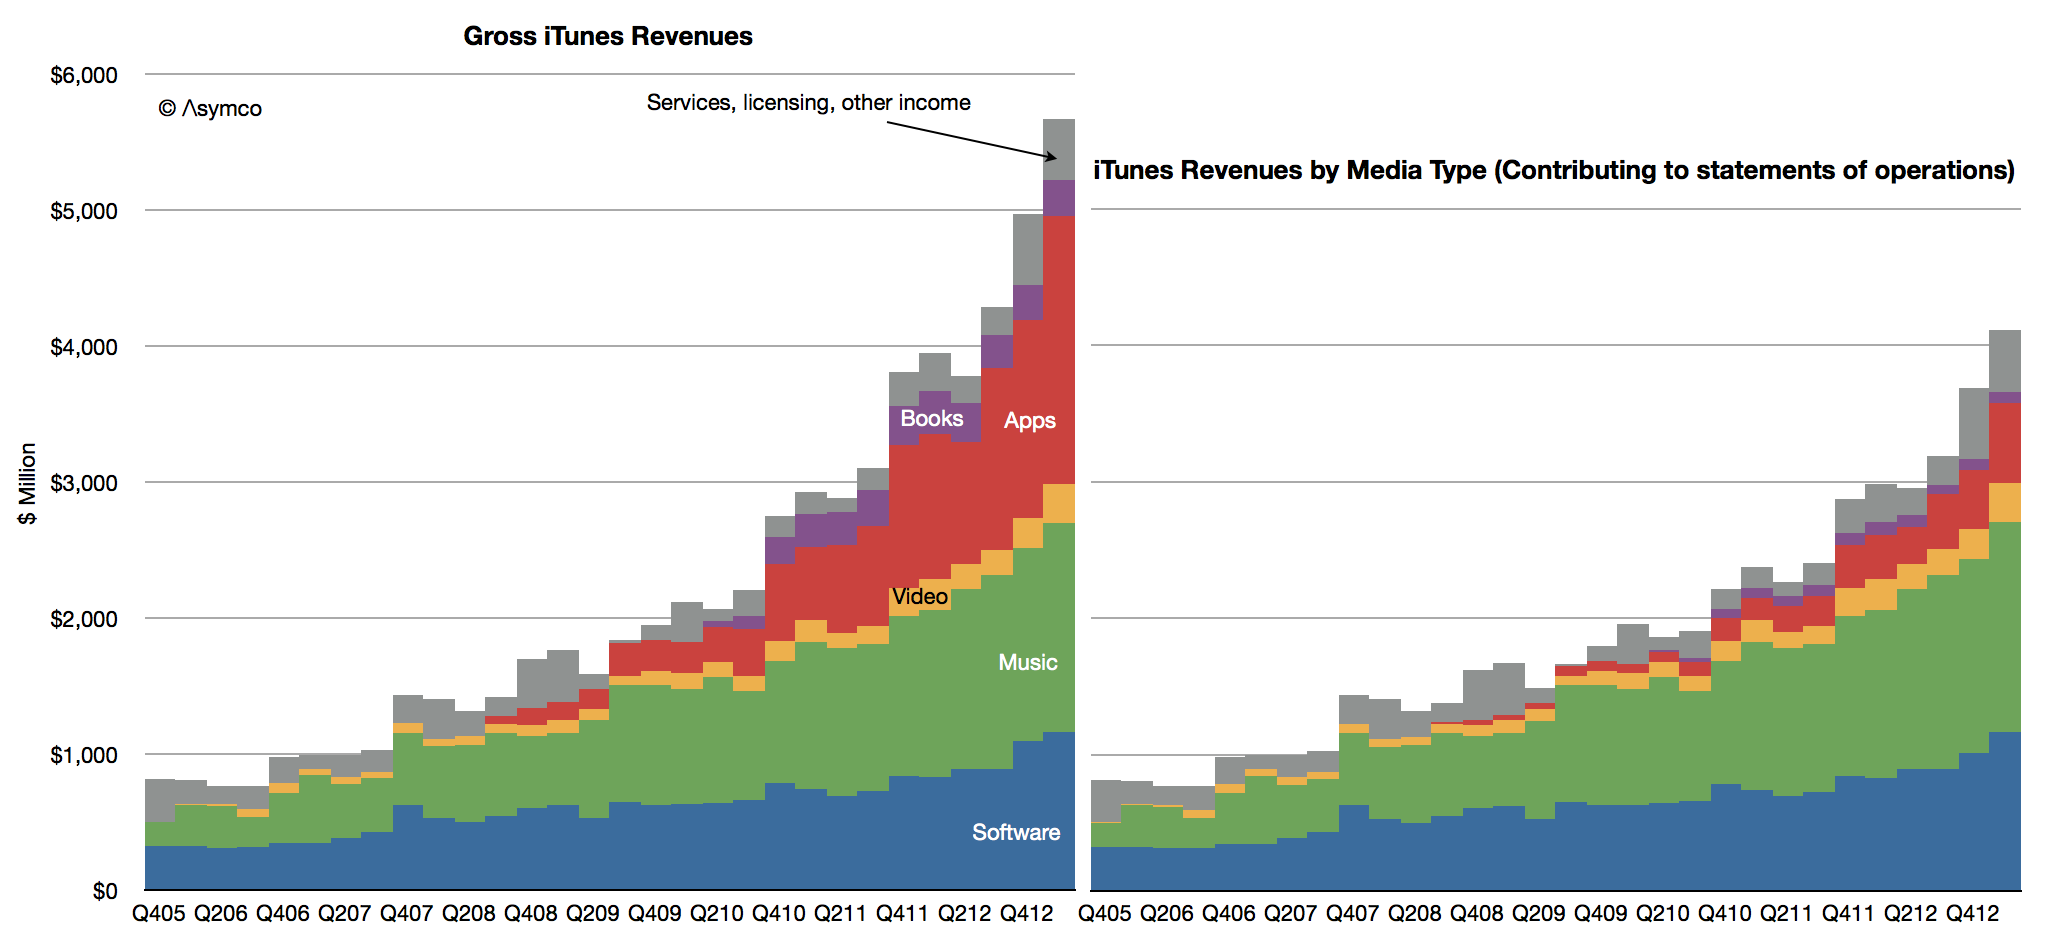
    Note that there is a difference between the amounts transacted through the store and what the company reports. The difference is shown in the following graph

    Screen Shot 2013-04-29 at 4-29-1.02.50 PM

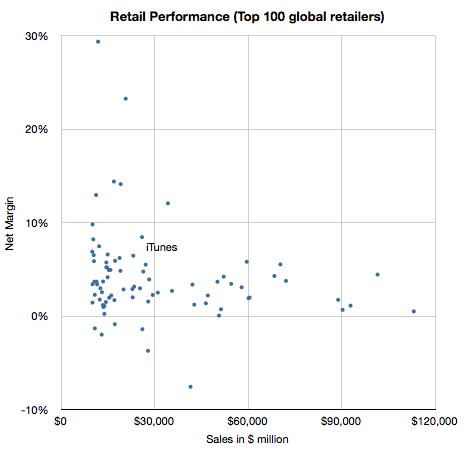
    To mark it's 10th year, I wrote a segment for Billboard Magazine describing what iTunes has become. I suppose it's easy to become numb to these numbers, but there is perhaps one way to look at iTunes that is still compelling:

    Selling $20 billion a year would put iTunes in the top 20 US retailers and top 50 Global retailers.

    Screen Shot 2013-04-29 at 4-29-1.36.41 PM

    Not bad for a 10 year old.

  5. iTunes Segment Revenues in Context

    Research · 23 comments

    In the last few posts I estimated the iTunes economy in some detail. In absolute figures, the revenues and cost structures of iTunes are substantial:

    • 6.3 billion transactions in the last quarter
    • $4.6 billion consolidated revenues (including software & services)
    • $3.3 billion in content payments
    • $650 million in operating income

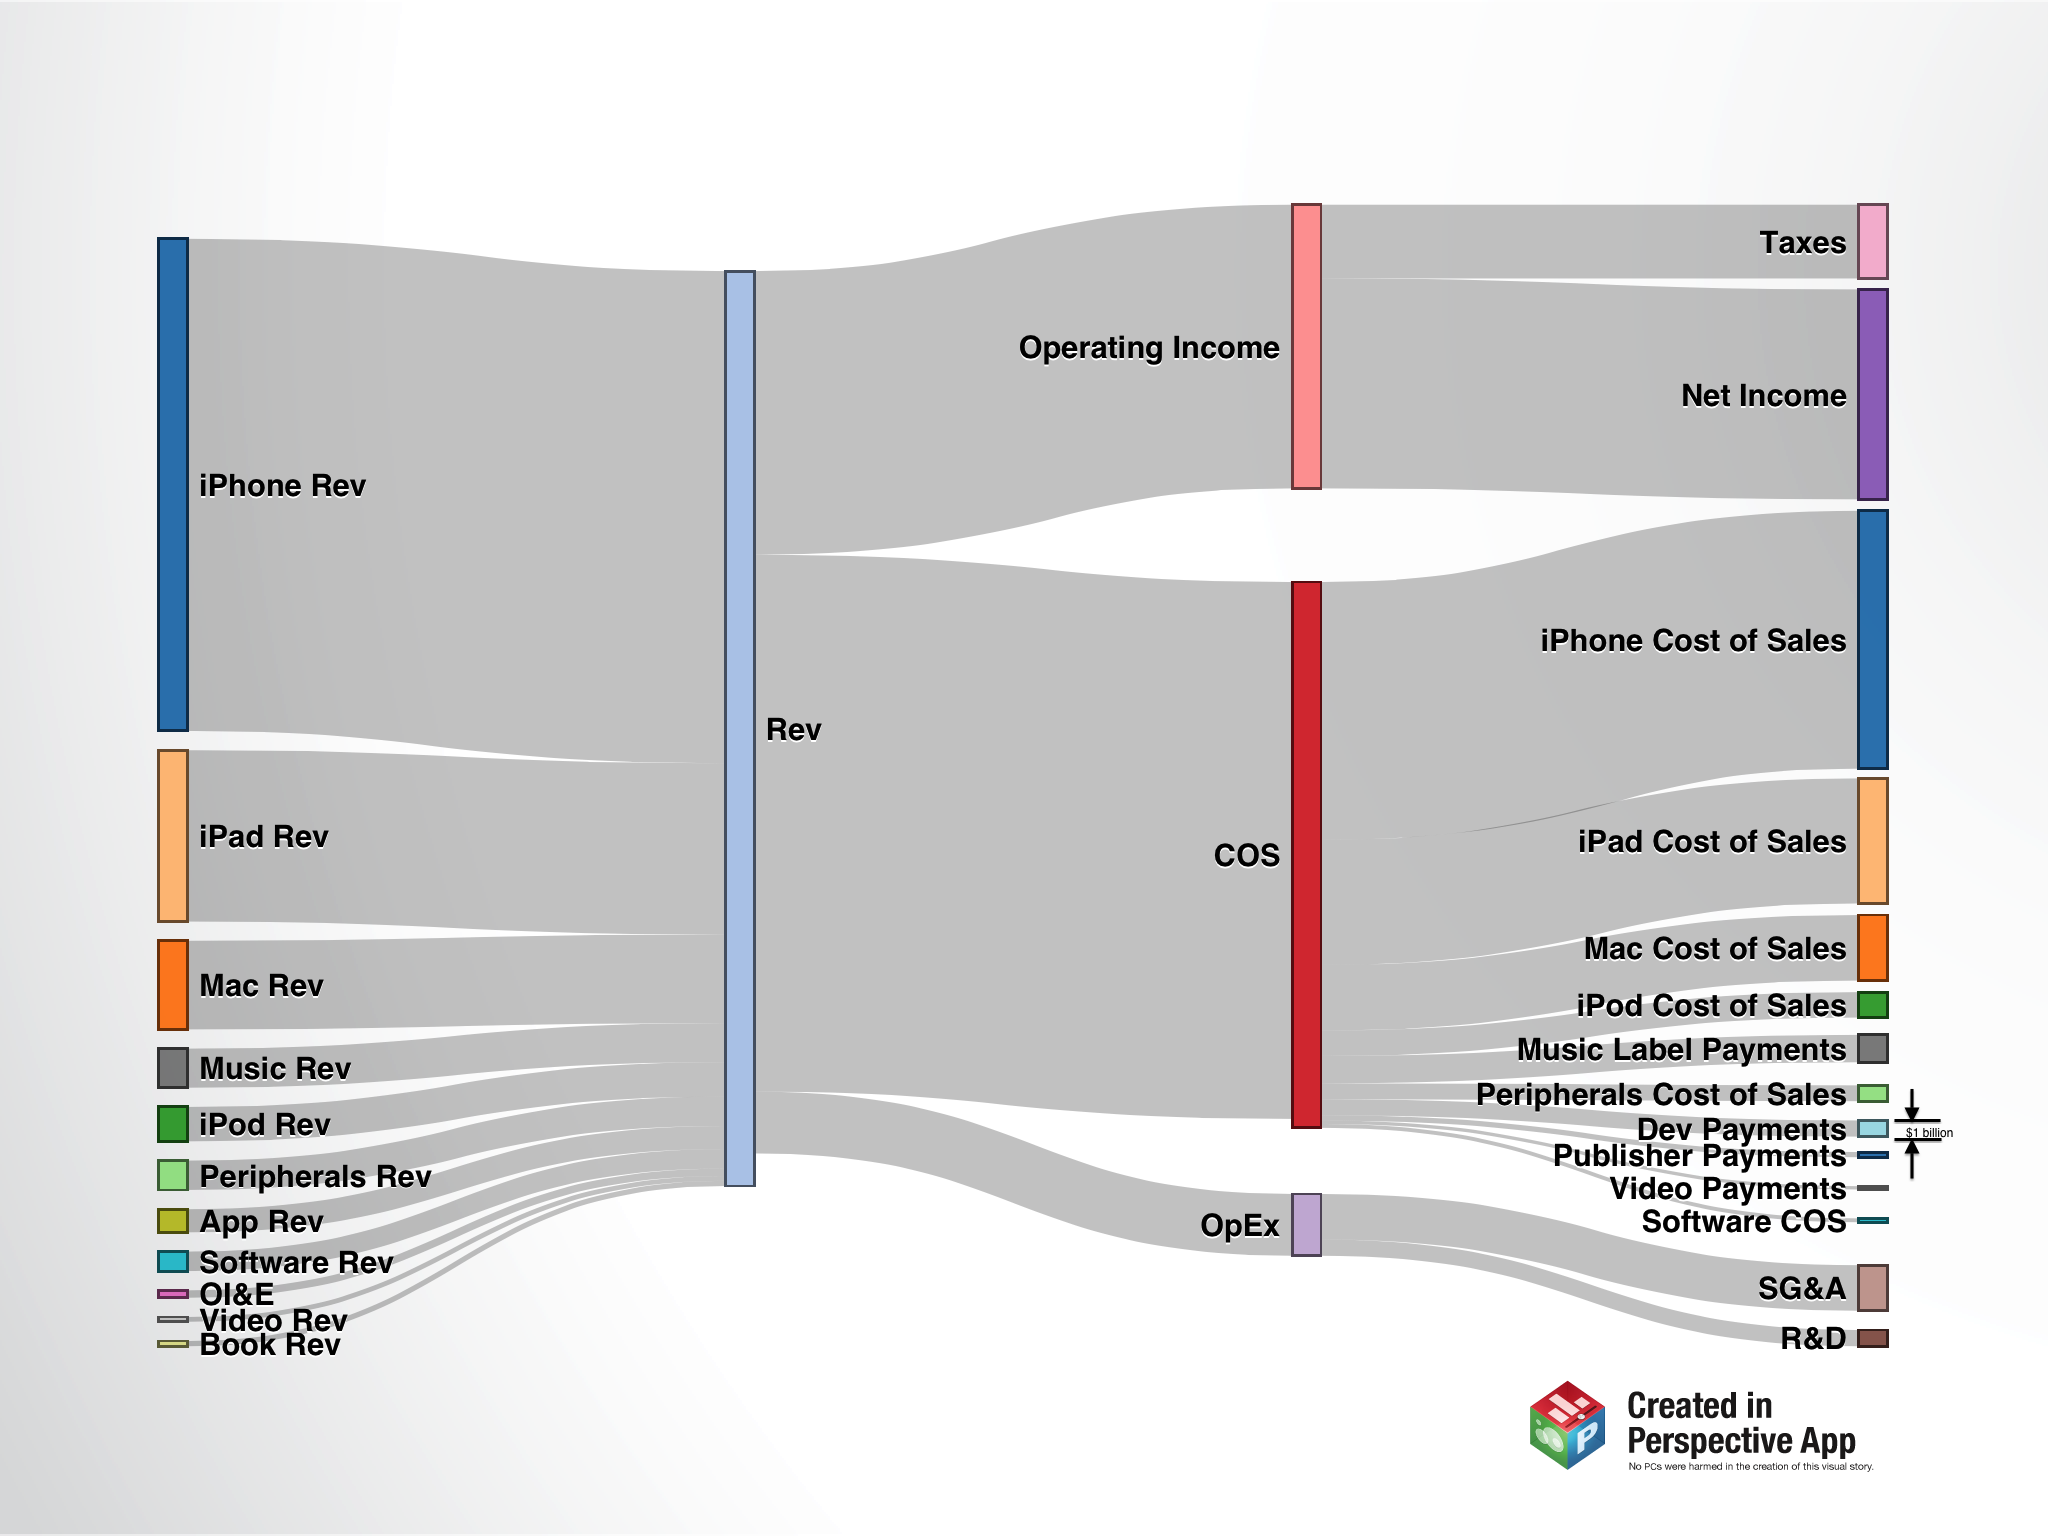
    However, as a part of the entire Apple revenue model, iTunes appears to be a small contributor. The following diagrams shows where revenues came from and where they were spent during the last quarter

    Sankey-Income1

    A few notes:

    1. Click on image to enlarge. The graph was produced using an iPad and it is rendered at iPad retina resolution.
    2. The data covers only the Fourth Calendar Quarter of 2012.
    3. For scale reference, "Dev Payments" equals $1 billion (as marked.)
    4. When zoomed in, each pixel represents about $50 million (vertical dimension).
    5. Revenues shown are "gross" and therefore greater than reported. See post on iTunes Revenue Recognition. �The same reason affects the total Cost of Sales (COS).
    6. Sources of revenue are ranked according to size. Note that Music is higher than iPod or Peripherals and Apps are higher than Software.
    7. Different Cost of Sales components are also ranked by value.
    8. iTunes which is the sum of Music, App, Software, Video and books makes up about 7% of overall revenues but 10% of costs of sales and hence contribute about 4% (est.) of total operating margin.

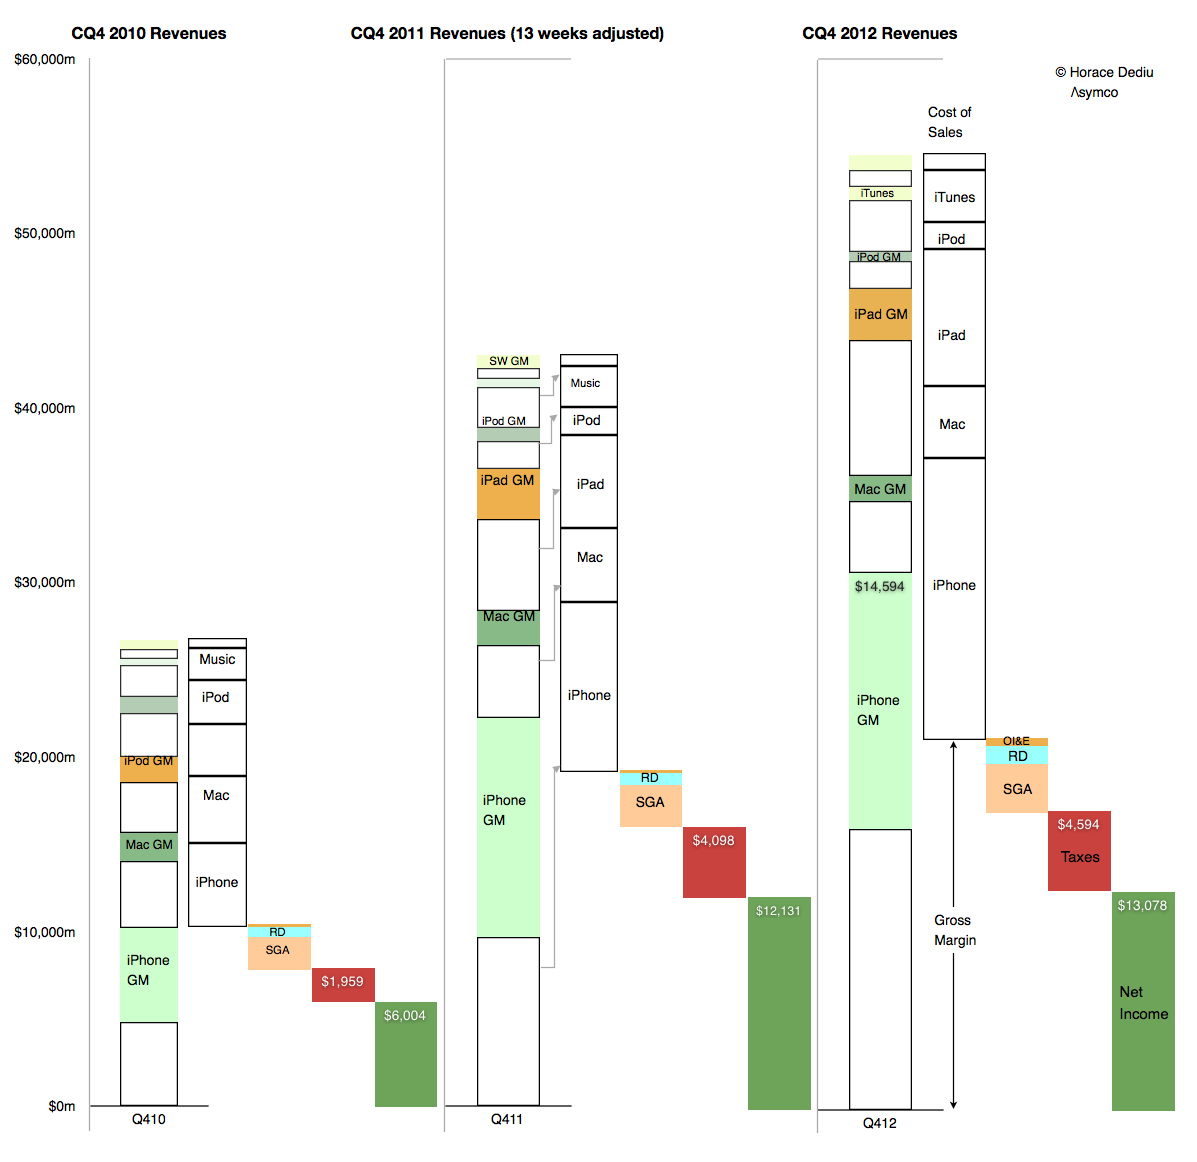
    A three year view of the same data is shown below:

    Screen Shot 2013-03-26 at 3-26-2.07.06 PM
  6. So long, break-even

    Research · 113 comments

    The following is another excerpt from a report titled "iTunes Business Review" which will soon be available for purchase through the Asymco Store. If you are interested in the product please get in touch.

    ---

    iTunes store will be 10 years old next month. From its inception Apple has stated that it aims to run the store "at break-even".  The business has grown so rapidly however that its profit-free nature has come under severe pressure.

    The reasoning goes that as more media types have been added costs have increased but revenues have increased even faster. Consider the estimated gross revenue base as shown below:

    Screen Shot 2013-03-22 at 3-22-2.39.55 PM

    What is known as iTunes today has quintupled in seven years. Although cost of content sales are likely to have been preserved as a ratio (about 30%) the vastness of transaction volume (estimated at 23 billion item transactions in 2012 alone) implies that there are some significant economies of scale.

    This implies that the operating costs are spread more evenly and that therefore the possibility exists for some operating margin.

    Put another way, at break-even the cost of operating iTunes stores would be about $3.75 billion. It's hard to imagine this level of operational expense for digital content.

    For this reason, management has begun since 2010 to suggest that at least the App Store is run "a little over break-even". How little is a good question. A one percent operating margin (from gross revenues) would imply as much as $45 million margin. I estimate 2% is possible on Apps and 1% on Music.

    That's $150 million in margin content. Heady stuff.

    However, since folding its Software group into iTunes (the blue area in the graph above) the margin picture changes dramatically.

    The Software group is one of the forgotten heroes of Apple.

    Apple’s software division “Apple Software” is responsible for the following products:

    • iWork which includes Pages, Numbers and Keynote. These are available through the Mac App store at about $20 per product and the iOS App Store for $10.
    • iLife which includes iMovie, iTunes, iPhoto, GarageBand. The OS X versions are available free with new computers but they are also available as paid downloads for OS X through the Mac App Store at $15 each and for iOS devices through the App store at $4.99 per app.
    • OS products including downloads of iOS and OS X. These are mostly free but some OS X updates are not free (typically $19.99 for new version including the server version of OS X.)
    • Professional tools which include the following products: Final Cut Pro (Video editor $299.99), Logic Pro (Music editor $199.99), Aperture (Professional Photo workflow $79.99), Compressor (additional features for Final Cut Pro $49.99), Motion (video transition editing for Final Cut Pro $49.99)
    • Administration and development tools which include:  Xcode integrated development environment which is free Apple Remote Desktop which is priced at $79.99.

    All these products are now sold through either iTunes App Store or Mac App Store. They used to be sold as traditional boxed software for many years but Apple has transitioned them all to be download-only and folded them into the catalog of third party apps while lowering prices.

    My estimate is that Apple’s own software generated $3.6 billion in Revenues in 2012. As you can imagine, this is a high margin business  which grows at nearly 20%/yr. Although I estimate that the software business has been overtaken by the Apps and Music businesses in gross revenues, it keeps an operating margin similar to that of Microsoft or about 50%.

    This means that iTunes inclusive of Apple's own Software generates as much as 15% operating margin on gross revenues. That's over $2 billion a year.

    So much for breaking even.

  7. The Conundrum of iTunes' Recognition of Revenues

    Research · 10 comments

    An excerpt from a report titled "iTunes Business Review" which I'm currently writing:

    Revenue Recognition

    Before proceeding it’s also important to understand one more detail: The company does not report all transactions through iTunes as revenue. To quote the 2012 Annual Report (10 K):

    For third-party applications sold through the App Store and Mac App Store and certain digital content sold through the iTunes Store, the Company does not determine the selling price of the products and is not the primary obligor to the customer. Therefore, the Company accounts for such sales on a net basis by recognizing in net sales only the commission it retains from each sale. The portion of the gross amount billed to customers that is remitted by the Company to third-party app developers and certain digital content owners is not reflected in the Company’s Consolidated Statements of Operations.

    What this means is that App revenues are only reported at the 30% level that is retained by Apple. The 70% paid to developers is excluded from Apple’s financial reports. The same is true for other products for which it considers to be acting as an agent. The difference seems to be mostly in cases where Apple does not define the end user pricing. This is mostly true for ebooks however that may not be true for all book titles.

    This distinction between “gross” revenues and “reported” revenues is maintained in this report but both are presented for consideration. Gross revenues are needed for comparing the media businesses against each other and for competitive assessment but reported revenues are needed to test assumptions against ground truth.

    This can be explained with an example:

    If a song sells for 99c then Apple reports all 99c as Revenue and then pays the record company about 70c and uses 30c to operate the store and pay for transaction costs. In the case of music it means the Gross Revenue is 99c and the Reported Revenue is also 99c.

    However, if an app sells for 99c then Apple reports only about 30c as Revenue. It does not consider the portion paid to developers as revenues for itself. It spends a portion of the 30c to pay for transactions, hosting, and the time testing and accepting the apps. In the case of apps and books it means the Gross Revenue is 99c and the Reported Revenue is 30c.

    So if Apple sells one song and one app then the Consolidated Gross Revenue is 2 x 99c or $1.98 but the Consolidated Reported Revenue is only $1.29 (99c + 30c).

    The difference in accounting is sometimes called "agency" vs. "wholesale" and it applies in some retail businesses. Another term sometimes used for used goods is selling items "on consignment".

    The reasoning for why some media are treated one way or another is cited in the Annual report as "the Company does not determine the selling price of the products and is not the primary obligor to the customer". In the case of Apps, the price is set by the developer and the developer is obligated to deliver on the promise. Apple acts as transaction processor and they don't consider that they ever owned (and hence never sold) the app. Note that this accounting is probably discretionary. They decided to do it this way and it's not clear that it was necessary to do it this way by any regulation.

    This distinction between two treatments of revenue makes it difficult to understand the complete story behind iTunes.

    --

    If you're interested in the full report, contact me directly.

    UPDATE:

    Apple’s rationale can be partly justified from a reading of a Financial Accounting Standards Board statement titled “Reporting Revenue Gross as a Principal versus Net as an Agent” (Emerging Issues Task Force Abstract EITF 99-19 http://www.fasb.org/pdf/abs99-19.pdf) a portion of which is quoted below.

    “Indicators of Net Revenue Reporting

    15. The supplier (not the company) is the primary obligor in the arrangement— Whether a supplier or a company is responsible for providing the product or service desired by a customer is a strong indicator of the company's role in the transaction. If a supplier (and not the company) is responsible for fulfillment, including the acceptability of the product(s) or service(s) ordered or purchased by a customer, that fact may indicate that the company does not have risks and rewards as principal in the transaction and that it should record revenue net based on the amount retained (that is, the amount billed to the customer less the amount paid to a supplier). Representations (written or otherwise) made by a company during marketing and the terms of the sales contract generally will provide evidence as to a customer's understanding of whether the company or the supplier is responsible for fulfilling the ordered product or service.


  8. Measuring the iBook market

    Research · 49 comments

    In June of 2011 Apple announced that 130 million ebooks were sold through iTunes. In October of 2012 it announced that 400 million sold.

    That means 270 million ebooks were sold in 16 months. Or about 17 million units per month, on average. It also suggests 2012 ebook sales of about 200 million units.[1] The following graph shows the download rate of books relative to apps and songs:

    Screen Shot 2013-02-28 at 2-28-3.09.25 PM

    The download rate looks paltry but we need to remember that Apps have a very low average selling price (about 23 cents including in-app purchases) and that Songs are probably priced around $1.1 on average. In contrast each ebook could be generating about $10 per download.

    However that may be a bit high. We don't know the mix of lower priced and higher priced books. Many best sellers are $13 or $14 but there might be some free books in the mix as well.

    If I choose a more conservative $9 average selling price and assuming a 70% share for the publisher then Apple's iBooks generated about $1.3 billion in payments and grossed about $1.8 billion.

    In the past few posts I measured the iTunes App ecosystem and the Music economy. With the iBook market now measured we can derive the size of the only remaining media type: video.

    Screen Shot 2013-02-28 at 2-28-3.17.57 PM

    ---

    Notes:

    1. I've seen one estimate that world-wide ebook unit sales reached 860 million implying Apple's share was about 24%.
  9. LG's new Tele-vision

    Research · 17 comments

    LG Electronics has acquired HP's WebOS for an undisclosed amount. When last it changed hands WebOS was part of Palm which was purchased for $1.2 billion in 2010.

    Palm has thus been effectively divided into several smaller pieces distributed as follows:

    HP will own:

    • Support of existing Palm users
    • Palm back-end assets including source code, infrastructure and talent
    • webOS patents

    LG will own:

    • Stewardship of the Open WebOS and Enyo open-source projects where the source code resides
    • Associated talent
    • WebOS websites
    • License for IP related to webOS

    LG announced that it plans to offer an "intuitive user experience an Internet services across a range of consumer electronics devices." In an interview, the CTO of LG said that given the current situation with Android, LG does not plan on making smartphones running webOS but will use it in televisions and other devices such as cars, signage and appliances where there are no embedded OS's. "We'd like to secure a software platform across all devices."

    Most commentary regarding the deal focused on the use of the platform for TVs but management seems to consider all devices, perhaps even phones, at some future date, to be webOS targets.

    The TV however seems to be low hanging fruit today. The TV as an app platform will be the new ecosystem war and no platform today has a lock on the developers or users. The way this rivalry will shape up will not mirror other device classes for the same reason that current device classes are platform silos.

    PCs, music players, tablets and phones all have different super-majority platform leaders. The association of a platform with a device class depends first on the distribution model, which favors a specific business model which favors a specific vendor which favors a specific platform. As each device is distributed differently, a different platform takes precedence.

    Consider that the PC has historically been purchased by IT departments which led to a monoculture of Windows which led to a persistent leadership for Microsoft.

    The music player created dominance around iTunes mostly because the distribution model for music labels was baked-in. With network effects, the iPod quickly gained and perpetually retained market share leadership.

    The smartphone business initially favored Symbian and BlackBerry because they had the market access through operators. After the touch UI became dominant (and incumbents failed to respond in a timely manner), Apple and Google took leadership as soon as they accepted the operator distribution model. Android in particular is especially resonant with operators and has been developed with their requirements in mind.

    The tablet business is more like the PC business but without enterprise requirements or patterns of purchase. This has meant that app/content ecosystems and retail distribution were the key gating factors. The story is still unfolding but so far Microsoft has not found a foothold while iOS and Android and Amazon have.

    That leads to the question of how will smart TVs be sold and which business model (or go-to-market strategy) will succeed. Steve Jobs pointed out the difficulty in trying to deliver innovation into a value chain dominated by cable companies which can effectively block it. A TV which is an application execution device rather than a content terminal will require a re-definition of the category. That will require a re-positioining of this product. Few companies are able to do that. [See also my post Tele Vision from mid-2011].

    Which brings us back to the question of webOS. As long as LG sells TVs as content terminals they might not obtain much value from webOS. If, on the other hand, LG were to use webOS to re-define their televisions to be something else entirely, namely software execution devices, sold differently and hired to do a different job than a TV, then webOS becomes not only necessary but potentially a source of great prosperity.

  10. The iTunes Value Structure

    Research · 19 comments

    The International Federation of the Phonographic Industry (IFPI) reported that global digital revenues were $5.6 billion in 2012. This represented about 9% growth from 2011 and accounted for 34% of total industry revenues[1].

    Apple regularly reports iTunes as a separate revenue item and occasionally it also reports payments data for developers and app download rates. By interpolating the data published and combining it with some assumptions it's possible to estimate the mix of revenues (and costs) associated with iTunes.

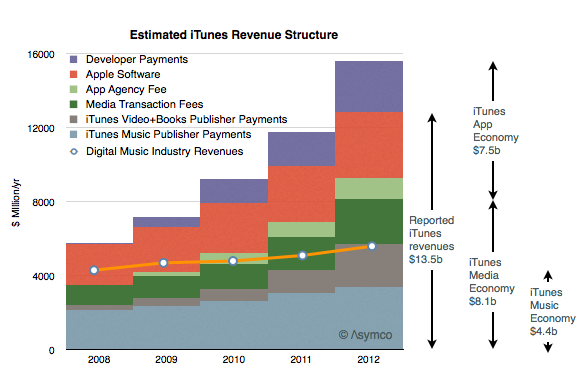
    My yearly estimates are summarized below.

    Screen Shot 2013-02-26 at 2-26-6.04.23 PM

    Note that I also included historic digital music industry revenues (as a line). I also included the following summary items:

    1. iTunes reported revenues were $13.5 billion (including Apple's own software sales)
    2. iTunes gross revenues were about $15.6 billion (including payments to developers)
    3. The iOS and OSX "App Economy" was about $7.5 billion while the iTunes "Media Economy" was about $8.1 billion (both figures include transaction costs.)
    4. The iTunes Music economy was $4.3 billion of which $3.4b was paid to music labels.[2]

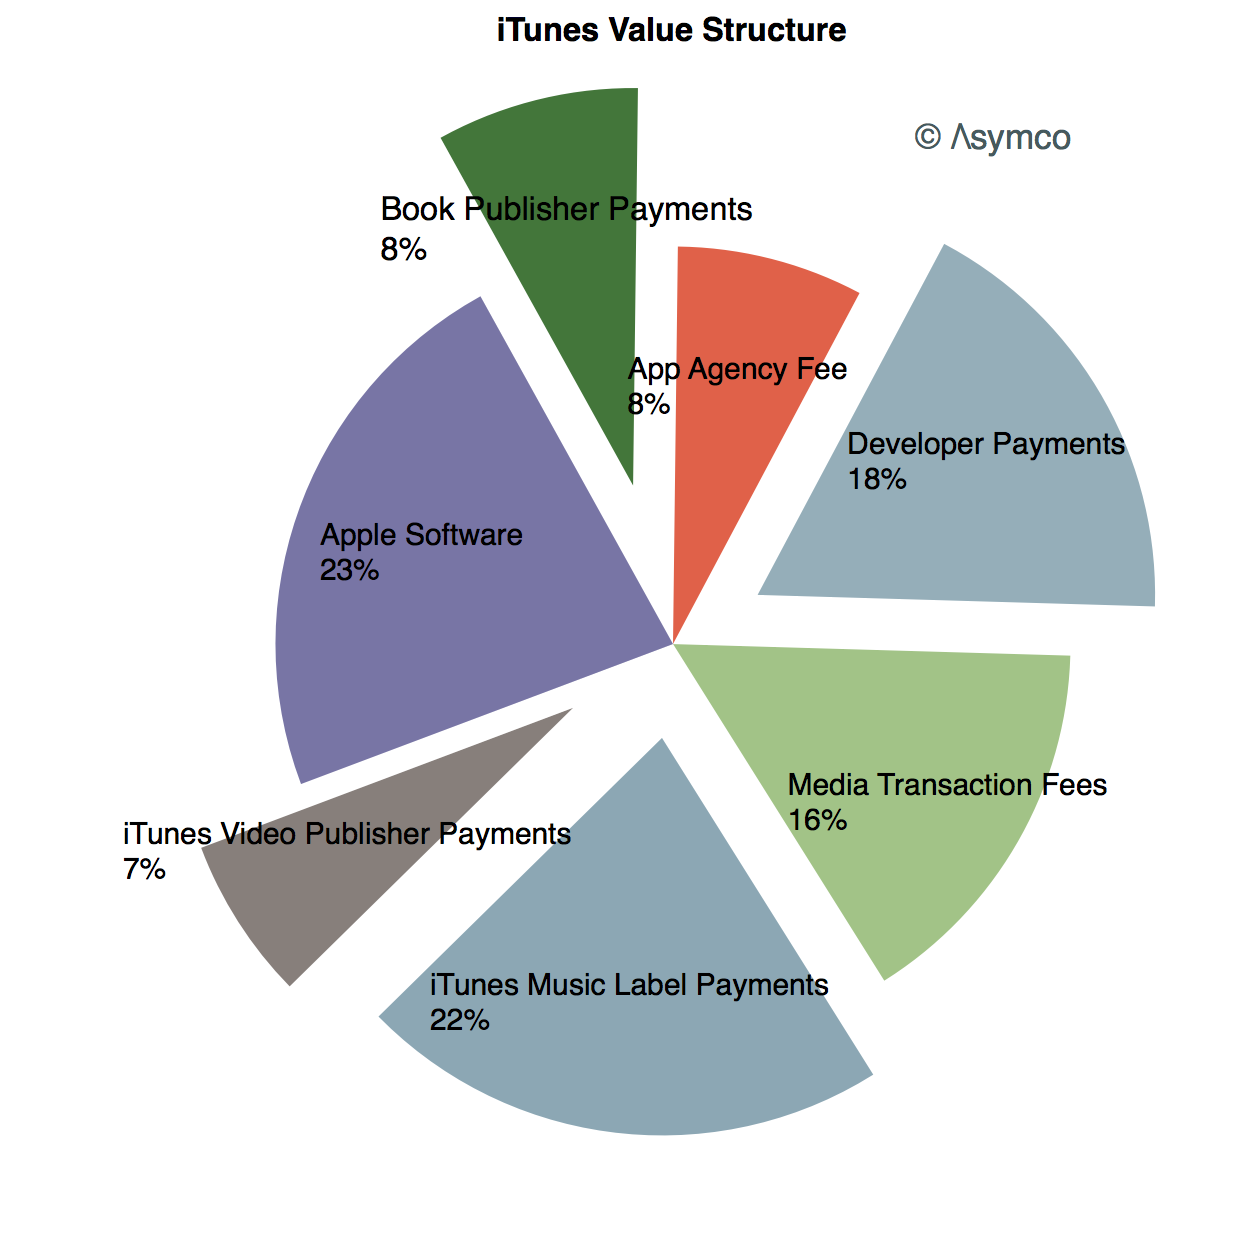
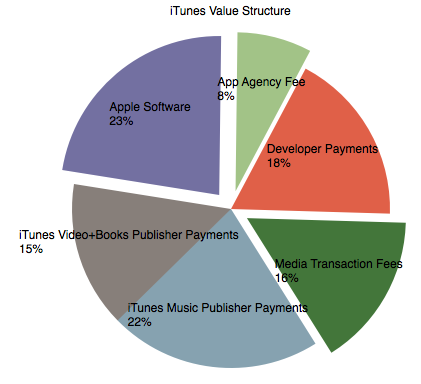
    In terms of percent of total value the components are:

    Screen Shot 2013-02-26 at 2-26-6.09.12 PM

    Looking at growth, these estimates imply that App revenues are growing at about 50% while iTunes Music is at 10% and Video+other at 90%.

    Looking at profitability, there is potential for operating margin in Apple Software and App Agency Fees and perhaps some of the Media Transaction Fees (exploded wedges above). Historically, Apple suggested that their App and Media stores ran at break-even but that may no longer be the case. Operating margins from Software may be significant.

    ---

    Notes:

    1. These revenues were from recorded music and don't include live performance
    2. My estimate for the iTunes Music payments to publishers is equivalent to about 60% of total industry revenues.
  11. Counting stool legs

    Research · 140 comments

    As Apple introduced a new set of revenue categories, the performance of its "minor" businesses has become clearer. The changes include re-statement of what used to be called "Software" revenues as part of iTunes. Apple Software includes sales of OS X, iWork and its pro tools. These products are now sold through the Mac App and since that is a part of iTunes its inclusion makes sense.

    However, we have to understand that iTunes now is a blend of many business models. Some, like music, use a wholesale revenue recognition method and have very low to zero margins, others, like eBooks and Apps, are sold using an "agency" revenue model with potentially higher margins and some, like Software, are recognized at full value with very high margins.

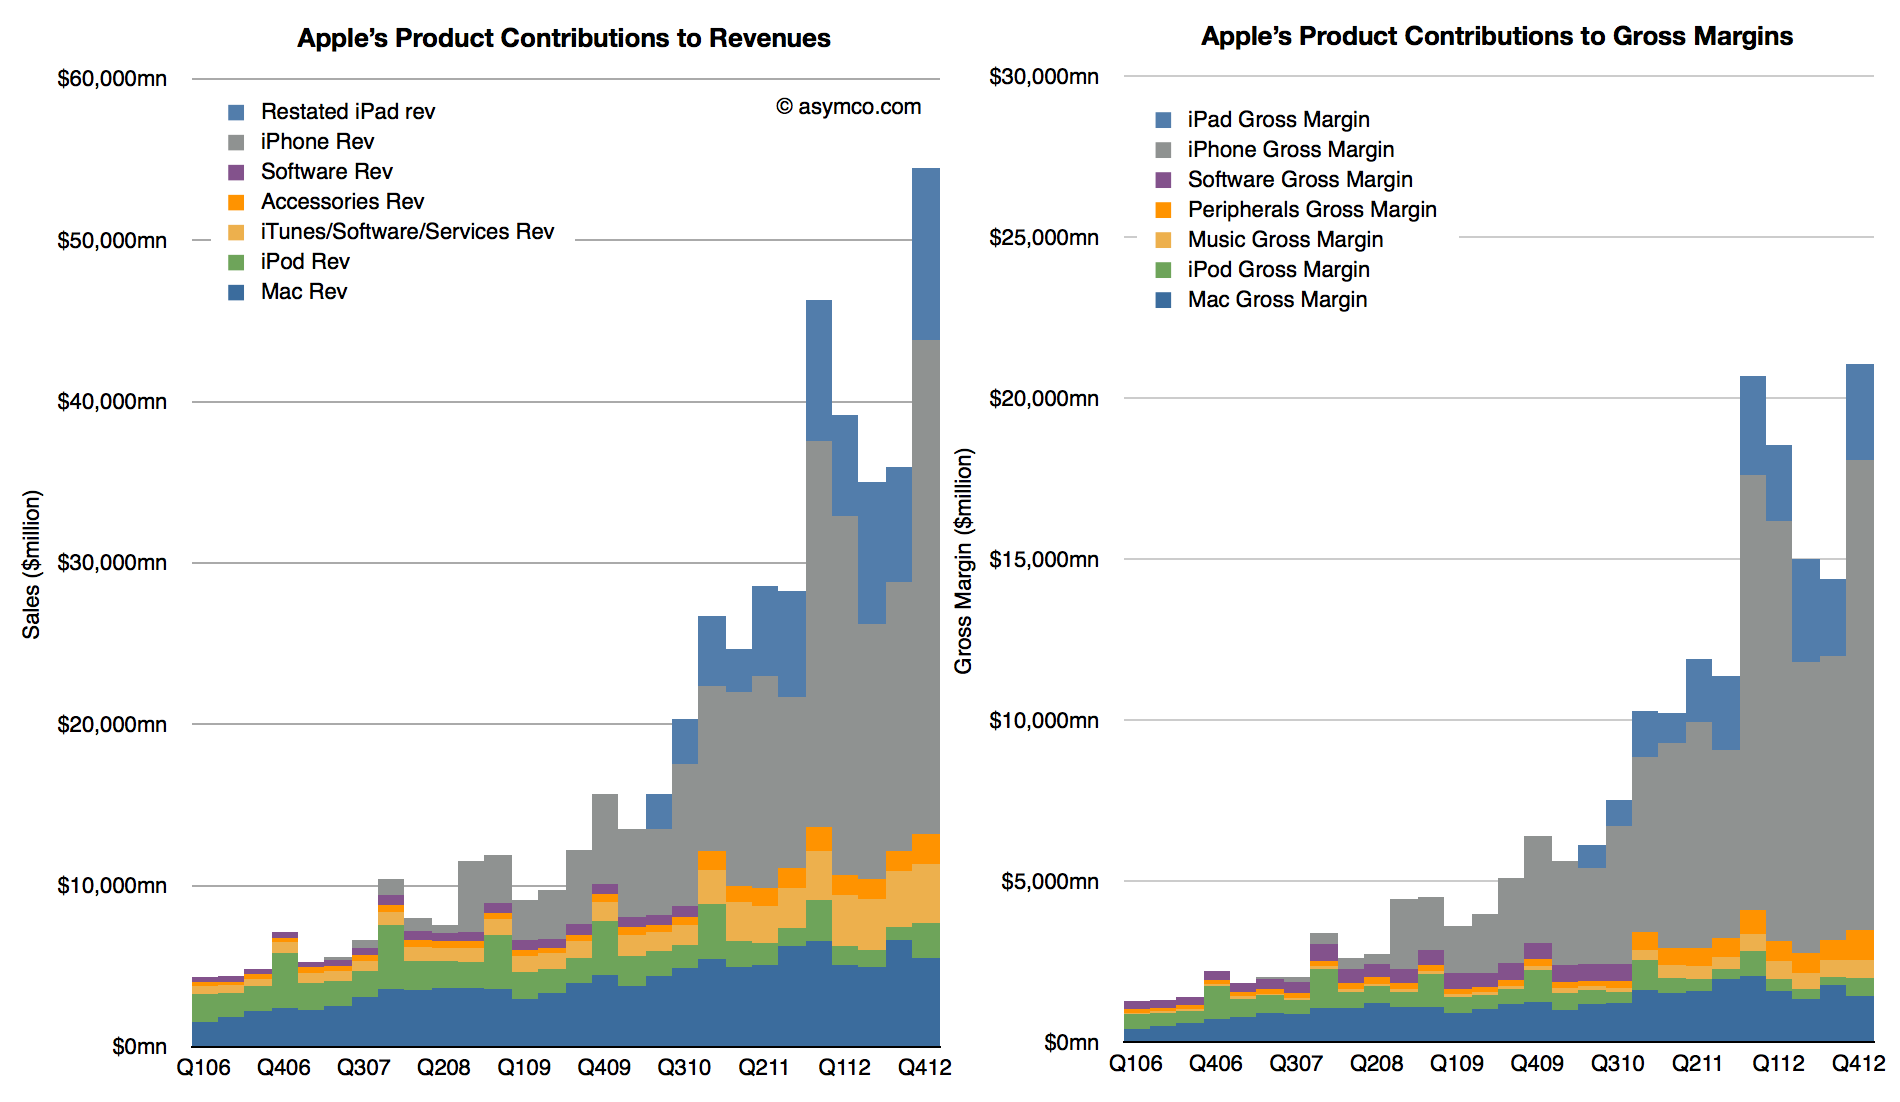
    When re-stated this way, iTunes becomes much more than a "break-even" business. My own estimate for its gross margin as currently reported is between 15% and 17% but it could be even higher. This allows the following picture to emerge:

    Screen Shot 2013-02-11 at 2-11-12.06.08 PM

    These graphs show contributions to Revenue and Gross Margins of the various reported product categories. Note that restatements for Accessories and iTunes only extend back to Q4 2010 and the older "Software" is still shown for earlier periods.

    Note also that Accessories are now including some of the revenue that used to be reported as part of iPad and iPhone revenues. This was discussed in more detail here.

    There are several observations we can make:

    1. iTunes now becomes a steadily and rapidly growing business. Growth over the previous two years averages well over 30% and is consistent across seasons.
    2. The absolute revenue number is substantial: $13.5 billion for 2012 (up from $10.2 billion in 2011).
    3. Assuming a gross margin of 15% to 17% yields contribution of $2 billion in margin in 2012 and $1.6 the year before.
    4. iTunes is now Apple's fourth largest business, having overtaken the iPod in revenues two years ago
    5. iTunes growth relative to the Mac means that it could become the third largest business during this year.

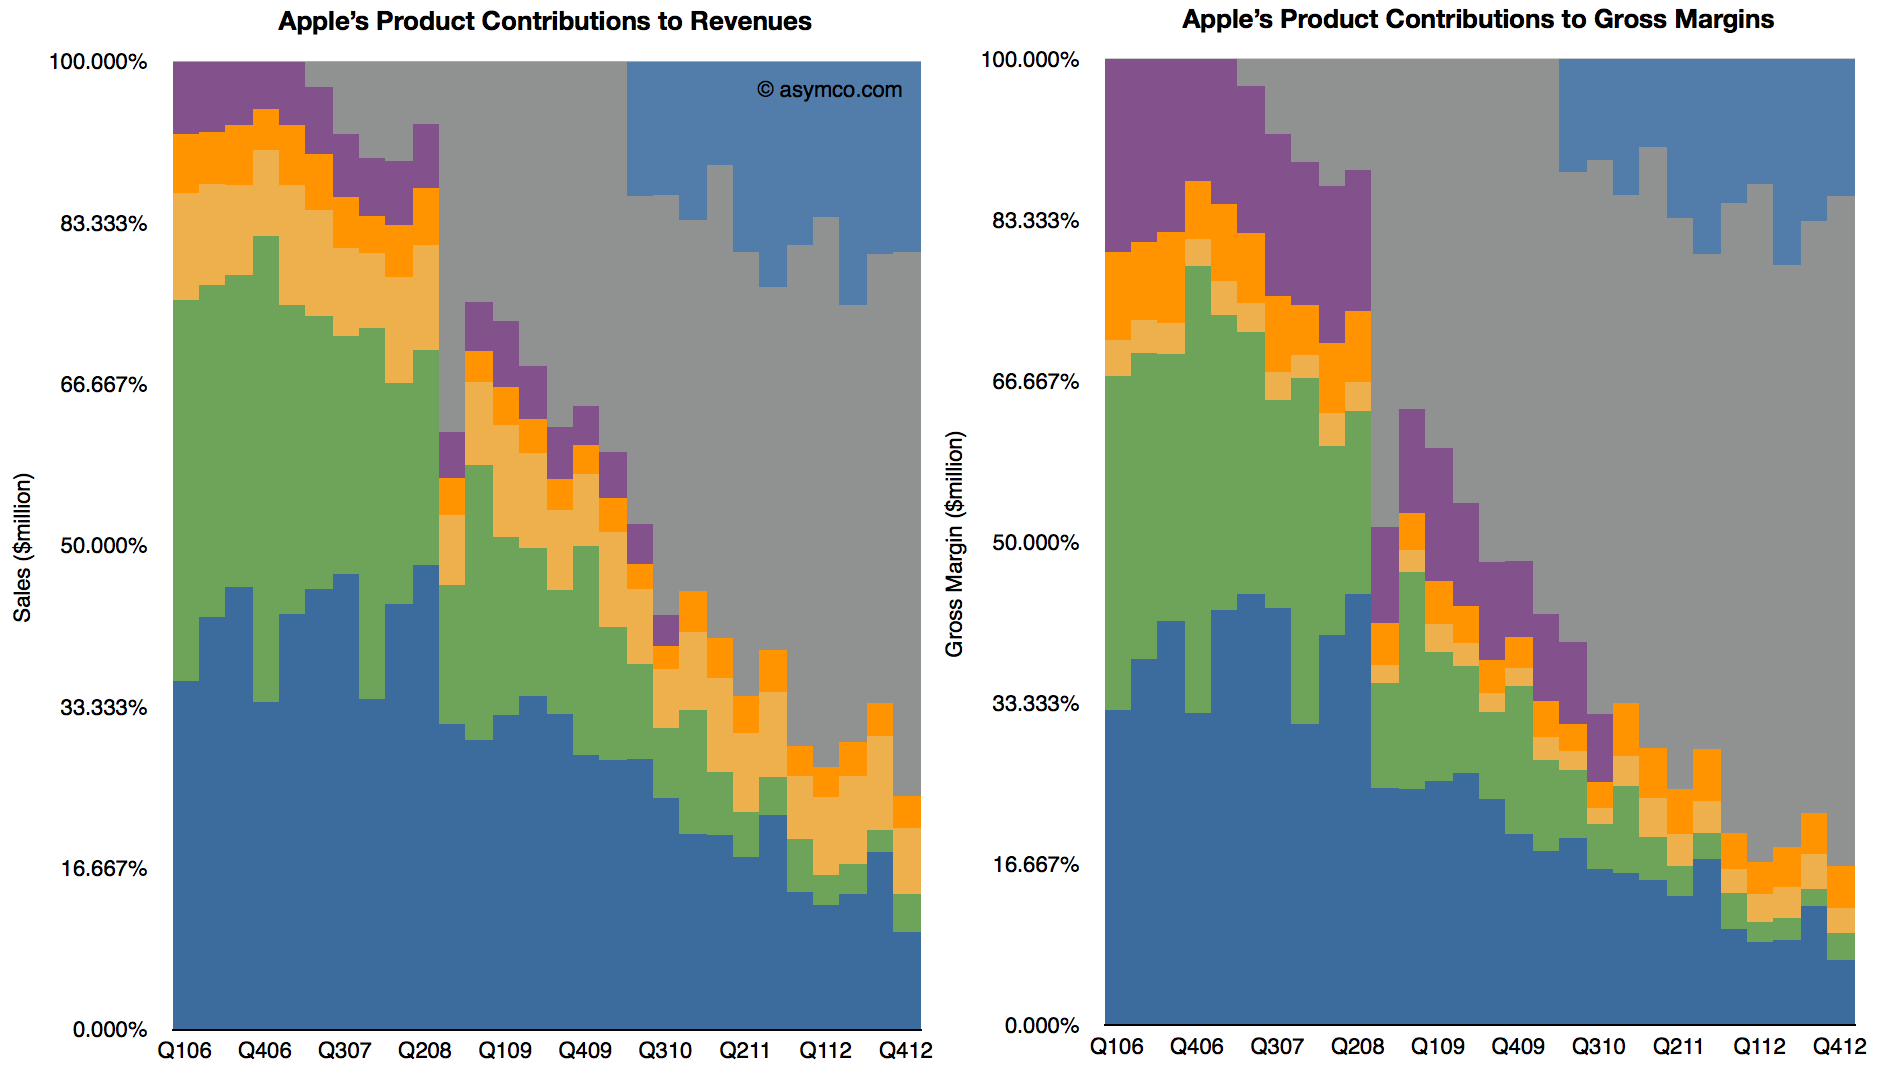
    When seen this way, as a percent of total, iTunes begins to look increasingly as a viable "leg stool" upon which Apple rests. Note that in the following charts the percent of total for iTunes holds steady while Mac and iPod decline.

    Screen Shot 2013-02-11 at 2-11-12.24.44 PM

    Adding the Accessories business (which includes Apple TV and is showing in Orange above) these "other" businesses are already bigger than the Mac. Of course, content, software, accessories and services depend on a healthy device business, but the size of these ancillaries are beginning to be substantial and Apple's ecosystem may begin to be valued more than just as an incentive to buy the devices.

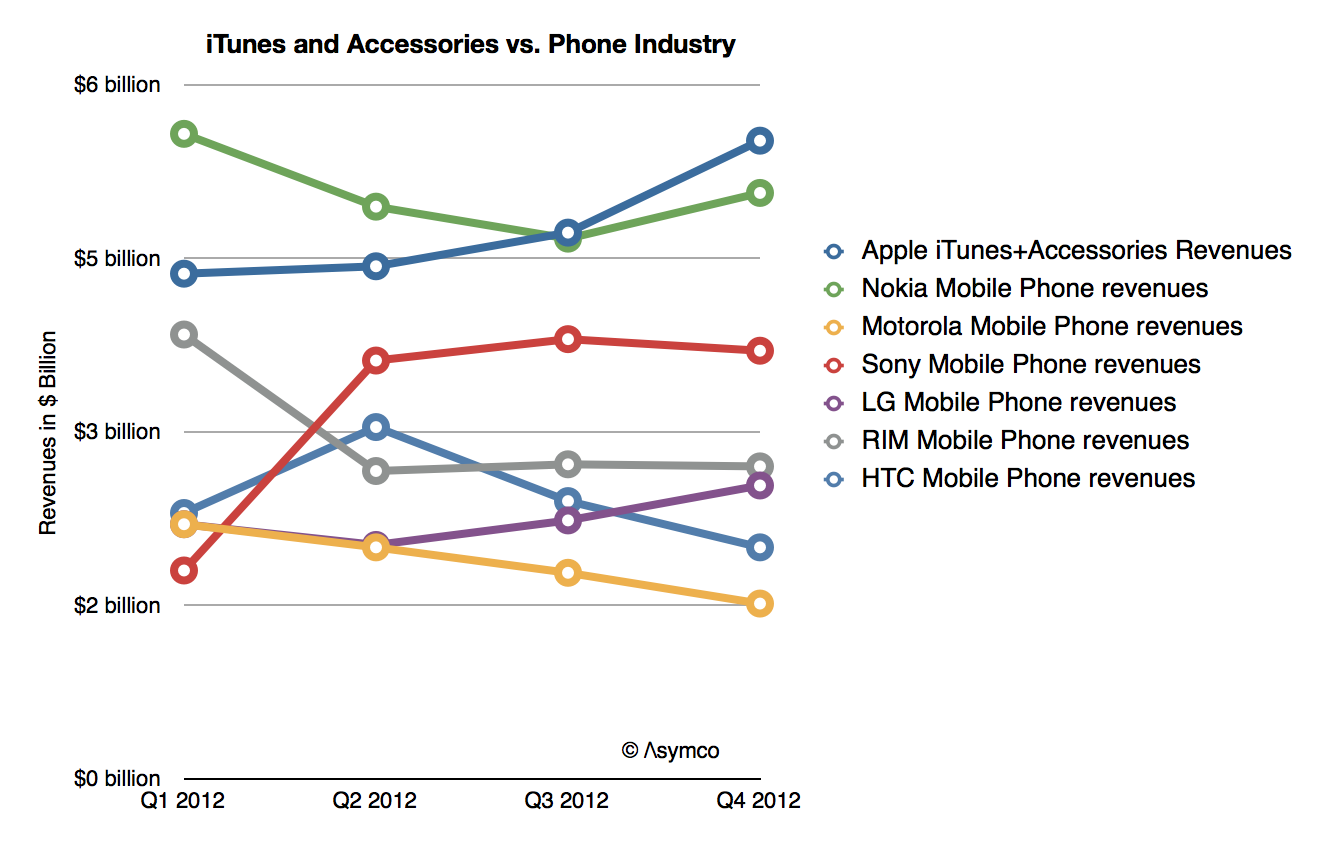
    Indeed, if seen in isolation, iTunes+Accessories combined is a bigger business in terms of revenues than any of the other phone vendors except Samsung:

    Screen Shot 2013-02-11 at 2-11-12.36.14 PM