Attach rates for iCloud reached about 42%, while Apple Music stood near 30%
The iPhone ecosystem is showing signs of increased customer loyalty and steady demand, while its high-margin services business remains a key support to profitability, according to UBS analysts.
The bank, which maintains a 'Neutral' rating on Apple with a 12-month price target of $280, cited findings from its Evidence Lab survey of roughly 4,000 iPhone users globally. The data suggests that iPhone “stickiness” continues to improve, even as replacement cycles remain relatively stable.
UBS said the average age of iPhones in use globally was largely unchanged year-over-year at about 33 months. Outside China, device age edged slightly higher to around 38 months, a trend the analysts said could push some upgrade demand into 2027.
At the same time, customer retention strengthened, with the global iPhone retention rate rising about 200 basis points to roughly 74%. Gains were particularly notable in the United States and China, where retention increased by 200 and 700 basis points, respectively. UBS belives that this indicates Apple is maintaining share despite a competitive smartphone market.
Purchase intent also improved across regions, with more surveyed users indicating their next smartphone would be an iPhone. The UK recorded the largest increase, while China also saw a meaningful rise despite what UBS described as a challenging competitive backdrop.
The report highlighted continued growth in Apple’s services ecosystem, particularly iCloud and Apple Music. Attach rates for iCloud reached about 42%, while Apple Music stood near 30%, trends UBS said should help sustain services gross margins above 75% through fiscal 2026 and 2027.
Higher-tier iCloud usage is also increasing, even as Apple raises base storage on newer devices. Among iPhone 17 users, 77% reported subscribing to mid- to high-tier iCloud storage plans, compared with roughly 60% across the broader installed base. UBS noted that additional services uptake carries incremental gross margins of at least 90%, helping offset potential pressure from rising memory costs.
On the hardware side, consumers are also opting for higher storage configurations. UBS wrote that 56% of iPhone 17 users purchased models with more than the base storage, up about 800 basis points year-over-year. This shift could support product margins, with incremental storage estimated to generate gross margins of around 75% on roughly one-fifth of sales.
Looking at the installed base, UBS estimates about 68% of iPhones in use are from the 14 through 17 series, while around 40% are Pro or Pro Max models. The analysts said this premium segment could be a target market for a potential foldable iPhone, though they expect the opportunity to be relatively limited given the anticipated price range of $2,000 to $2,500.
UBS estimates a foldable launch could result in as many as 8 million units in fiscal 2026, contributing roughly 6 million incremental iPhone shipments, or about a 2% uplift to its forecast of 251 million units.
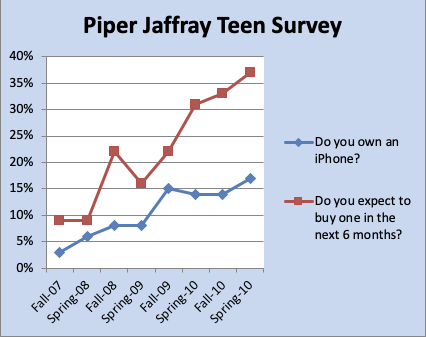
Apple's iPhone continues to be incredibly popular with U.S. teens, according to Piper Sandler's latest biannual teen survey. 88 percent of teens surveyed said that they own an iPhone, and 88 percent said they intend to purchase an iPhone as their next device.
Teen iPhone ownership numbers have increased three percent since April 2024, and are near record highs. The iPhone has long been the most popular smartphone among teens in the United States, and there has been steady growth in teen ownership. 10 years ago in April 2015, 66 percent of teens surveyed owned an iPhone.
Though teen interest in the iPhone is high, other Apple products and services are not as popular. Apple has not made inroads with Apple TV+, and it continues to trail Spotify as the most popular music service among teenagers.
45 percent of teens surveyed have a paid Spotify subscription, while Apple Music is the second most popular streaming service with 30 percent of teens reporting an Apple Music subscription. Because Spotify has a free tier, it's still the most popular service overall, with 65 percent of teens using it. Apple TV+ is not popular with teens, and less than one percent say they watch Apple TV+ shows. Netflix and YouTube were most popular with 31 percent and 26 percent of teens reporting usage, respectively.
Approximately 31 percent of teens own a virtual reality device, but most of those have an Oculus (25 percent). Just one percent of teens have an Apple Vision Pro, which is not a surprise given the price of Apple's device. Of teens that have a VR device, 60 percent said that they seldom use it, with just four percent reporting being a frequent daily user.
Piper Sandler surveyed 6,455 teens across 43 states for the spring 2025 report.
This data was collected in the spring of last year.
I found the above in my archives. Ownership in 2010 was about 18%, 2015 it was 66% and 2025 it was 88%. The saturation at 88% (for both ownership and intent) was achieved relatively quickly but most importantly, it remains steady.
Now consider that the teens of 2007 are having kids of their own. A 15 year old in 2007 is now 34 and a 19 year old is now 38 and some have a teen of their own.
At 19 years, the iPhone brand has transitioned across one generation with not only resilience but with deeper entrenchment. This cannot be said for other contemporary technologies, e.g. social media. While elders use Facebook the young have moved on. Perhaps to Instagram (25-34, 76% 18-29) or perhaps to TikTok (16-24) which has the strongest position for younger, Gen Z users.
Here are some additional data points on predisposition for social media:
Facebook (25-49): Largest group is 25-34 (31.1%), but also high usage among 30-49 year olds. LinkedIn (30-49): Professional focus, ideal for B2B and adults 30-49. YouTube (18-64+): Broad, with the highest usage (93%) in the 18-29 bracket. Pinterest (30-49): Popular with older, female audiences.
There is quite a lot of divergence and only YouTube seems to be fairly steady across age groups.
Moreover, as the Piper Sandler survey suggests, Apple Services is not the same as the iPhone. The adoption of Music and TV are not a broad-based and that has a lot to do with disposable income. The mechanism for adoption should be the family plan whereby teens are automatically enrolled through their parents in to Music and TV+. After all, teen iPhones are likely purchased by parents. That services bundling is where Apple must focus its effort.
The current Apple Music catalog features over 100 million songs as of late 2025. This massive library places it at the very top of the streaming industry, tied with other major giants like Spotify and Amazon Music. Since its launch in 2015, Apple Music has aggressively expanded its library, growi...
According to JP Morgan analyst Samik Chatterjee, citing Sensor Tower, Apple's App Store revenue for May 2025, increased by 4.9% month-over-month (which compares to an average sequential increase of 2.3%) and an acceleration of year-over-year revenue to 13.0% in May versus up 11.8% in April. On a year-over-year basis, the App Store downloads increased by 3.1% in May (versus +5.8% in April) according to Chatterjee.
This analysis is based on app download sampling and may be indicative of the activities of consumers on the App Store. Services revenue in the first calendar quarter was $26.6 billion, up 12% year-over-year and at an all-time revenue record. Services gross margin was 75.7%, up 70 basis points sequentially, also an all-time record.
The world however seems to be having a problem with Apple Services. After years of skepticism of its relevance, now that it has achieved a run level above $100 billion/yr., it's being criticized for being harmful to competition.
The comments that it's unfair to developers or that it deters innovation are uninformed to say the least. What is missing from that analysis is that the App Store is only a small fraction of the entire ecosystem around Apple's platforms and that the economic activity the platforms enable is immense.
Let's learn.
Over the last year Apple reported a bit more than $102 billion in revenues for Services at a very high margin. The reason it was such a high margin was partly due to the fact the Services does book all payments from customers through the App store as revenues. In other words it does not include payments to developers as either revenue or costs. Those payments pass through but they are certainly part of the economic activity on the store. It would be indeed unusual for a physical store not to report what it pays for what it sells as part of revenues. But this is the basis Apple chose (or was obligated to choose) as the way to report App Store revenues.
Thus considering the payments to developers, the economic activity directly related to the App Store amounts to $120 billion/yr which includes commissions of about $30 billion/yr (last 12 months) and payments to developers of about $90 billion/yr (implying about 25% blended average commission rate.)
So including payments to developers the Services business grosses $186 billion/yr. of which 102 billion is reported as revenue, with the 75% gross margin and $90 billion is paid to developers "off the books".
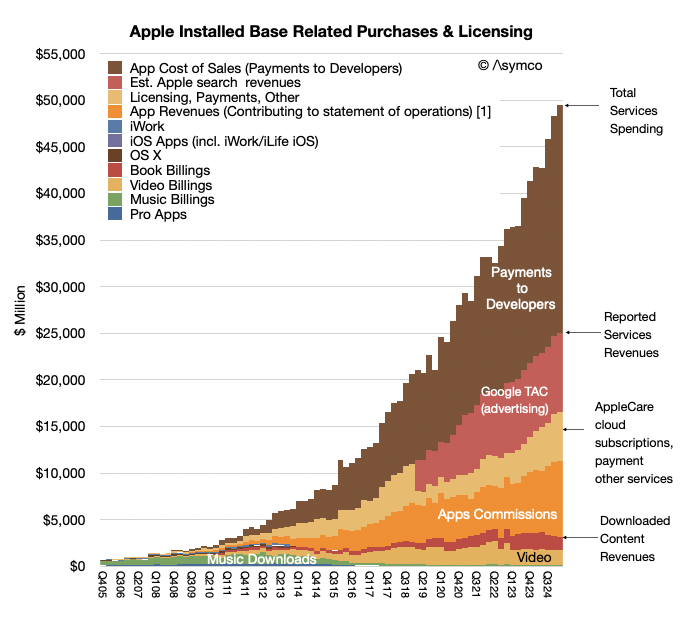
But that $102 billion in revenues is only about 30% App Store commissions. The rest includes many types of income: It includes:
Advertising which consists of Apple's own advertising services and third-party licensing arrangements notably the distribution fees for Google search (accounting for most of Googles "TAC" or traffic acquisition costs.
AppleCare, Apple's own extended warranty service.
Cloud Services which provide content synchronization.
Digital Content which not only includes the App Store but also stores for books, music, video, games and podcasts. Apple also offers digital content through subscription-based services, frequently bundled, including Apple Arcade, essentially a game subscription service; Apple Fitness, a personalized fitness service; Apple Music, which offers music streaming and on-demand radio stations; Apple News, a subscription news and magazine service; and Apple TV, which offers exclusive original content produced by Apple and live sports access licensed sometimes exclusively by Apple.
Payment Services which offers Apple Card, a co-branded credit card, and Apple Pay, a cashless payment service.
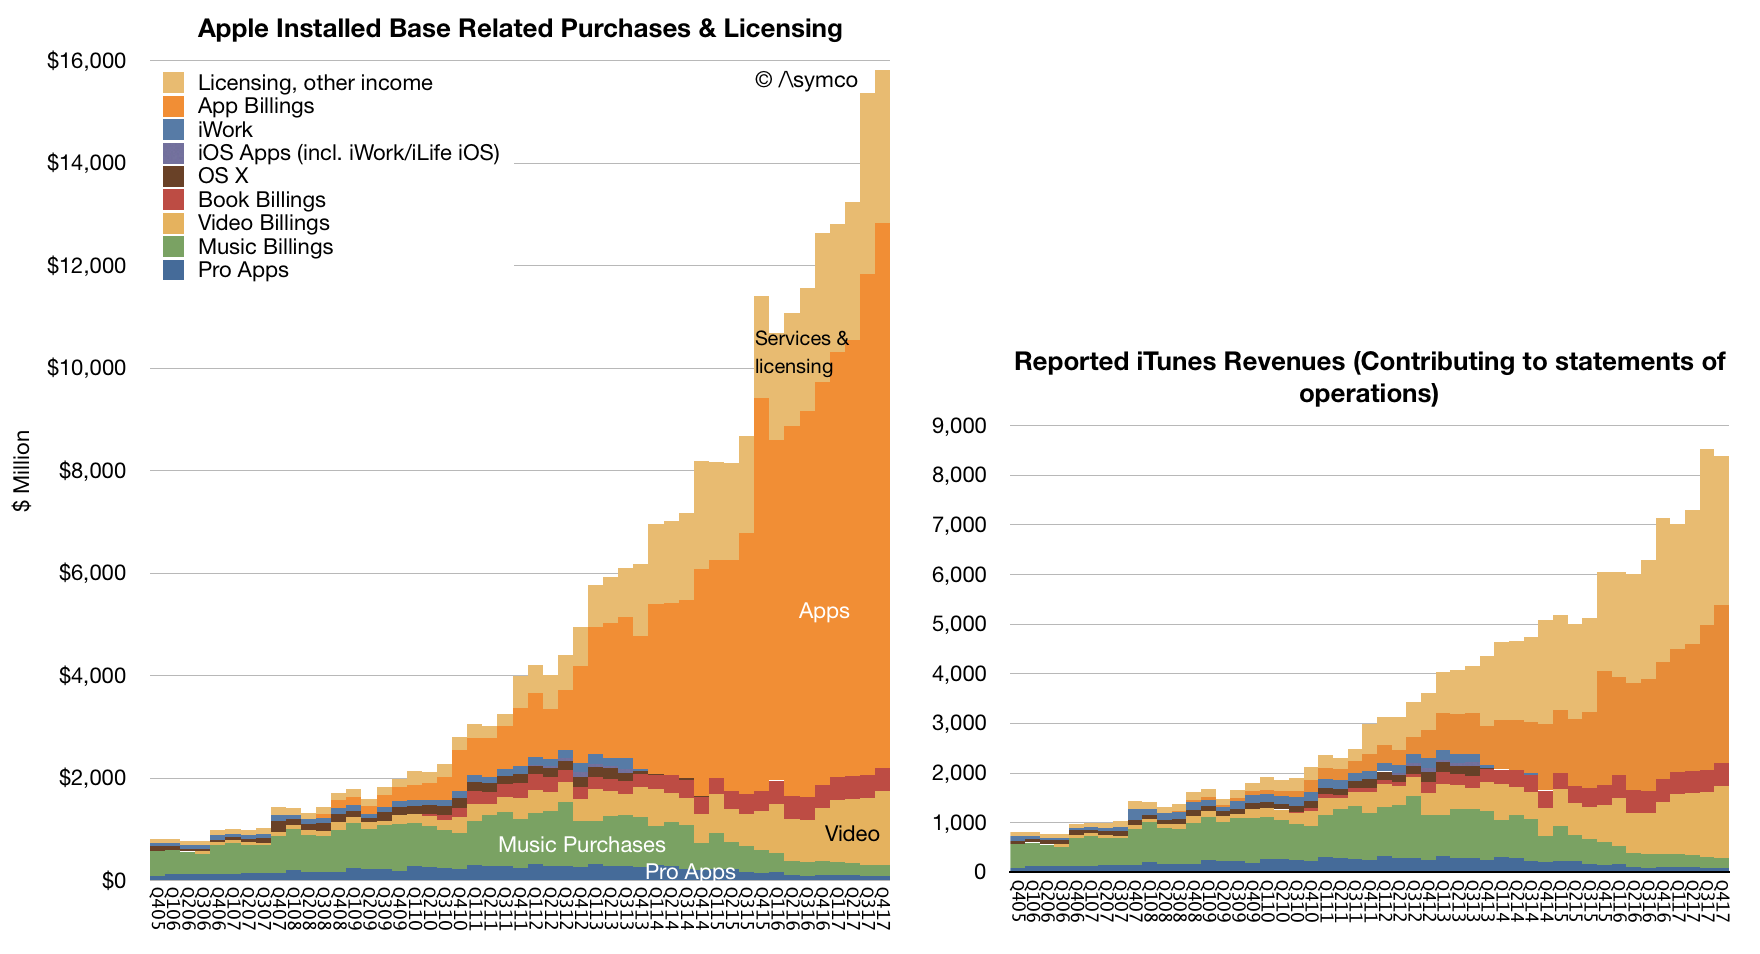
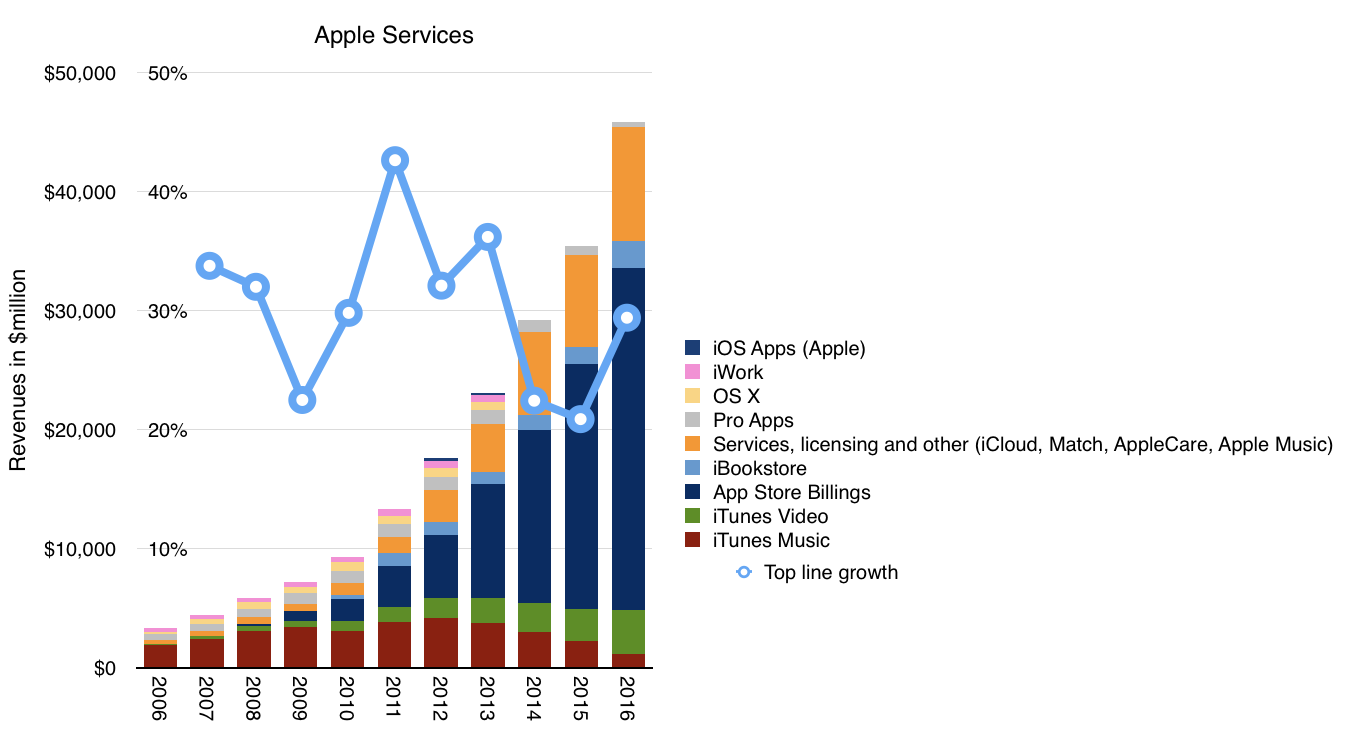
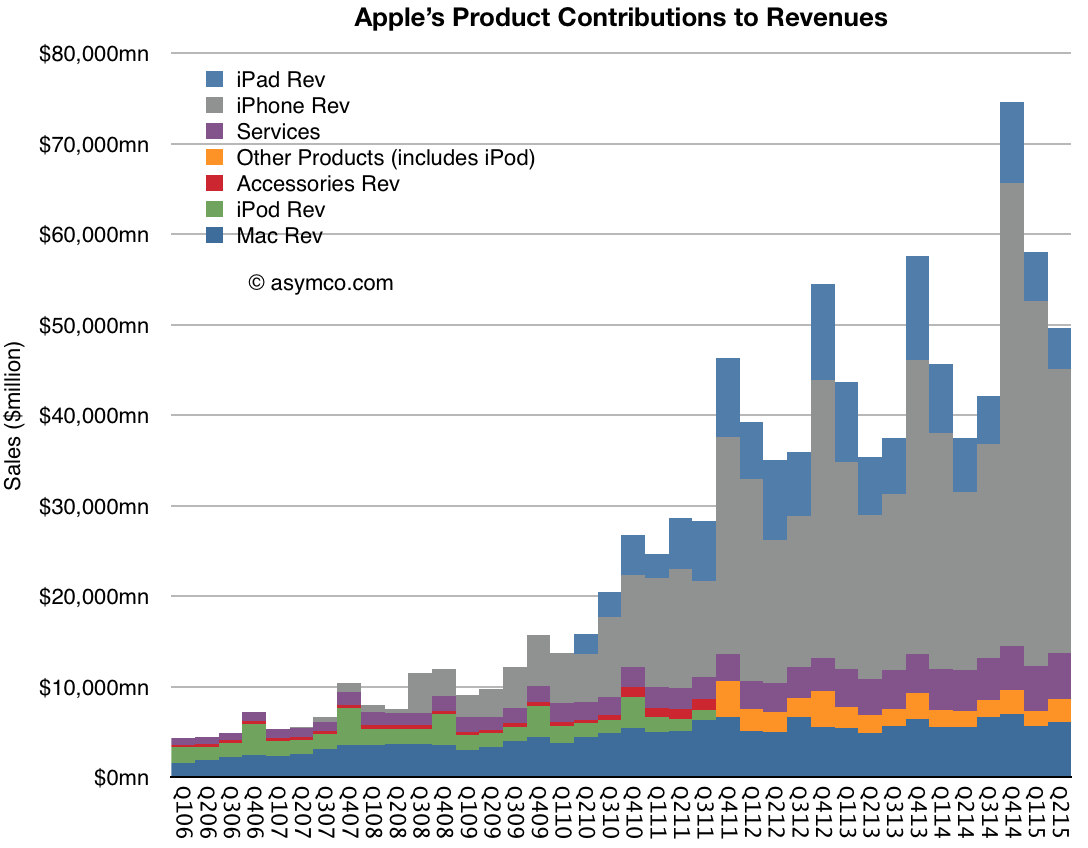
The quarterly view is summarized in the graph above. So a fixation on the commission is only a view into 16% of Services as an economic foundation (the orange area in the graph above).
But that's still only a sliver of the whole picture.
A report written by Jessica Burley, Analysis Group and Professor Andrey Fradkin, Boston University Questrom School of Business has estimated that the global App Store ecosystem facilitated $1.3 trillion in developer billings and sales in 2024. As the report writers say: "For more than 90% of the billings and sales facilitated by the App Store ecosystem, developers did not pay any commission to Apple."
How is this not visible? The reason is that this economic activity is distributed over the millions of purchases Apple users make through its iOS Apps every day. This includes traditional App Store "Billings" including paid downloads and in-app purchases, including subscriptions, that use Apple’s in-app purchase system and “Sales” which includes money spent by customers purchasing goods and services in general using any iOS and iPad OS apps. Apps developed by Apple such as Apple Music, Safari or browser apps such as Chrome are excluded from this analysis.
The economic activity unleashed by the App Store now reaches well over $1.3 trillion/yr. As the authors further explain,
While the present analysis captures the major app monetization strategies available to developers, the full economic impact of the App Store ecosystem extends beyond the estimates provided in this report, as the current methodology does not capture all of the ways in which the App Store ecosystem facilitates sales, or all of the benefits created by apps. For example, the App Store supports “companion apps” that raise the value of a company’s goods and services, including smart home apps and health apps. In addition, many apps now use different monetization strategies. As such, this analysis does not account for all the ways in which the App Store ecosystem creates value.
Furthermore the report breaks down the categories as Digital Goods and Services, Physical Goods and Services, M-Commerce (General Retail, Travel, Food Delivery and Pickup, Grocery, Ride Hailing), Digital Payment and In-App Advertising.
In addition the report estimates these categories from 2019 as well as 2024 providing a growth perspective: Over the past five years, the App Store ecosystem has more than doubled in size, increasing from $514 billion in 2019 to nearly $1.3 trillion in 2024.
It also identifies regional dynamics between the US, China, Europe (with select countries) and Rest of World (with select Asian countries).
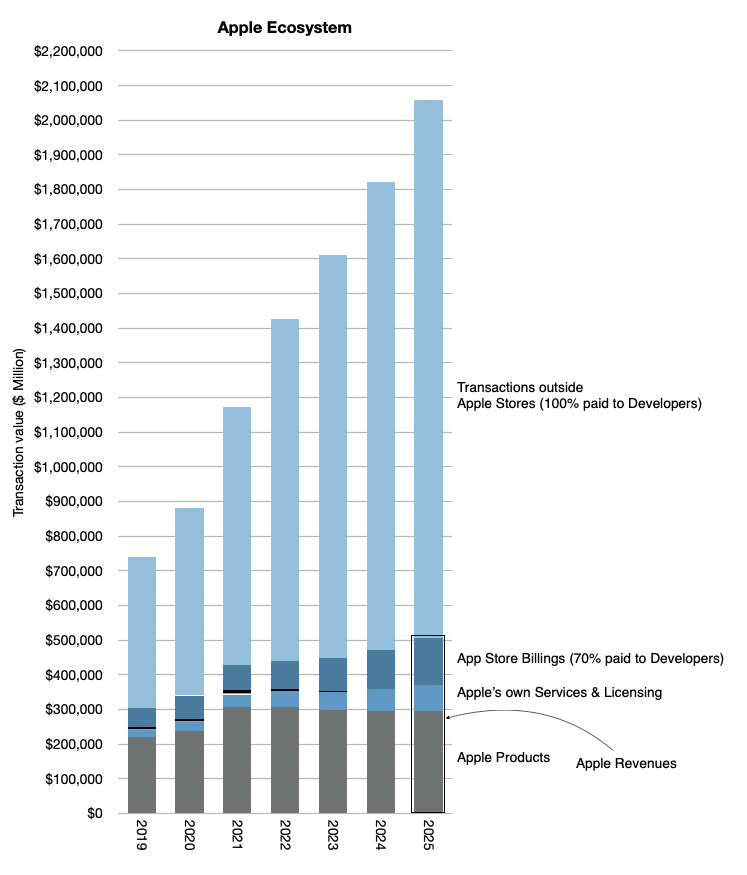
I've been keeping my own analysis of what I called the Apple Economy and it includes these transactions outside the App Store and Apple's own products and services. If I were to subtract Apple's own revenues from the total, for 2024 I was getting about 1.4 trillion (out of a total of over 1.8 trillion).
My point was always to estimate the economic impact of Apple beyond its own sales. This gave us perspective to assume that in 2025 the total would reach over $2 trillion. The graph below gives the perspective which also implies a doubling since 2020 to 2024.
The new report from Burley and Fradkin is a detailed, bottom-up analysis which quantifies what was perceived as the economic value of Apple being far more than what the financial data records.
Bill Gates once stated in reference to Zuckerberg's assertion that Meta was developing a "platform" that it's not a platform unless the economic value of everybody that uses it exceeds the value of the company that creates it.
Apple captures about $30 billion as sales but delivers over $1.3 trillion in sales, a multiple of 43! I would call that generous. In addition it doubles the market in 4 to 5 years. I'd call that market expanding not constraining. Finally, it's a market that Apple created out of nothing. I'd call that market creation not destruction.
If judged on the question of creation and satisfaction of the customer, i.e. the ultimate purpose of the firm, the App Store and Services in general has satisfied 1.4 billion people. That they are spending over $1.3 trillion and doubling in 4 years is nothing short of astonishing.
We'll discuss this topic and other topics related to Apple at ACTIVE: The Apple Investor Conference, which takes place on next Tuesday, June 10th, the day after the WWDC25 keynote.
The following is a transcript of the comments from Tim Cook (CEO) and Luca Maestri (CFO) at Apple's Q1 2018 Earnings Conference Call February 1, 2018. I color coded my interpretation of the comments into four categories:
Grey: Background and promotional commentary
Red: Strategy and signals of what management considers important and may include data beyond the regularly reported numbers.
Green: Financial data
Black: Commentary.
Blue: My commentary, in brackets.
For a quick read of Apple's strategy, read the Red text. These comments are not repeated in financial reports. Highly recommended.
For a quick read of Apple's financial performance, read the green text (which are replicated in financial reports). Read this if you don't want to wade through the financial reports.
For marketing or product material, read the grey text.This is sometimes unique but also repeats product launch information.
---- Tim Cook: Thanks, Nancy and thanks everyone on the call, and welcome to everyone today. Before we dive into the quarter, I'd like to take a moment to talk about a significant milestone we recently crossed.
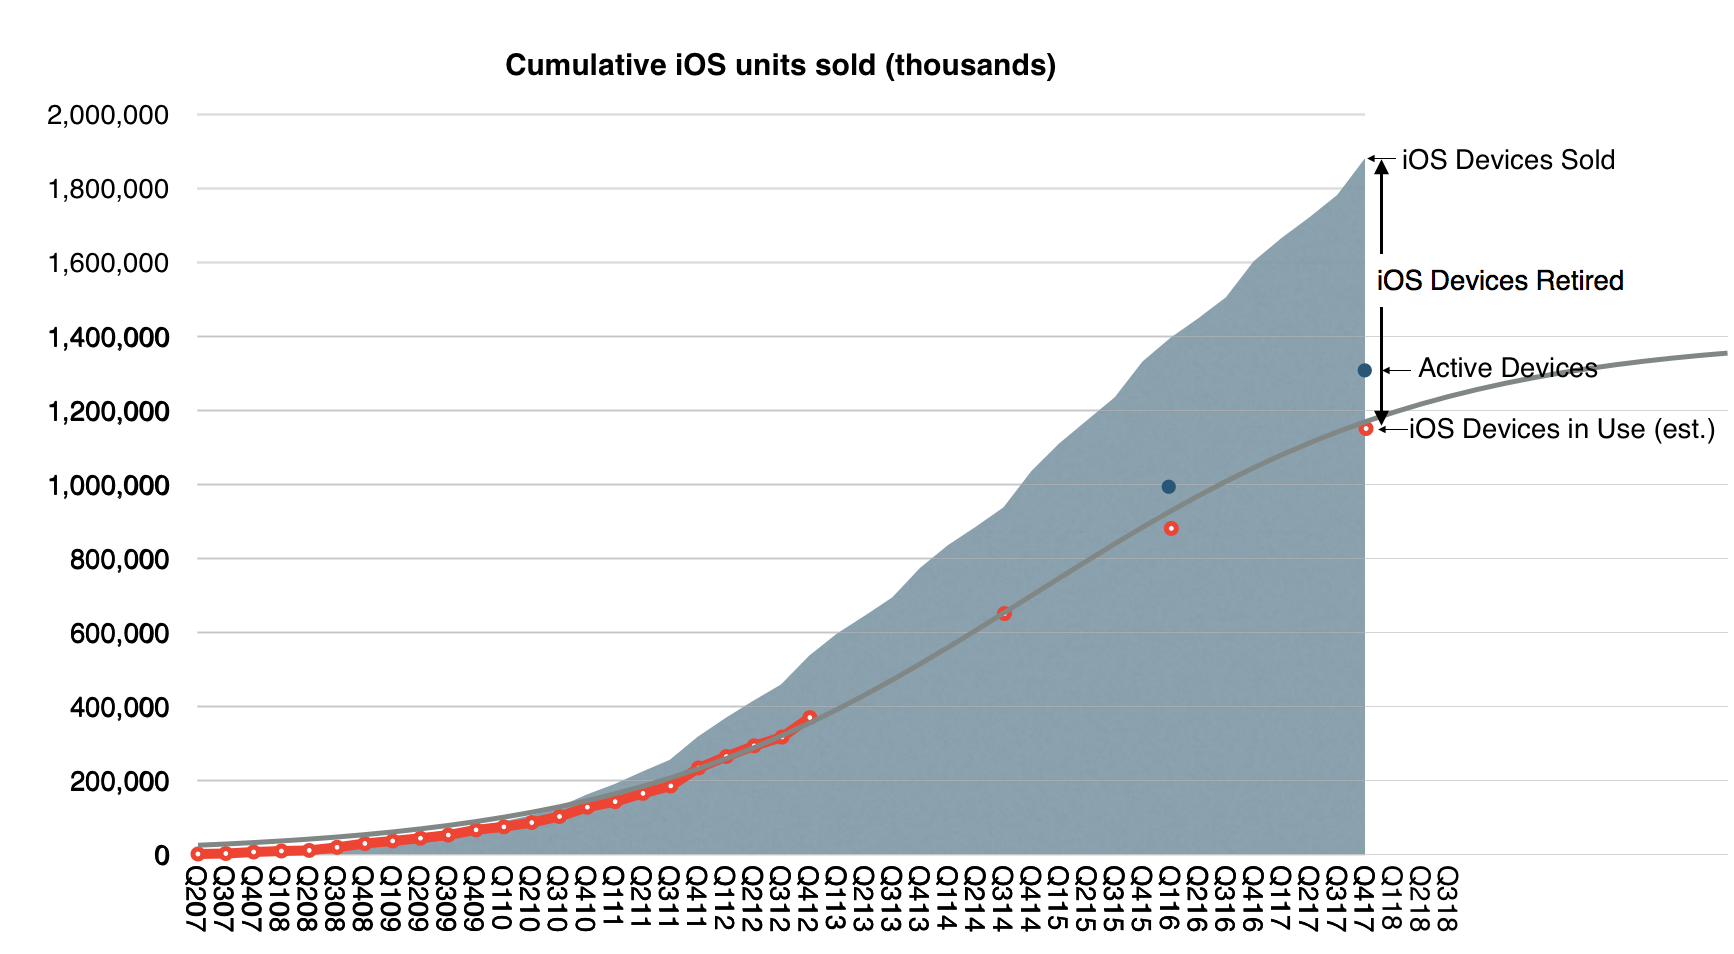
Apple's active installed base reached 1.3 billion devices in January and is at an all-time high for all of our major products. 1.3 billion devices represents an astonishing 30% growth in just two years. It speaks to the strength and reliability of our products and our ecosystem, as well as the loyalty, satisfaction and engagement of our customers. It's also fueling tremendous growth in our services business, which I’ll talk about a little later in the call. [This is probably Apple's most important number. For at least the next 20 years this is the key performance metric and it can be used to derive company's valuation. A summary of the history of active devices vs. units sold is shown in the graph below:]
Turning to the December quarter. We're thrilled to report Apple's biggest quarter ever, which set new all-time records in both revenue and earnings. We generated revenue of $88.3 billion, which is above the high-end of our guidance range, and it is up almost $10 billion or 13% over the previous all-time record we set a year ago.
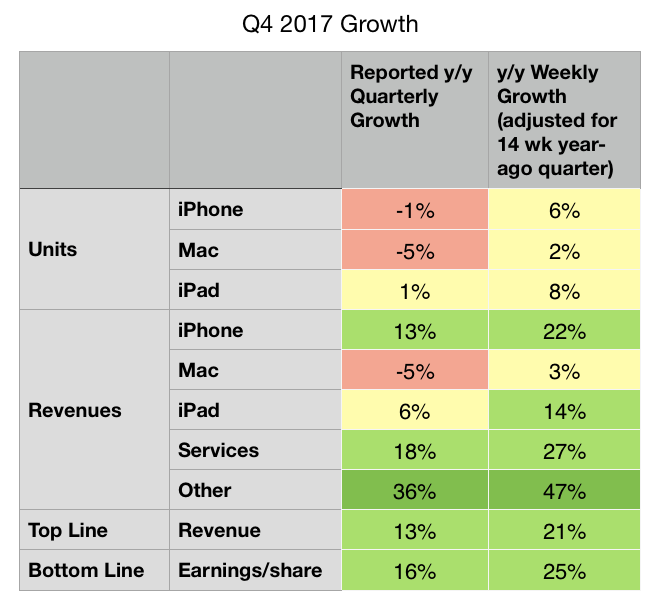
It's also our fifth consecutive quarter of accelerating revenue growth with double digit growth in each of our geographic segments around the world. What makes us even more remarkable is that the quarter we're reporting today was 13-weeks long, while the year ago quarter was 14-weeks. When we look at the average revenue per week in the December quarter this year compared to last year, our growth was a stunning 21%. [The 13-week vs. 14-week year-on-year comparison is repeated several times. The summary differences are shown in the table below:]
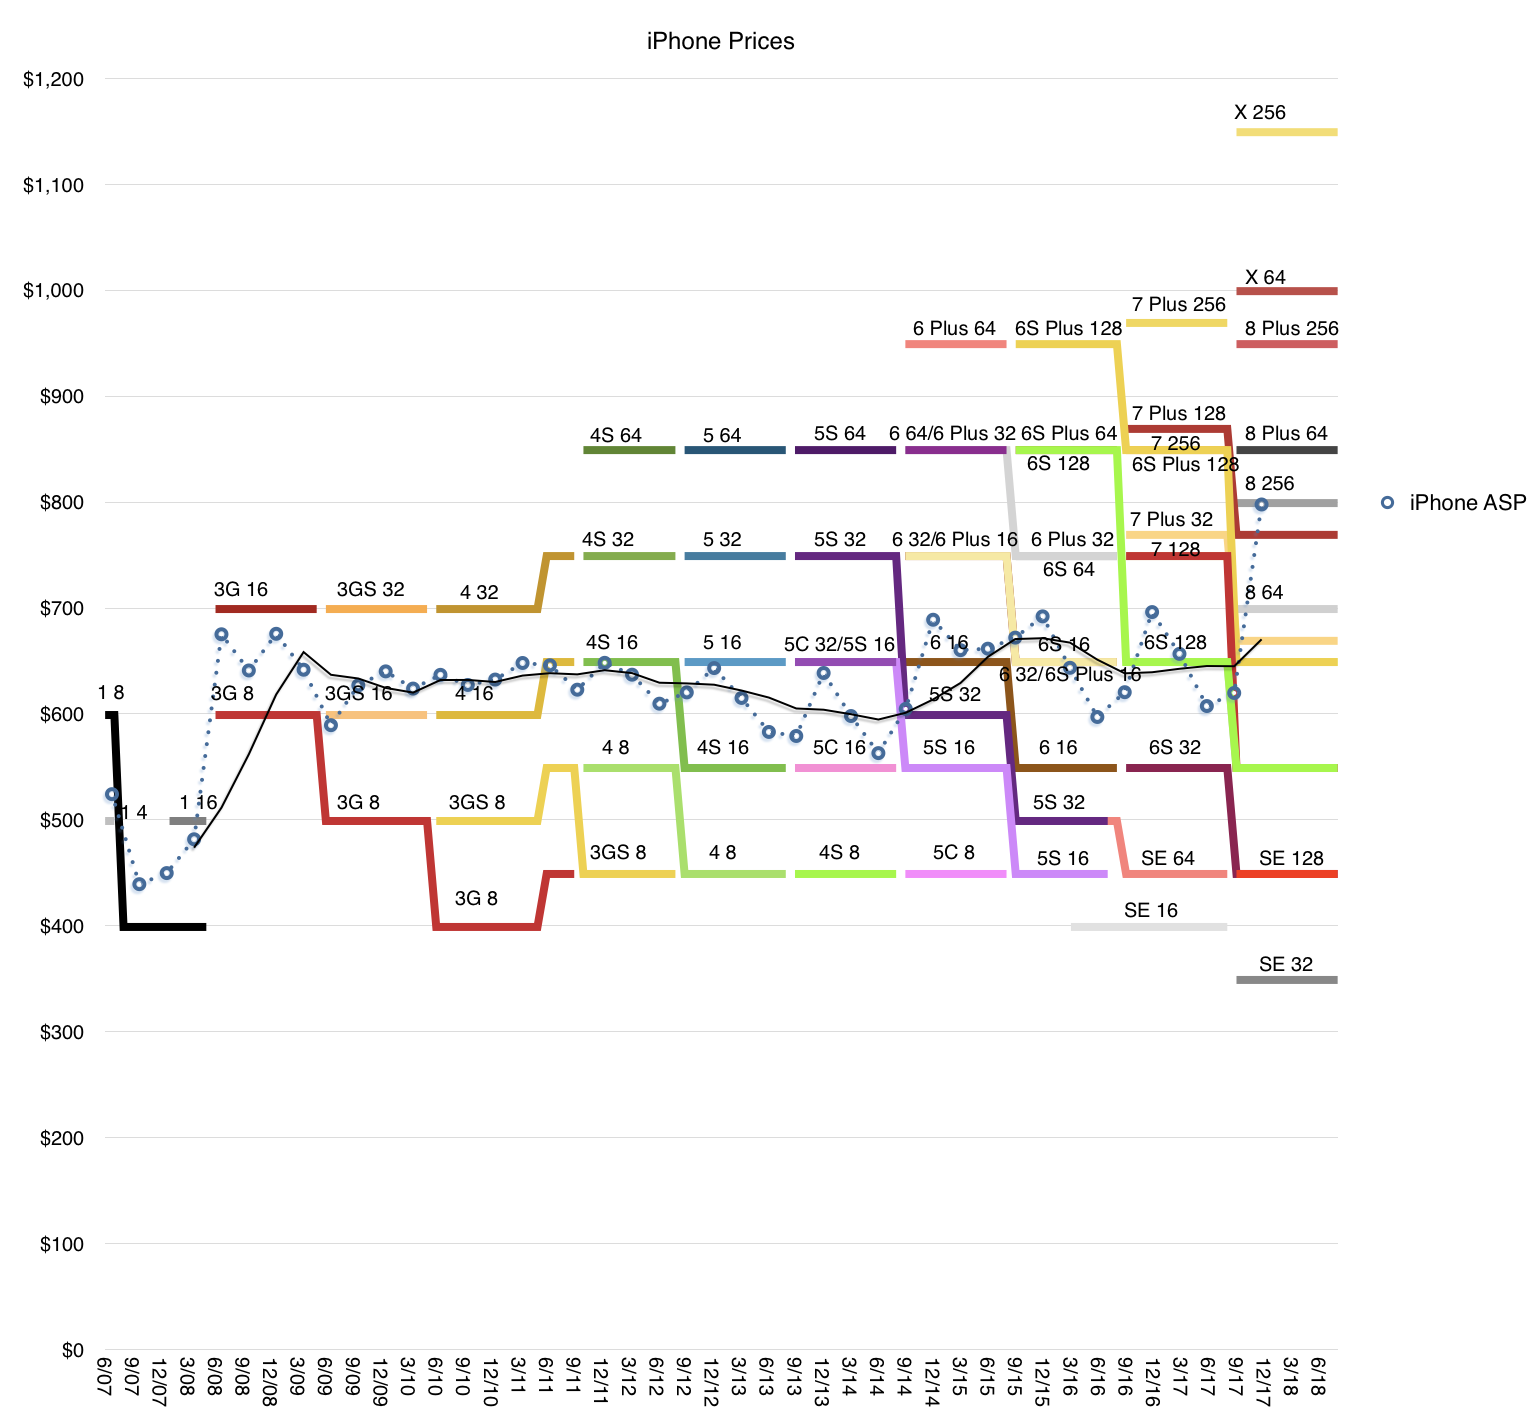
Our growth was broad-based and a key driver was iPhone, which generated its highest revenue ever. iPhone X was the best-selling smartphone in the world in the December quarter according to Canalys, and it has been our top selling phone every week since it launched. iPhone 8 and iPhone 8 Plus rounded out the top three iPhones in the quarter. In fact, revenue for our newly launched iPhones was the highest of any lineup in our history, driving total Apple revenue above our guidance range. [The iPhone X is a huge hit. It drove the average selling price $100 higher y/y. This is not only unprecedented for Apple but for the entire Industry. The average smartphone sells for less than $300 while iPhones sold for $800. The gap is widening. The following graph shows the product mix and the average resulting price.]
I want to take a moment to recognize the tremendous amount of work that went into creating iPhone 10. Our teams carried out an extremely complex launch from both an engineering and operations perspective, executing an outstanding product ramp that required years of research and development; one that introduced innovative features like an edge-to-edge Super Retina Display and the TrueDepth Camera, which enables face ID. Our customers love these new features and the new gestures like simply swiping up from the bottom, which make using iPhone even more intuitive and enjoyable.
Our team has put the technology of tomorrow in our customers’ hands today, set a standard for the next decade of smartphones and we are very proud of their achievements.
It was another very strong quarter for services with revenue of $8.5 billion, up 18% over last year, and we’re on pace to achieve our goal of doubling our 2016 services revenue by 2020. The number of paid subscriptions across our services offerings passed 240 million by the end of the December quarter, that’s an increase of 30 million in the last 90 days alone, which is the largest quarterly growth ever. [Services has been growing relentlessly for over a decade. This steadiness of growth makes is a juggernaut. Apple is increasingly speaking about subscriptions as the key metric and 240 million is reaching record territory. The rise of Services is shown below (both revenues and consumer spending.)]
We had an all-time record quarter for the App Store with our best holiday season ever. We’re seeing great excitement around augmented reality with customers now enjoying over 2,000 ARKit enabled app, spanning every category in the App Store. In December, when Pokémon GO released its new augmented reality features built with ARKit, it jumped the top of the App Store charts. Last week, on a stop in Toronto, I met developers who are hard at work on creative applications using ARKit from art appreciation to ecommerce, and I was very impressed with what I saw.
Just for months after ARKit launched to the public, we’ve already released ARKit 1.5 in beta to developers around the world, and the response has been tremendous. Augmented reality is going to revolutionize many of the experiences we have with mobile devices. And with ARKit, we’re giving developers the most advanced tools on the market to create apps for the most advanced operating system running on the most advanced hardware. This is something only Apple can do.
In addition to the App Store, several other services had their biggest quarter ever, including Apple Music, iCloud and Apple Pay, all of which saw growth in both active users and revenue.
Apple Pay has reached an important milestone in the U.S. As a result of 50% year-over-year growth in merchant adoption, it’s now accepted at more than half of all American retail locations, which includes more than two-thirds of the country’s top 100 retailers. Now available in 20 markets, global Apple Pay purchase volume more than tripled year-over-year and we’re delighted to be expanding to Brazil in the coming months. [There are no absolute data points on Apple Pay but we do have some scattered growth data. The US data is cited here but in my experience it's more popular in select countries like UK where users are using it habitually]
Today, you can use Apple Pay to take the subway in Guangzhou, China, see a concert at London’s Wembley Stadium or buy a souvenir in Yosemite National Park. In the U.S., we launched Apple Pay Cash in December, and it’s off to a terrific start. Millions of people are already using it to send and receive money with friends and family quickly, easily and securely; to split a bill, pay someone back, or send last minute gift right from the messages app.
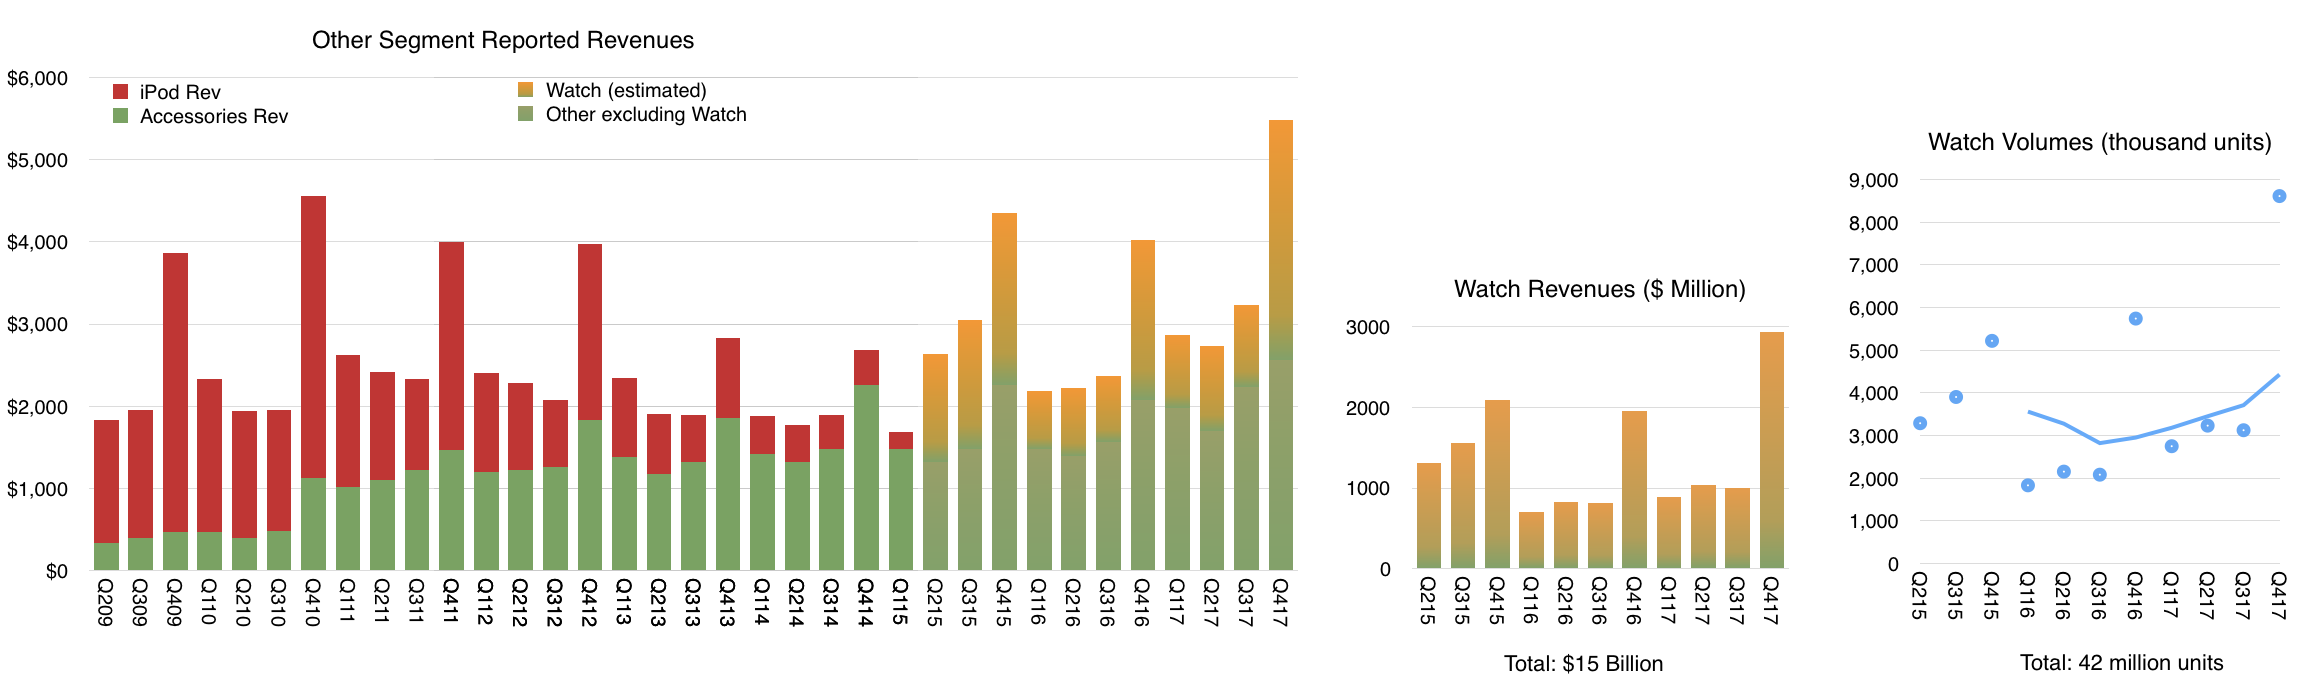
It was our best quarter ever for the Apple Watch with over 50% growth in revenue and units for the fourth quarter in a row and strong double-digit growth in every geographic segment. Sales of Apple Watch Series 3 models were also more than twice the volume of Series 2 a year ago. Apple Watch is the most popular, smart watch in the world and gained market share during the quarter based on the latest estimates from IDC. [Apple Watch is growing consistently. The following graph shows my estimates of volume (total 42 million to date) and revenues (total $15 billion) based on all available data and commentary from management.]
It was the third consecutive quarter of growth for iPad revenue, thanks to the strength of both iPad and iPad Pro. Based on the latest data from IDC, we gained share in nearly every market we track with strong outperformance in emerging markets.
Worldwide, almost half of our iPad sales were the first-time tablet buyers are those switching to Apple, and that’s true in some of our most developed markets, including Japan and France. In China, new and switching users made up over 70% of all iPad sales.
For Mac, we launched the all new, iMac Pro in mid-December. It’s an entirely new product line designed for our Pro users who love the all-in-one design of iMac and require workstation class performance. It's the fastest, most powerful Mac ever, delivering incredible computational power, for simulation and real time 3D rendering, immersive VR and complex photography audio and video projects. Worldwide, 60% of our Mac sales were the first time buyers and switchers and in China, that number was almost 90%.
We're looking forward to getting HomePod in customers’ hands beginning next week. HomePod is an innovative wireless speaker, which delivers stunning audio quality wherever its placed in the home, thanks to the advanced Apple engineered hardware and software.
Together with Apple Music, HomePod gives you instant access to one of the world's largest music catalogs. And with the intelligence of Siri, it’s a powerful assistant you control through natural voice interaction. We're very happy with the initial response from reviewers who've experienced HomePod ahead of its launch, and we think our customers are going to love this new product.
We believe one of the key issues of the 21st century is education. And because of that, we've strengthened our commitment and investment into initiatives like everyone can code. To find the innovators of the future, we need to nurture the students of today. Our App Development with Swift curriculum, which is available free on iBooks, has been downloaded more than 1.2 million times worldwide with almost half of those coming from here in the United States. It’s also being taught in dozens of community colleges across the country, putting practical skills in the hands of today’s jobs seekers.
I was in London two weeks ago as we announced that the program was expanding to more than 70 colleges and universities in Europe. Millions of students around the world will have the opportunity to add Swift to their coding vocabulary and gain skills that are essential for today’s economy.
This is an exciting time at Apple and with the best lineup of products and services we've ever had and a set of initiatives that show how business can be a force for good in the world. We could not be more excited about our future.
Now, for more details on the December quarter results, I'd like to turn over the call to Luca.
Luca Maestri: Thank you, Tim. Good afternoon, everyone. Our business and financial performance in the December quarter were exceptional, as we set new all-time records for revenue, operating income, net income and earnings per share.
Starting with revenue, we’re reporting an all-time record, $88.3 billion, up nearly $10 billion or 13% over the prior record set last year. It is our fifth consecutive quarter of accelerating revenue growth. As you know, the December quarter a year ago spanned 14-weeks compared to 13-weeks this year, which is important to consider as we have set the underlying performance of our business this year. When we look at average revenue per week, our growth rate was even higher at 21% with growth across all product categories for the third consecutive quarter.
Our results were terrific all around the world with double digit revenue growth in all our geographic segments, an all-time quarterly record in the vast majority of markets we track, including the U.S., Western Europe, Japan, Canada, Australia and Korea, as well as Mainland China, Latin America, The Middle East, Central and Eastern Europe, and India.
In Greater China, we were very happy to generate double digit revenue growth for the second quarter in a row and in emerging markets outside of Greater China, we saw 25% year-over-year growth.
Gross margin was 38.4% at the high end of our guidance range. Operating margin was 29.8% of revenue. Our net income was $20.1 billion an all-time record, and up $2.2 billion over the last year. Diluted earnings per share were $3.89 also an all-time record and cash flow from operations was very strong at $28.3 billion.
During the quarter, we sold 77.3 million iPhones, the highest number ever for a 13-week quarter. Average weekly iPhone sales were up 6% compared to December quarter last year with growth in every region of the world despite the staggered launch of iPhone 10. We established all-time iPhone revenue record in nearly every market we track with double-digit growth in all of our geographic segments. iPhone ASP increased to $796 from $695 a year ago, driven primarily by the launch of iPhone 10 and the success of iPhone 8 and 8 Plus.
We exited the December quarter towards the lower end of our target range of five to seven weeks of iPhone channel inventory with less than 1 million more iPhones in the channel compared to the December quarter a year ago, in line with our growth in average weekly unit sales. Customer interest and satisfaction with iPhone are very, very strong for both consumers and business users.
The latest data from 451 Research indicates U.S. customer satisfaction ratings of 96% or higher across iPhone models. In fact, combining iPhone 8, iPhone 8 Plus and iPhone 10, consumers reported an amazing 99% satisfaction rating. And among business customers planning to purchase smartphones in the next quarter, 77% planned to purchase iPhone. Our customers are also incredibly loyal with Kantar's latest U.S. research, reflecting a 96% iPhone loyalty rate, the highest ever measured. [Customer satisfaction is the second most important figure after active user base. Combining these two figures yields the recurring revenue value of the company. Remember what Deming said: the most important measurements for a company's value are the multipliers of a satisfied customer and a dissatisfied customer--these numbers never appear on any financial report but they are applied to all the numbers on every report].
Turning to services. We had a terrific quarter with revenue of $8.5 billion, up 18% year-over-year and up 27% in terms of average revenue per week; that is an acceleration to the 24% services growth run rate that we experienced in the September quarter.
The App Store set a new all-time revenue record. The Store’s all-new design is off to a fantastic start with quarterly store visitors, transacting accounts and paying accounts, reaching new all-time highs. During the week beginning December 24th, a record number of customers made purchases or downloaded Apps from the App Store, spending over $890 million in that seven-day period, followed by $300 million in purchases on New Year’s day alone.
And according to App Annie’s latest report, the App Store continues to be the preferred destination for customer purchases by a very wide margin, generating nearly twice the revenue of Google Play. Across all our services offerings, paid subscriptions reached $240 million with growth of 58% over last year and they were a major contributor to the overall strong growth in services revenue. [Apple has half the user base of Google Android. This is based on Google's May 2017 report of 2 billion active devices vs. the 1.3 billion that we just got from Apple. And yet these users collectively spend twice as much on apps. This ratio of "half the users, twice the spending" has been cropping up in individual developer anecdotes and can also be seen in other metrics of engagement and consumption. This should not be surprising as it conforms to the Pareto distribution of economic value.]
As Tim mentioned, it was our best quarter ever for Apple Watch. And when we add to this us from Beats and AirPods, our total revenue from wearables was up almost 70% year-over-year. In fact, wearables were the second largest contributor to revenue growth after iPhone, which is impressive for a business that started only three years ago. In total, our other products category set a new all-time record with quarterly revenue exceeding $5 billion for the first time. [Wearables now includes more than watches but watches are likely still the dominant product.]
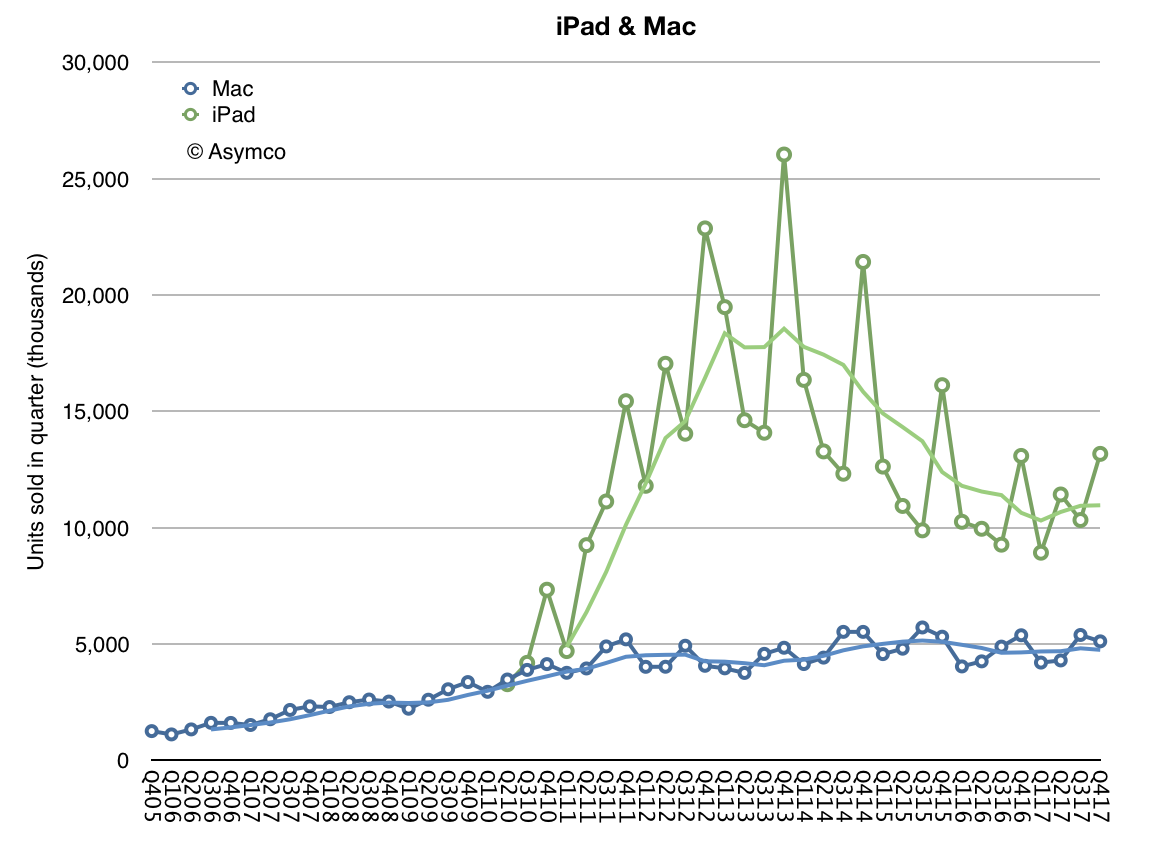
Next, I’d like to talk about the Mac. We sold 5.1 million Macs during the December quarter, which translates to a 2% year-over-year increase in average sales per week. Mac performance was particularly strong in emerging markets with unit sales up 13% year-over-year and with all-time records in Latin America, in India, Turkey and Central and Eastern Europe. On a worldwide basis, the active install base of Macs was up double-digits year-over-year to a new record.
It was also another growth quarter for iPad. We sold 13.2 million units with average iPad sales per week up 8% over last year’s December quarter. iPad sales grew strong double-digits in many emerging markets, including Latin America, the Middle East, Central and Eastern Europe and India, as well as developed markets, including Japan, Australia and Korea. The active install base of iPad has grown every quarter since its launch in 2010, and it reached a new all-time high in December, thanks to extremely high customer loyalty and large numbers of first-time iPad users. [iPad is clearly recovering from a long decline. ASPs are rising as it's being positioned as a PC alternative. Its low end functions are being absorbed by large screen iPhones.]
NPD indicates that iPad had 46% share of the U.S. tablet market in the December quarter, up from 36% share a year ago. And the most recent surveys from 451 Research found that among customers planning to purchase tablets within 90 days, 72% of consumers and 68% of business users planned to purchase iPads. Customer satisfaction is also very high with businesses reporting a 99% satisfaction rating for iPad.
We are seeing great traction in enterprise as businesses across industries and around the world standardize on iOS. For example, Intesa Sanpaolo, one of Europe’s leading banks, has chosen iOS as the mobile standard for its entire 70,000 employee base in Italy; choosing iOS for its security, user interface, accessibility and reliability, Intesa Sanpaolo will deploy native apps to improve employee productivity in customer support, human resources, and marketing across the company.
And LensCrafters, one of the largest optical retail brands in North America, will be using over 7,000 iPad Pros to enable digital eye exams and digital optical measurements in a personalized and interactive experience. We’re also rolling out a new initiative, called Apple AtWork to help businesses implement employee choice programs more easily and offer Apple products company-wide.
Resources from both Apple and our channel partners will enable enterprise IT and procurement teams to buy or lease Apple products more efficiently, streamline the setup of iPhone, iPad, and Mac, and deliver a seamless onboarding experience for employees. We launched the program with CDW in the U.S. last week, and we would be expanding to more channels and regions later this year.
The December quarter was extremely busy for our retail and online stores, which welcomed 538 million visitors. Traffic was particularly strong during the four-weeks following the launch of iPhone 10, up 46% over last year. And across the quarter, our stores conducted over 200,000 today at Apple sessions, covering topics including photography, music, gaming, and app development, and art and design. Just last weekend, we opened our first store in Seoul, Korea and we’re looking forward to opening our first store in Austria in a few weeks. These newest openings will mark the expansion of our retail store presence to 21 countries.
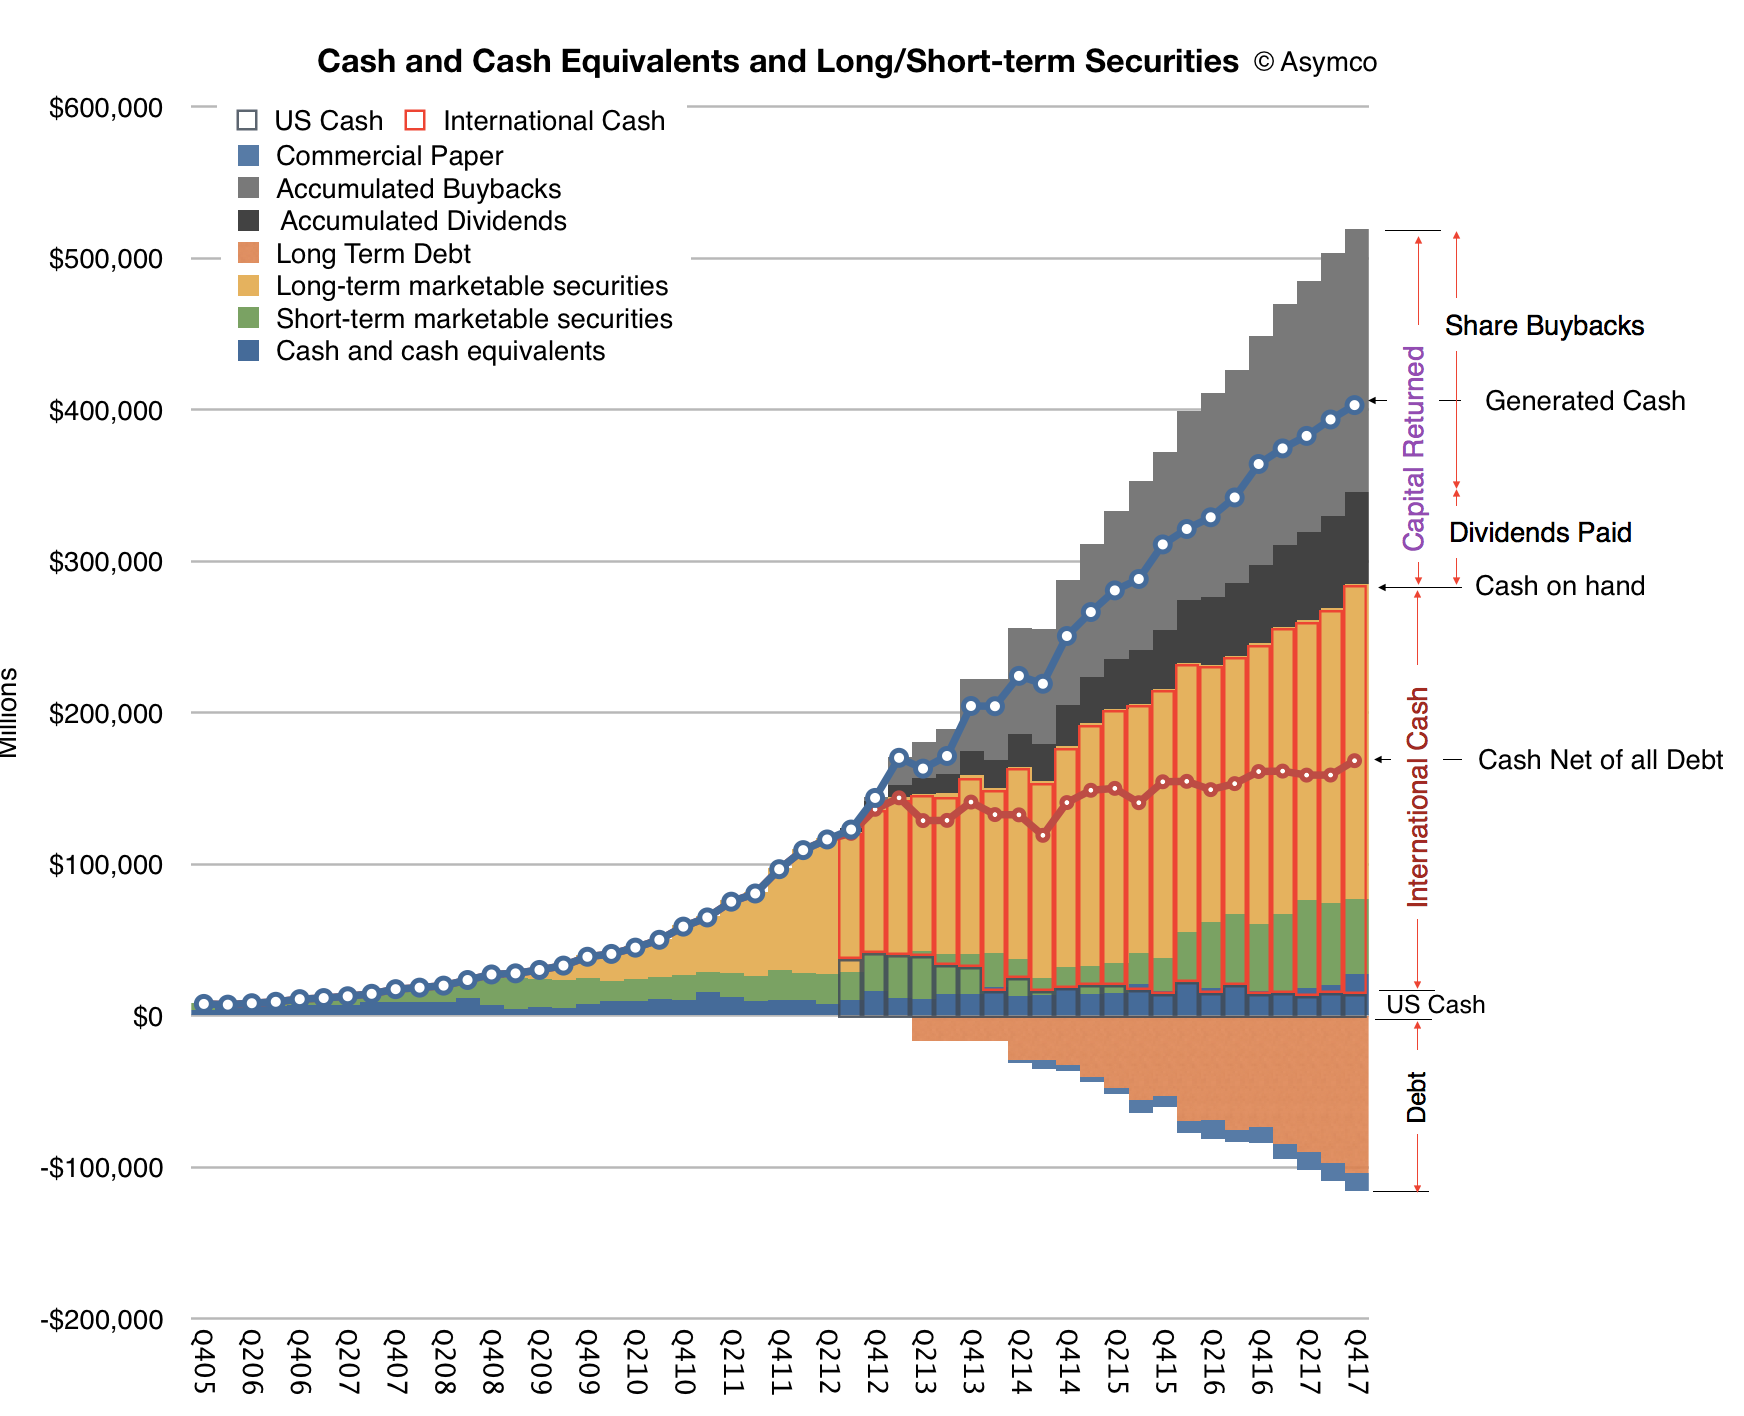
Let me now turn to our cash position. We ended the quarter with $285.1 billion in cash plus marketable securities, a sequential increase of $16.2 billion. $269 billion of this cash, or 94% of the total, was outside the United States. We issued $7 billion in debt during the quarter, bringing us to $110 billion in term-debt and $12 billion in commercial paper outstanding, for a total net cash position of $163 billion at the end of the quarter. We also returned $14.5 billion to investors during the quarter. We paid $3.3 billion in dividends and equivalents, and spent $5.1 billion on repurchases of 30.2 million Apple shares through open market transactions.
We launched a new $5 billion ASR program, resulting in initial delivery and retirement of 23.6 million shares and we retired 3.8 million shares upon the completion of our 12th ASR during the quarter. We’ve now completed over $248 billion of our $300 billion capital return program, including $176 billion in share repurchases against our announced $210 billion buyback program with $34 billion remaining under our current authorization. [An updated look at Apple's cash is shown below]
Turning to taxes. Due to the recently enacted legislation in the U.S., we estimate making a corporate income tax payment of approximately $38 billion to the U.S. government on our cumulative past foreign earnings. This amount is very similar to what we had been accruing on those earnings in our financial results through fiscal year 2017, including the $38 billion payment. We will have paid over $110 billion of corporate income tax on our total domestic and foreign earnings during the last 10 years for a cash tax rate of about 26%. [Apple has paid more tax than any company in history, and is about the make the largest single payment to the US Treasury.]
Our tax rate of 25.8% for the December quarter was close to our guidance of 25.5% as the lower U.S. statutory rate from the new legislation was effective offset by the remeasurement of deferred tax balances.
As we move ahead into the March quarter, I'd like to review our outlook, which includes the types of forward looking information that Nancy referred to at the beginning of the call; we expect revenue to be between $60 billion and $62 billion; we expect gross margin to be between 38% and 38.5%; we expect OpEx to be between $7.6 billion and $7.7 billion; we expect OI&E to be about $300 million; and we expect the tax rate to be about 15%.
Tax reform will allow us to pursue a more optimal capital structure for our company. Our current net cash position is $163 billion. And given the increased financial and operational flexibility from the access to our foreign cash, we are targeting to become approximately net cash neutral overtime. We will provide an update to our specific capital allocation plans when we report results for our second fiscal quarter, consistent with the timing of updates that we have provided in the past.
Finally, today our Board of Directors has declared a cash dividend of $0.63 per share of common stock, payable on February 15, 2018, to shareholders of record as of February 12, 2018.
Microsoft has announced that by the end of the year the Groove music service will be phased out. Users are being offered the option to move their music libraries into Spotify.
This brings to an end a long story of Microsoft in the music distribution business. It started nearly 15 years ago with technologies in Windows that allowed for purchase and playback of various media formats. Microsoft sought to enable a large number of music retailers to market music through its formats and DRM and transaction clearing.
Services such as AOL MusicNow, Yahoo! Music Unlimited, Spiralfrog, MTV URGE, MSN Music, Musicmatch Jukebox, Wal-Mart Music Downloads, Ruckus, PassAlong, Rhapsody, iMesh and BearShare and dozens of hardware players licensed Windows formats. Almost all of these services have shut down and the devices disappeared.
The next stage was to offer an integrated experience through the Microsoft Zune player and Zune Marketplace music service. This too failed and was replaced by the Xbox Music brand in 2012. On July 6, 2015, Microsoft announced the re-branding of Xbox Music as Groove to tie in with the release of Windows 10.
There was a time when Microsoft was thought of as the certain winner in media distribution. Inserting media into the Windows hegemony was classic "control point" strategy: owning the access points was a sure way to collect a tax on what transacted through the network.
Instead we are facing a market where media is consumed through new access points: phones, tablets and TV boxes. Netflix, Spotify, Roku, Google, Amazon and Apple are all offering distribution and some are investing in original programming.
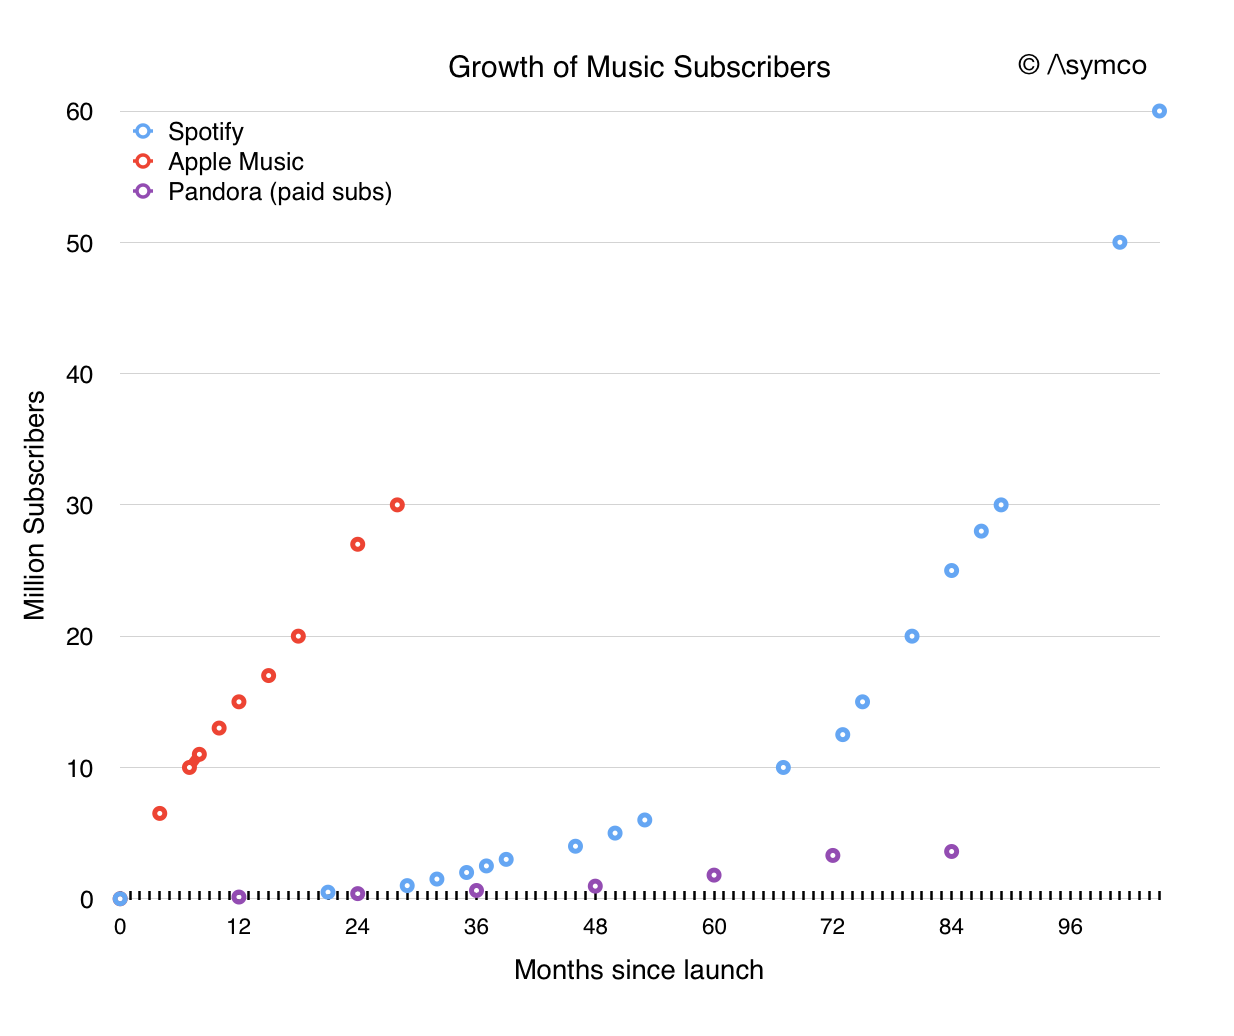
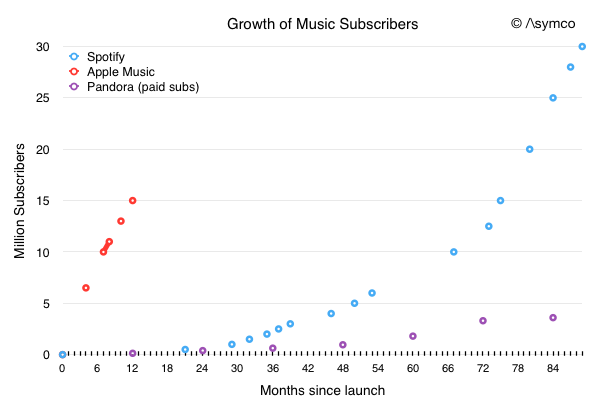
It's perhaps worthwhile to recall that Microsoft and Apple both started their media efforts around the same time. Apple's iTunes is 16 years old and the iTunes Music Store opened in 2003, almost 15 years ago. Today Apple is transitioning to streaming with 30 million subscribers. The graph below shows the history of subscription growth to Apple Music and Spotify.
Apple Music is a small part of Apple Services (part of the orange area below).
On a yearly basis Apple Services are this year crossing the $50 billion gross revenue run rate. This year Apple released a new Apple TV 4K and is releasing a new smart speaker called HomePod.
The contrast between Microsoft and Apple is most visibly between the Mac and PC. But the story of how media paralleled mobility and how Microsoft struggled with both is perhaps a cautionary tale.
Microsoft saw the limits of modularity when new product categories emerged and when new user behaviors were created. They attempted to pivot into being more integrated but those efforts also failed. The efforts continue today with Surface devices; looking forward they will continue with AR/VR and perhaps a pivot of Xbox..
But the long arc of history shows how hard it is to succeed in vertical integration after you build on horizontal foundations. Generations of managers graduated from the modular school of thought, specializing rather than generalizing. Now they are facing an integrated experiential world where progress depends on wrapping the mind around very broad systems problems.
Entire industries are facing this orthogonal pivot: media, computing and transportation come to mind. Huge blind spots exist as we see only what we've been trained to see.
When Spotify and Pandora were starting their streaming services many were quick to point out that Apple was about to be disrupted. The future, they said, was streaming because (young) people could not be bothered with ownership of music and the limitations of a personal collection. Who would want to pay for a few hundred songs when they could listen to millions for free?
This perception continued and became more vocal over the years. Seven years in fact. Spotify collected 20 million paying subscribers while Apple did nothing. Pandora grabbed 80 million active listeners and possibly 4 million paying subscribers while Apple did nothing. The boat had sailed and Apple was not only not on it but oblivious that there was a boat in the first place.
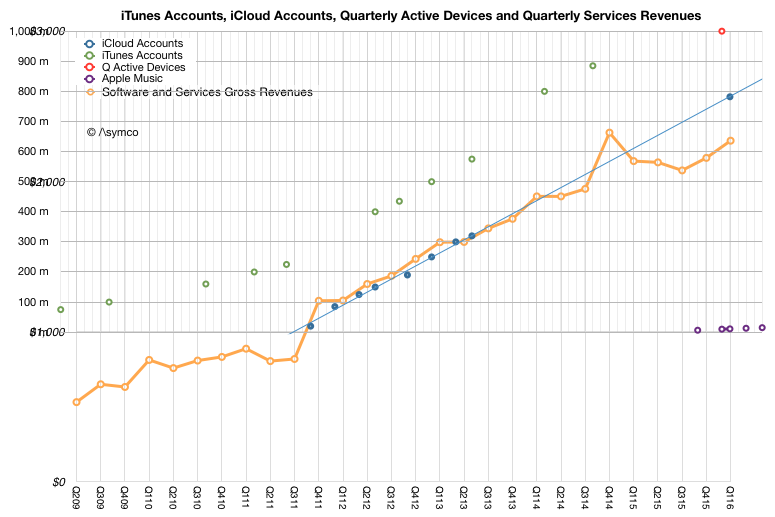
At first Apple launched a half-hearted streaming service and then a paid service finally showed up with Apple Music in mid 2015. Since then the company managed to add 15 million subscribers. A tiny number compared to the 900 million iTunes accounts it had reported a year earlier. Pathetic. The number of music subscriptions relative to iCloud accounts, iTunes accounts and active devices is shown the the graph below.
It may be paltry compared to the count of users Apple may have in total, but how does a 15 million user base in 1 year compare with the growth rate for the incumbents Spotify and Pandora?
The following graph shows the ramps for Spotify, Pandora and Apple Music since their moments of market entry. The accumulation of users by Apple looks to be the fastest yet.
This is, of course, due to a maturing use case. Apple did not have to educate people to the notion of music as a subscription. It could just announce it and users would discover it and just sign up, especially if they were already iCloud subscribers and had a credit card attached to their iTunes account.
But that's the whole point. Apple did not have to move first in music subscriptions. It did not even have to move second or third. When it did move it could just skim the market and add to its already healthy Services revenue (orange line in the first graph above.) Missing the boat in music in this case meant capturing all the value quickly and with minimal expense.
Fundamentally, Apple's entry into music subscriptions was a sustaining effort. Streaming sustained Apple rather than disrupting it. The difference may seem merely one of semantics, but it is also the difference between life and death for a challenger. Meaning matters.
This is a cautionary tale for those who would pronounce every new idea as "disruptive" to Apple or anyone else on the basis of novelty alone. The tests for disruptiveness are easy enough and it behooves the analyst to apply them before dropping the d-bomb.
Eddy Cue seems like a nice guy. I can't say that for sure as I've never met him, but he seems to be amiable enough. Maybe it's because he has a seat on Ferrari's board of directors. Maybe it's because he enjoys dancing.
Or maybe it's because he's in charge of the only real "division" at Apple. All the other senior managers have functional roles. Eddy has a bona-fide business unit called Services.
Services is Apple's division of many things. It has the iTunes stores (Music, Video, Apps and iBooks). It has Software with consumer bundles like iWork and iLife and Pro tools like Aperture, Final Cut Pro and Logic Pro. It still has OS X as a product, though revenues are pretty low as updates are now free. It also includes Services with iCloud, Apple Music and Applecare.
These things are not iPhones or iPads but they are many and all together they form a modest little unit. I say modest because not much is said about it. When seen in contrast to the other Apple product lines, it's hard to be impressed. In the graph below it's the purple area.
Apple does not help much. Occasionally Apple offers updates on iTunes/Services using various (rarely the same) metrics. For example, in early August, Eddy Cue offered an update during an interview with USA Today on Apple Music relating how many users there were one month after the service started (11 million). It was worth a few headlines.
However he also noted in passing that the App store did $1.7 billion in transactions during July. If you convert that to a yearly run-rate it comes out to about $20 billion/yr. Digging through previous announcements, the equivalent figure for 2014 was about $13.7 billion. Nice growth.
But is $20 billion of "transactions" of any significance? It's not even a figure that Apple reports as revenue. For apps, Apple reports only the 30% fee as revenues so 70% of that transaction value passes through to developers and is therefore not part of its statement of accounts. ((From SEC filings: For third-party applications sold through the App Store and Mac App Store and certain digital content sold through the iTunes Store, the Company does not determine the selling price of the products and is not the primary obligor to the customer. Therefore, the Company accounts for such sales on a net basis by recognizing in net sales only the commission it retains from each sale. The portion of the gross amount billed to customers that is remitted by the Company to third-party app developers and certain digital content owners is not reflected in the Company’s Consolidated Statements of Operations.))
However perhaps we should consider the figure in some way. It represents transactions in an economic sense--the amount people spend on apps. It's therefore comparable with what people spend on other forms of entertainment. Movies for example.
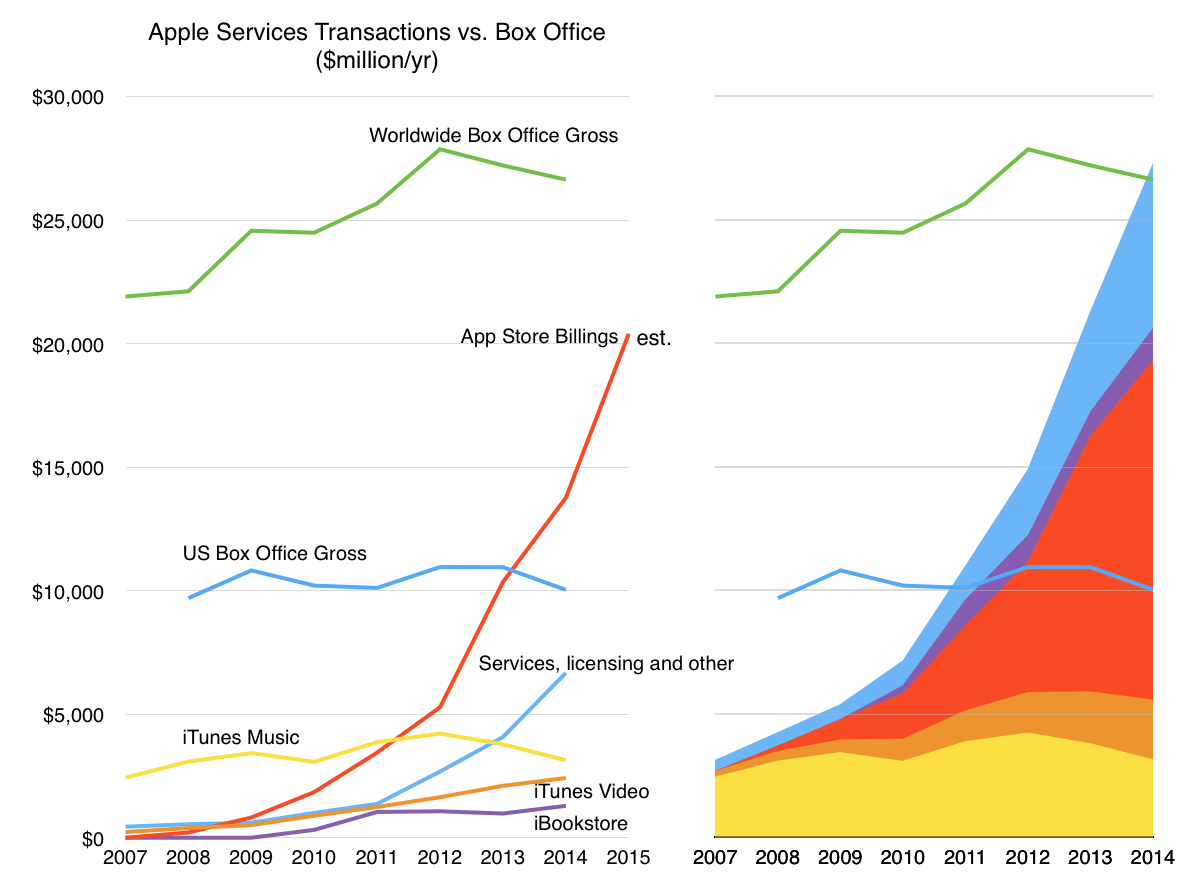
The following graph shows the spending on apps within the iTunes App Store ((note that this does not include Google's Play Store whose transaction values are not public and is therefore not a gauge of all apps.)) as well as spending on other forms of iTunes stores as well as Services. It also shows how all the services compare with box office revenues from movies. Both the US and World-wide. And how these figures changed over the few years that the App Store has been in existence. The individual service line items are shown in the graph on the left and the stacked totals are on the right.
Note that already last year App Store Billings overtook US Box Office gross revenues and that Services a whole overtook Global Box Office gross revenues. It's not likely to happen this year but next year Apple's Apps will almost certainly overtake global Box Office in revenues.
This contrast with movies gives some perspective on the creation of a new market. Apps did not exist as a medium in 2007. But, together with Android apps, apps are likely to have already overtaken revenues from an industry that is a century old. And not just any industry. Hollywood represents more than an economic power, it has a cultural power affecting perceptions and political opinion. And although universally envied, it has not been successfully replicated.
So having created this market and becoming bigger than Hollywood, and grossing more than what 90 countries produce, Apple's Services not something that is interesting to many who think about technology or even to many who think about Apple.
Which is why I think Eddy's such a nice guy. No matter how little attention is paid to his economic empire, he always seems to be in a good mood. Maybe he knows something we don't.