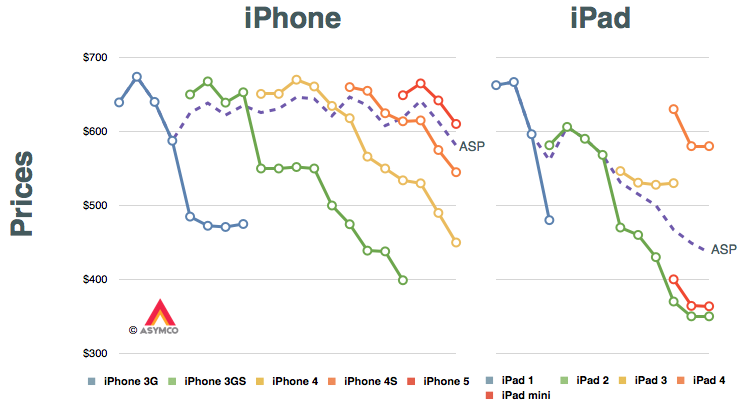
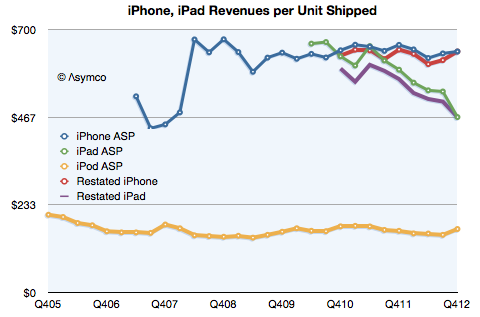
The answer may lie in the way the iPad mini has been marketed. The pattern for iPhone pricing is pretty regular but that for the iPad shows a marked difference. The reason is, of course, that the iPad has already gone through a portfolio broadening. The following graphs tell the story.
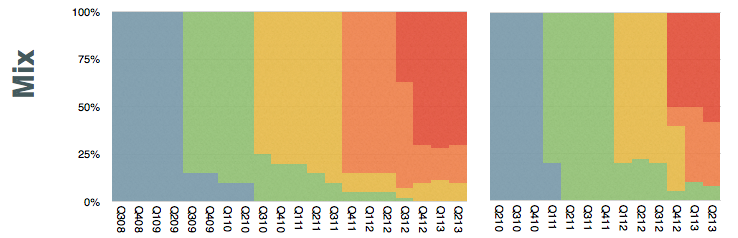
The only data in these graphs that is provided by Apple are the dashed purple lines. They represent the average selling prices (ASP[*]) for the two product lines. I added assumptions about product mix (shown in the lower set of graphs) and thus generated prices for each product variant at a given point in time shown as line graphs.
If you look at the iPad, ignoring the legacy iPad 2 (which I presume sells mostly to educational institutions) the replacement of the iPad 3 was with a "bracketed" portfolio of the higher-priced iPad 4 and the lower-priced iPad mini. Note also that the mini reflects similar pricing to the legacy iPad 2.
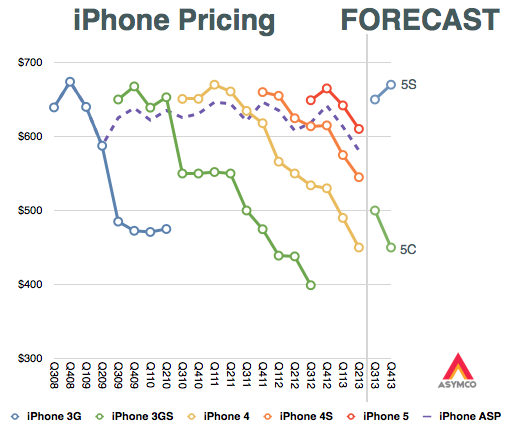
My second assumption is therefore that the 5S and 5C will form a similar bracket as the new iPads did. I also assume that the iPhones 4 and 4S will be retired. This means that the 5C will take up the trajectory of the 4S while the 5S will take up the upper bracket around $650.
The average pricing for the entire portfolio will depend on the mix. This is still highly speculative since we can't predict how the end-user (operator) pricing will be set for the 5C. Aggressive promotion and new market growth might skew the 5C considerably. On the other hand, upgrade promotions might move the 5S in existing markets.
---
Notes:
These prices reflect blended average prices of all SKUs to the channel and do not necessarily reflect prices offered to end-users.
Using interactive graphics and narration, this latest Apple Earnings Review discusses Apple's performance in relation of its historic performance as well as to expectations (published in the Preview) on the following topics:
Guidance vs Actual performance: Now that Apple changed the way it provides guidance, are we seeing a new degree of precision in their signaling. We look at the history of earnings guidance and how effective (or not) the current method is in helping predict performance.
Gross and Operating Margins analysis: What is the pattern of margins and how important are margins to the perception of competitiveness?
Margins by product. How are margins allocated by product?
Average selling prices for each product. Any surprises in Pricing? What was the magnitude, cause and significance of iPhone ASP drop.
iOS product shipments. Comparison with expectations, trends and explanations. Overall iOS growth story.
Cash balance and the effect on cash of share re-purchase.
Sales growth and Earnings growth, a long term retrospective.
Duration is about 1hr.
As a reminder, the Padcast can be reviewed interactively users can access to the underlying data.
It's available for download on the iPad for $19.99. Those who already bought the Preview will be receiving an updated version soon that includes the Review at no extra charge.
In June of 2011 Apple announced that 130 million ebooks were sold through iTunes. In October of 2012 it announced that 400 million sold.
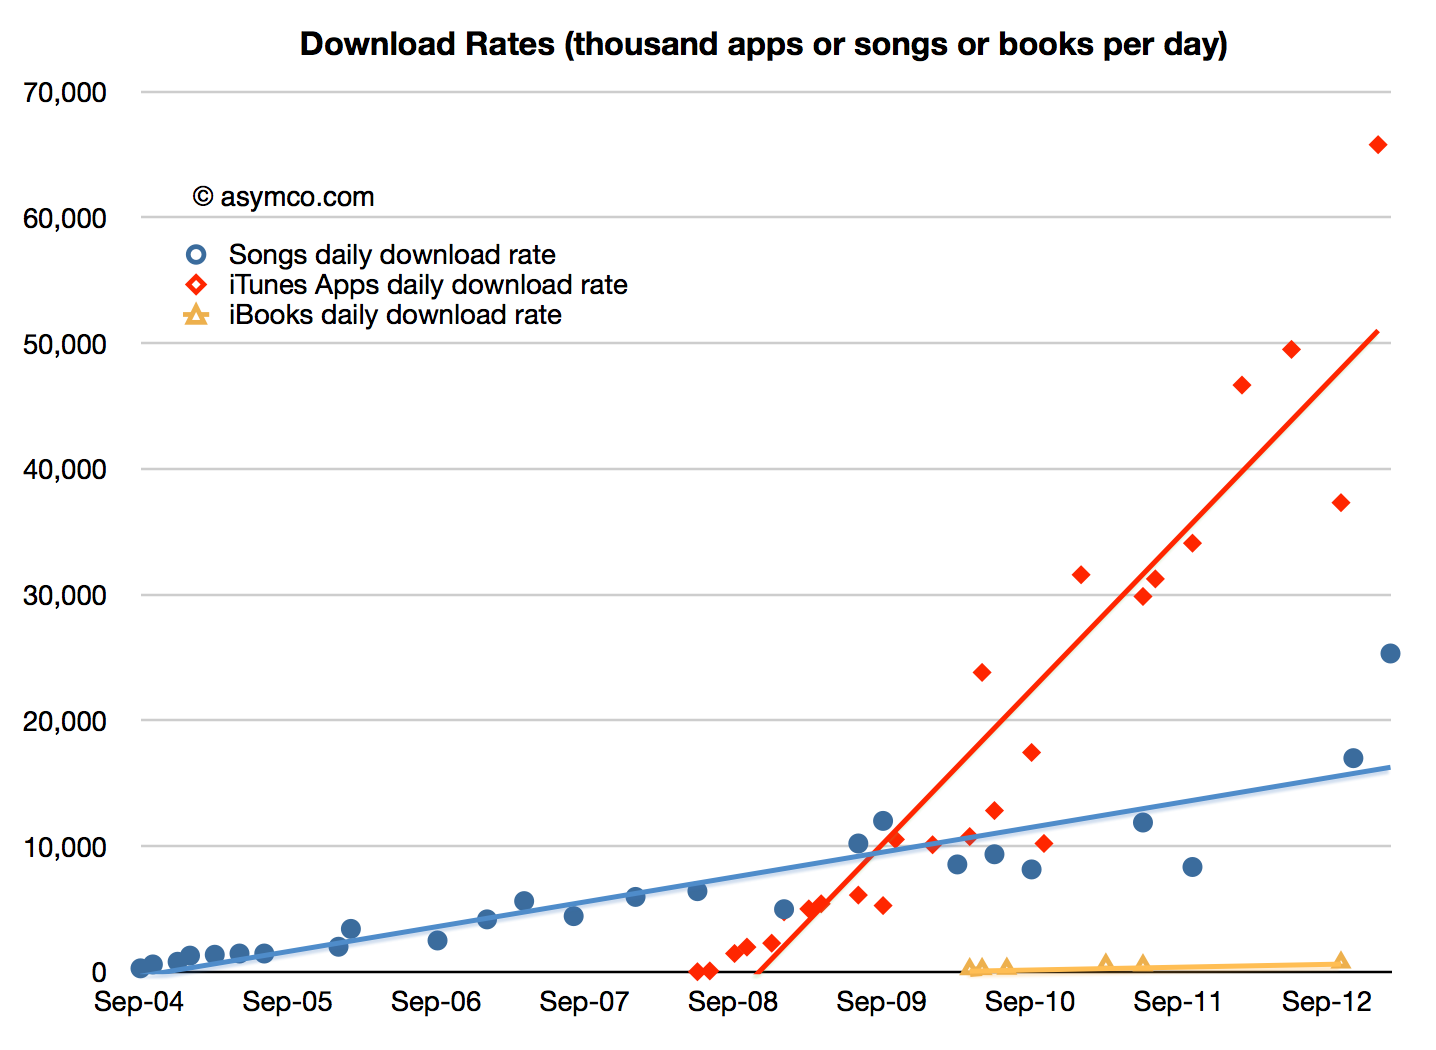
That means 270 million ebooks were sold in 16 months. Or about 17 million units per month, on average. It also suggests 2012 ebook sales of about 200 million units.[1] The following graph shows the download rate of books relative to apps and songs:
The download rate looks paltry but we need to remember that Apps have a very low average selling price (about 23 cents including in-app purchases) and that Songs are probably priced around $1.1 on average. In contrast each ebook could be generating about $10 per download.
However that may be a bit high. We don't know the mix of lower priced and higher priced books. Many best sellers are $13 or $14 but there might be some free books in the mix as well.
If I choose a more conservative $9 average selling price and assuming a 70% share for the publisher then Apple's iBooks generated about $1.3 billion in payments and grossed about $1.8 billion.
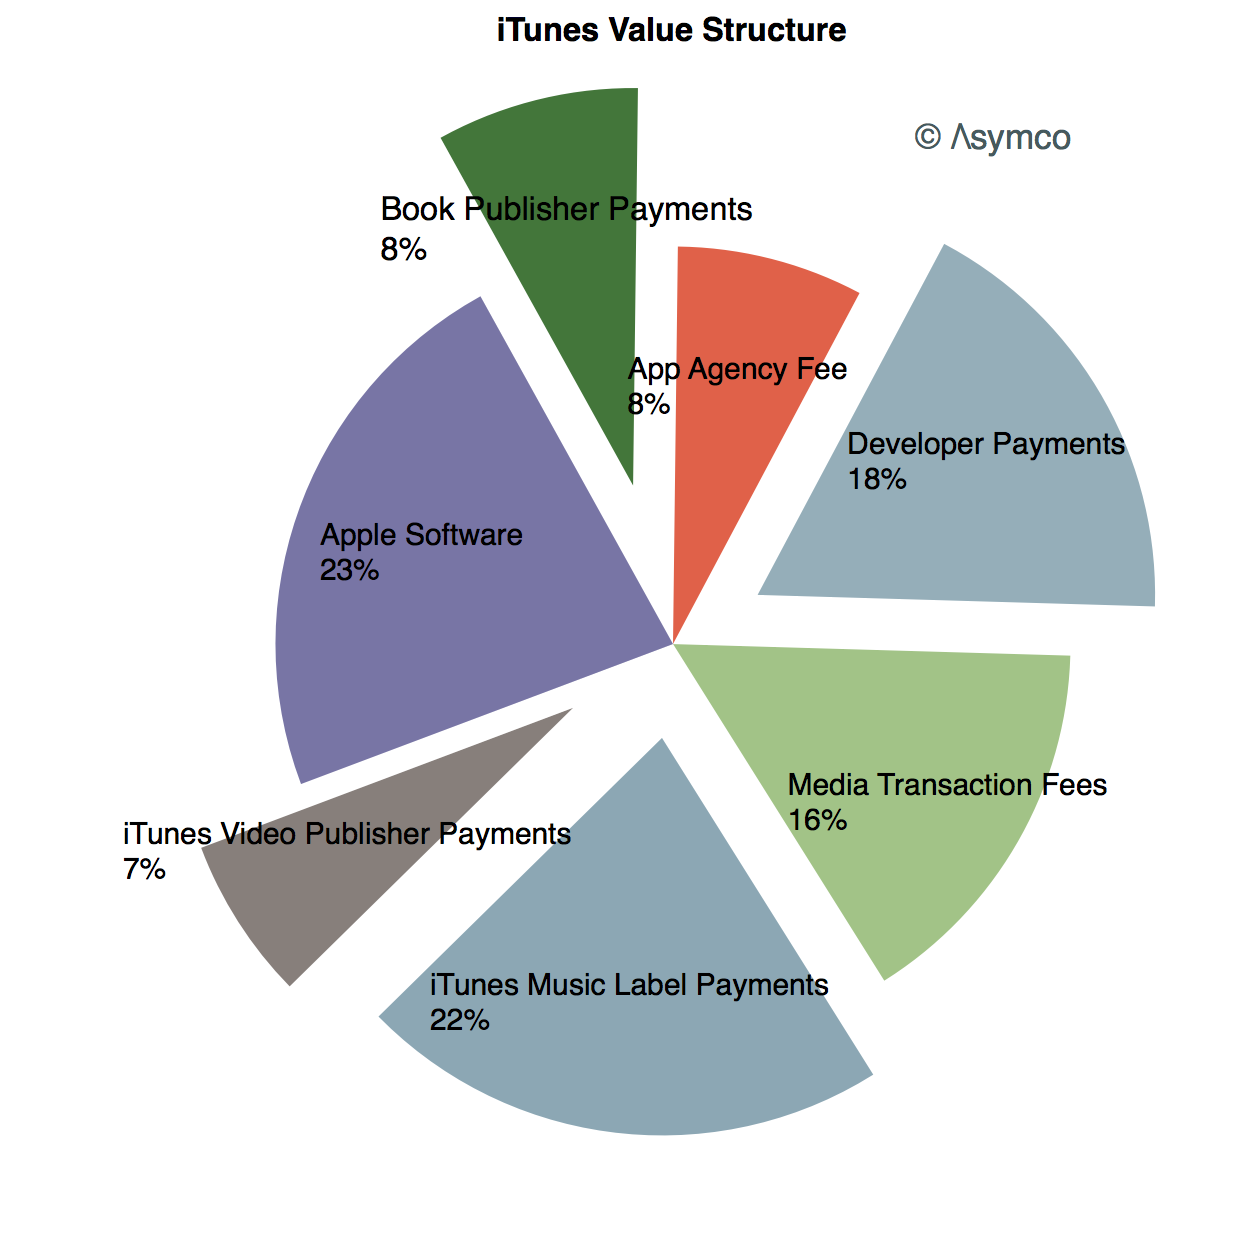
In the past few posts I measured the iTunes App ecosystem and the Music economy. With the iBook market now measured we can derive the size of the only remaining media type: video.
---
Notes:
I've seen one estimate that world-wide ebook unit sales reached 860 million implying Apple's share was about 24%.
In the latest quarterly report Apple changed how it reports product revenues. In previous quarters the iPhone and iPad were reported including accessory revenues while iPod accessories were reported under "Music" revenues.
"Under this new format revenue from iPhone, iPad, Mac and iPod sales is presented exclusive of related service and accessory revenue […] revenue from all Apple and third party accessory sales is presented as a single line item [Accessories.]"
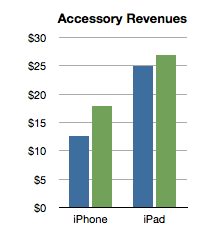
Apple provided a document showing re-classified product summary data. By measuring the difference between original revenue and re-stated revenue per product we can determine how much service and accessory revenue was being attached to each product.
I did this for two quarters as a sample:
The analysis shows that the iPhone has been receiving about $15 of accessory attached value and the iPad about $25. Interesting trivia, but how is this insightful?
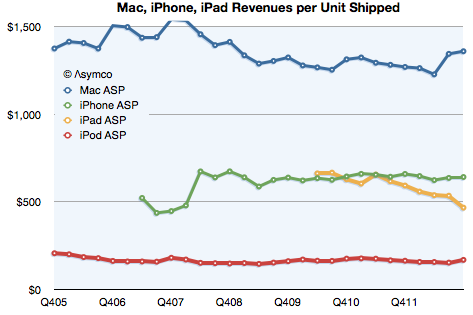
Consider the impact on this analysis of revenues/unit shipped:
The iPhone obtained about $642 revenue/unit (shown above as the last datum in the green line). That compares slightly lower with last year's $659/unit. However, the latest quarter is on the new basis and the data in the chart above shows old basis.
Here is the data with re-stated iPad and iPhone ASP:
On a re-stated basis, without the extra revenue from accessories, the iPhone "ASP" (Average Selling Price) from a year ago becomes $646 (which, again, is not what is reflected in the graph). This is almost exactly the same as the current quarter. The iPhone "ASP erosion" therefore goes from 2.6% to only 0.7%.
Similarly, the iPad shown at $467 in the latest quarter does not drop from $593 last year but from $568. Its ASP erosion becomes 18% rather than 21%.
Interesting resilience with the iPhone and slightly better support for the iPad price. What does it mean?
Pricing power is the most important indicator of differentiation and it implies an ability to create value in excess of cost. Not only that but it also indicates whether a product is being "commoditized" by over-serving the market and being substituted by lower priced alternatives.
In the case of the iPhone the tenacious retention of its ASP indicates that the point of over-service has not been reached. Buyers are not yet switching in significant numbers to the older, cheaper variants available from Apple. If they were we would see evidence in the price first due to the change in mix.
Contrast that with the iPad where there is a far more marked erosion. That's due to the introduction of the mini which is good enough to substitute for the larger version for many of the jobs it's hired to do. We can safely argue that the iPad is good enough in smaller form factors and addressing larger markets.
But why isn't this happening to the iPhone? Why isn't the iPhone n-1 "good enough"? Surely consumers can do almost the same tasks with an iPhone 4S as they can with the 5. Why are they still buying the new phone?
The clue comes from the fact that the consumer is not the only buyer. It's operators who buy and re-price the product. They are hiring the product to sell broadband and the newest variant is still the best hire to do that job. This observation is crucial to understanding the growth dynamics of the iPhone and consequently, of Apple itself.
I repeat what I've mentioned before: The iPhone is primarily hired as a premium network service salesman. It receives a "commission" for selling a premium service in the form of a premium price. Because it's so good at it, the premium is quite high. Also because it's so good, it gets bought in large batches which allow Apple to schedule production efficiently.
This understanding gives us a solid basis from which to evaluate its growth potential.
The most remarkable thing about the iPhone as a technology product is that it has been able to maintain pricing stability for over five years. As the following chart shows, the revenues per unit sold for the iPhone (as reported by the company) have held even as volumes grew exponentially.
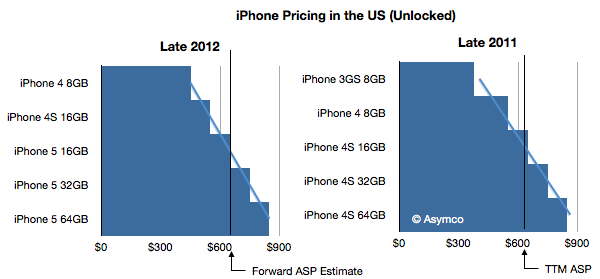
The latest version of the product should see no significant change in this pattern. I show below the price spectrum of the iPhone as available unlocked in the US (therefore assuming no sales taxes or VAT and no subsidy). I also highlighted the average revenue per unit from the latest four quarters.
The only difference between 2011 and 2012 is that the lowest priced variant is now $450 vs. $375 a year ago.
Without knowing the split between products, it's hard to tell how much impact this price increase will have. Note that the average price was very nearly the same as the 16GB variant ($643 ASP vs. $649 16G pricing). Assuming equal volumes for each variant, the average pricing for 2011 would have been $634. Therefore the actual ASP was only $9 higher than average pricing.
If we assume the same for this year (equal split between variants + $10) then the average price could rise to about $660. That would be a slight increase but it would be multiplied by many more phones sold.
In fact, going from $634 to $649 and selling 200 million units would imply an additional $3.4 billion in revenue.
Because that is an estimate. Of the 104 million Android phones shipped in the quarter (itself an estimate from another, possibly different methodology), I could only account for 7 million actually reported. That figure comes from a close reading of an investor presentation from Sony. HTC does not report their shipment numbers. It stopped some time late last year. Neither does Motorola now that it's a part of Google. Huawei is silent except for setting targets and ZTE published a press release citing IDC's estimate of its own shipments.
But most glaring of all is the absence of any mention by Samsung of its performance. The company stopped reporting any data on either overall phone shipments or of smartphones within that total since Q3 2011. We may have been able to estimate Samsung if we had more competitor actuals, allowing us to back into a figure. But we don't.[1]
Which leaves us with IDC's estimate[2]. But the problem is that since the industry is growing so quickly it is very sensitive to assumptions. Consider how difficult it is for consensus estimates for Apple's iPhone shipments to come near the actuals--and that's for one quarter, and knowing all the previous quarters with precision. The absence of visibility into the assumptions made by market analysts (or their methods) should lower confidence in the results.
Consider that IDC specifies 50.2 million Samsung smartphones, implying an accuracy down to 100,000 units. Is this accuracy believable?
There is reason for doubt.
I start with the following graph:
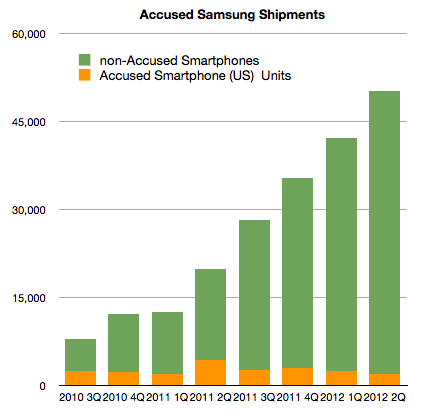
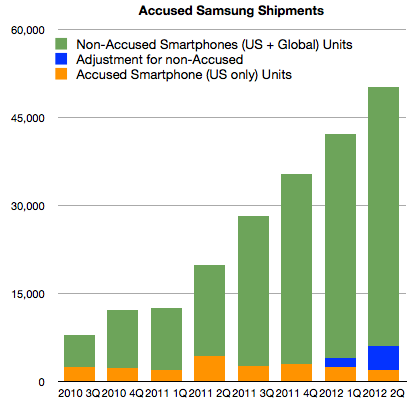
It shows the estimates for Samsung global shipments (latter four quarters are estimates without the benefit of company reports.) I separated the component of shipments that Samsung reported as part of its submission to the Samsung v. Apple trial in California. Note that this (orange) segment consists of most US smartphone shipments. It's not all US Samsung shipments. It notably excludes the Note, the latest Nexus and the Galaxy SIII.
Without these "non-accused" phones, it would appear that Samsung's US volumes dropped to 4% of global totals from a 10% average[3]. In order to return to 10%, the US totals would need to be adjusted as shown below:
I added 1.5 million units in Q1 and 4 million units in Q2 (to account for Galaxy SIII).
So far this seems consistent with the total estimated global shipments of 50.2 million from IDC. US units would result in 12% of global shipments.
However, there is more data we can test against. First, we are also given pricing for the US phone portfolio, or at least we have revenue per unit sold. This allows us to get an idea of what revenues can be obtained for the smartphones in the US, and possibly world-wide[4]. Knowing prices for smartphones and knowing global sales (which Samsung reports) and finally knowing global total phone shipments allows us to price the average non-smart phone.
Excluding the non-accused smartphones, the average revenue per smartphone in the US for Samsung in Q2 was $339. Adding in the estimated Galaxy SIII (4 million) at an average price of $470 gives a new "ASP" of $413.
This is where the analysis goes off the rails.
If we assume the global ASP is equal to the US ASP and knowing everything else about the mix of smartphones (54% of total) and revenues (as reported) yields a negative ASP for feature phones. Assuming the revenue figure is correct, either the number of smartphones is wrong (50.2 million) or the global ASP ($413) is wrong. The total phone number is also an analyst estimate which can be called into question.
There are many assumptions being multiplied here so I have very low confidence in the result, but we should ask "what do you need to believe" in order for the 50.2 million figure to be real. The following scenario for example has to be true:
Global Samsung phone shipments total 93 million units (which means 42.8 million feature phones sold as well as the 50.2 million smartphones).
6 million smartphones shipped into the US, equivalent to about 50% increase y/y, roughly in-line with market growth
4 million Galaxy SIII shipped (but not necessarily sold through) at an ASP of $450. This results in a US total smartphone ASP of $413
The global smartphone ASP is significantly lower (at 80% of the US or $330)
Global revenues of $18.14 billion is essentially all from phones
Global feature phones will have an average price of $36
If these conditions are met then it's possible that 50.2 million Samsung smartphones did ship.
The figure for feature phone ASP is difficult to accept as it would be lower than Nokia's. Also, the low global smartphone ASP is also difficult to accept but it might be possible to find a scenario with the above variables which makes the 50.2 million figure believable.
Unfortunately this is an unsatisfying analysis. I could propose another figure to answer the question in the title, based perhaps on more "believable" assumptions. But I have no means to defend my assumptions. The only option I have remaining is to caution that the total smartphones shipment estimate for Samsung remains precarious. The new evidence from the US trial places more doubt on it but it is not enough to disqualify it entirely.
---
Notes:
This cone of silence over 93% of the most popular mobile platform is somewhat puzzling in contrast to the perfect information we are used to having about iOS, BlackBerry and even Symbian. It seems that the more open a platform, the less is revealed about its market performance. This extends to the licensed Windows Phone whose shipments are only revealed through Nokia's reporting of Lumia shipments.
In the PC market, vendors also selectively publish their units. The norm is, however, not to. As a result IDC et. al. are the only sources for global market data. However, the PC market can be sampled more easily than the phone market. PC retail measurement methods are more reliable compared with all the points of sale for phones.
Note that Apple sells about 30% of iPhones in the US.
Apple's pricing world-wide is very consistent with pricing in the US which makes sense from a channel management point of view. One would not want to create incentives for cross-border arbitrage of phones.
The US is a crucial market for both Nokia and Microsoft's strategies. This importance was highlighted during the launch at CES in January when not one but three CEOs (Microsoft's Steve Ballmer, Nokia's Stephen Elop, and AT&T's Ralph de la Vega) were on stage to launch the Lumia. Knowing how well this strategy is working would be very useful to understanding how this market behaves.
My first take on this was when I asked the question How many Lumia phones were sold in the US? The answer suggested through the combination of survey data from Nielsen and comScore[1] was 330,000. The figure is quite small compared to expectations. As it's so extraordinary, it should be supported by good evidence. Unfortunately the methodology used is weak. The figure itself is probably close to the margin of error of such sampling techniques. It would be nice to have another way to calculate this.
Today Nokia offered another set of data which might help determine how many Lumia phones were shipped in the US. (Note the shipped versus sold distinction. Companies report shipments while surveys nominally measure consumption or usage.)
Unfortunately, Nokia did not offer specific data on US shipments. What they did offer was:
Global Lumia shipments were 4 million in the last quarter
Global average selling price was €186 for a Lumia phone
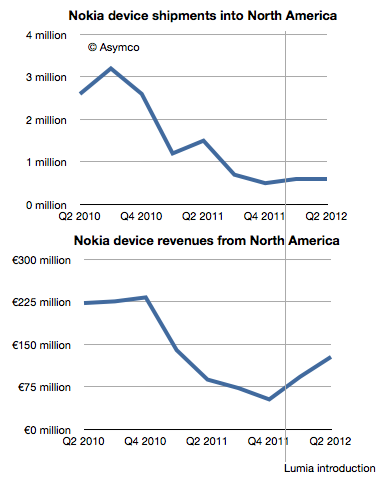
North American[2] phone shipments were 600k. This includes all phone types and all operating systems.
North American sales were €128 million.
That's all we have. So how can this help with the question of US shipments?
As often happens, it helps to look at the data historically. The following charts show North American shipments and sales with the Lumia launch date highlighted.
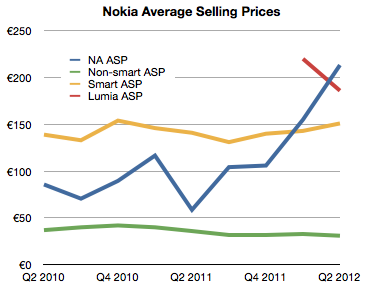
While unit shipments were flat, revenues increased significantly. This suggests that we could plot the average selling price of phones in North America (NA) specifically. I did that in the following chart:
Here the effect of Lumia is clear. The average revenue per phone in the US (blue line) jumped dramatically after the launch. So much so that it actually overtook the average global ASP for Lumia.
What we need therefore is a way to estimate the "mix" or percent of smart and non-smart phones sold into North America and derive perhaps the US portion of that and then finally try to separate the Lumia from all the smart volumes.
To help, I plotted the historic ASP for Smart and non-Smart devices as provided by the company.
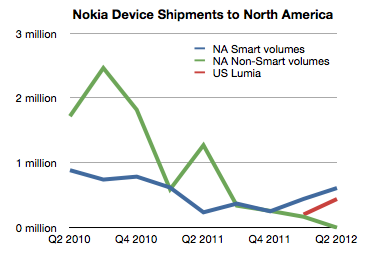
Using a simple formula[3] it's possible to derive the mix which is shown as Green and Blue lines in the following chart.
Getting estimates for smartphone shipments (blue line) is pretty close to Lumia shipments, but we still have to correct for US/Canada split (estimated at 90:10) and Symbian/WP split among smartphones (estimated 50:50 in Q1 and 20:80 in Q2).
The result is the red line showing US Lumia shipments. The sum of the two quarters then comes to 630k.
This is nearly twice the estimate from consumer survey data however I would not draw too many conclusions from this. Mainly because there are many assumptions place in both estimates, but also because there is the distinction between shipments and usage.
However, it might be safe to say that US install base is somewhere between 400k and 1 million users. Is this good or bad?
It's good because it's progress and there is some growth. It's bad because it's frightfully small relative to the competition. Nokia itself acknowledges the challenge and states that "We believe the Windows Phone 8 launch will be an important catalyst for Lumia."
It seems that what Nokia needs most today is time. That is a very expensive asset. Perhaps infinitely so.
---
Notes:
A practice neither company would condone, principally because they are competitors, but also because they use different sampling methods.
North America I take to mean US and Canada. Although geographically, Mexico is part of North America it's usually grouped as part of Latin America as a category. I'd like to get this confirmed.
There are a few implicit and explicit assumptions: (a) Global ASPs are roughly comparable with NA ASPs but (b) smartphone ASPs are higher in NA by about 30%
I've been publishing my estimates for Apple's business performance for a few quarters (see here, here and here). My estimates have been collected along with those of dozens of others by Philip Elmer-DeWitt at the Fortune Apple 2.0 blog.
I've also been scoring my performance and discussing the causes of errors. Here is the analysis for the fourth quarter 2011.
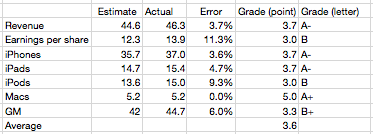
My estimate for Mac growth was very precise. It was based on a 27% growth estimate. It turns out that growth was well within historic range and thus quite predictable.
iPhone and iPad error was very modest at less than 5%. This led to a very low error on Revenues (as I also did not expect ASP to change).
I was too pessimistic on the iPod, expecting 30% decline and 13.6 million units. In reality the business declined by only 21% and Apple still sold 15.3 million units at an average selling price of $164.
Due to an underestimate on margins which are highly sensitive to iPhone margins my gross margin estimate was off by 6%. This led to a relatively poor EPS error of 11%.
Nevertheless, the "grade point average" for the quarter was 3.6 which is nearly an A-. This is an improvement from the B- from the last quarter.
Because the accuracy was good, there is little to be learned from the quarter. Perhaps the most important observation is that the iPhone recovered from two outlying quarters. The second quarter where it overshot expectations and the third quarter where it undershot. These were hard to predict because the product went through a delayed transition which whip-sawed both production and sell-in.
What we saw in the fourth quarter is a return to the predictable historic growth of nearly 100%.
To give a perspective on the performance of other analysts, a motion chart showing their errors is here.
See also the video PED published of the same data here. (This video was produced from the same motion chart shown above, selecting bars instead of bubble as the chart type).
Notes:
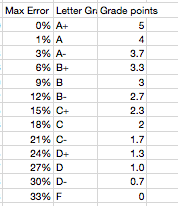
The scoring of the error is according to the following table:
The results can be seen for all the other analysts as a table here (with data since mid 2008).
Apple's products are often seen as being priced "at a premium". This is mostly a matter of perception, but in certain categories Apple's products are priced above the industry average (though probably still affordable to sufficiently large populations). As a result, when competitors launch lower-priced products there is a tendency to expect Apple to react and reduce its prices to compete.
This expectation was evident when AT&T had an exclusive on the iPhone. The assumption among many (expressed in comments here as well as elsewhere) was that a switch to multi-carrier distribution would result in a price reduction and consequently a reduction in margins.
It was evident in the iPod and the Mac businesses over the years as prices for competing products collapsed.
It is also evident with respect to the iPad where expectations are that the Kindle will cause a reduction in the iPad price (and presumably in the margin).
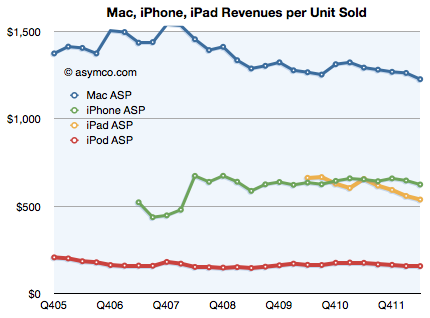
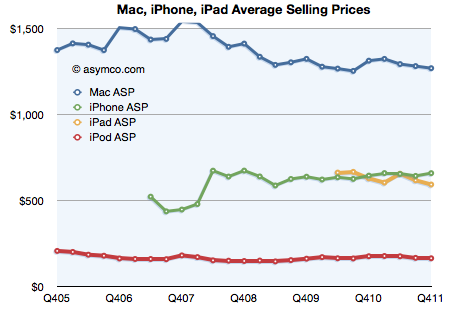
However, the data we have from Apple on their pricing shows no concessions to competitive price pressure. The following chart shows the historic prices that Apple was able to obtain for its main product lines:
Over the time span shown (six years) the Mac and iPod saw modest price erosion as would be expected from declines in component costs but there is little evidence that Apple altered fundamental price points (note that these values represent pricing to the channel not to consumers who pay for retail mark-up or discounting/subsidy/taxation).
Similarly, both the iPhone and iPad have held prices very consistently. There is some seasonality as products are launched and there were a few quarters where the original iPhone was priced differently, with operator service revenue sharing lowering the up-front price. But there is a consistency to these products that speaks of a strategy that avoids price-based competition.
In the latest quarter Apple launched a few new price points for the iPhone. With the 3GS and the iPhone 4 and 4S available, Apple had the closest it ever came to a phone portfolio. There was some anticipation that the 3GS price point ($375) would impact the average selling price. However Tim Cook stated that the 4S was the most popular product. Furthermore, the 4S introduced a higher capacity (64GB) which offered a new, higher price point.
As a result, the ASP for the iPhone actually increased to about $660 in Q4. During the launch quarter the iPhone ASP does tend to be higher but history shows that the variance is small. Gifting seasons also affect pricing where the mix shifts to lower priced variants as seen with the iPad and iPod, but again, these are not great changes and entirely due to mix shift. There is no discounting.
The evidence I see is that Apple does not change pricing but rather stakes out a specific price point as resonating with consumers given their positioning. They then doggedly stick to it. Competitors tend to exploit open price points or try to position with specs on the same spots Apple occupies. That's not a game I observe being played by Apple.
On October 27th, Nintendo published half year results for the fiscal year ending in March 2012. Management stated that the company lost over $900 million with a negative outlook. Nintendo cited weaker than expected sales of Nintendo DS hardware and 3DS software and Yen appreciation as the main reasons for the miss. Is this the end of Nintendo?
Before we look more closely, here is a quick summary: The company is exclusively involved in selling game hardware and software. Their console platform is the Nintendo Wii, which will be followed by the Wii U late in 2012. The Nintendo DS and Nintendo 3DS are the company’s portable game consoles. The Wii and the DS are nearing the end of their product cycles. On the software side, the company is known for gaming titles such as Super Mario and Zelda. Nintendo also pioneered the licensing model to allow third-party developers to produce games for its hardware products.
A closer look
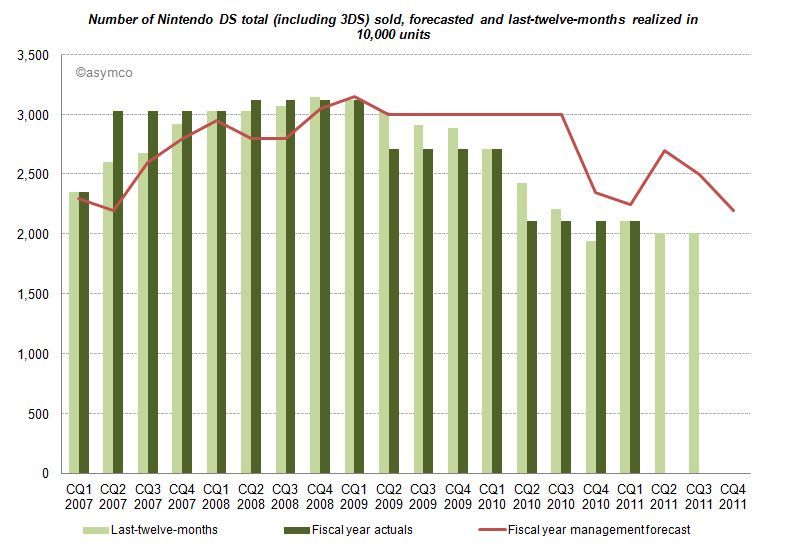
The good news for analysts is that Nintendo publishes their estimates for hardware and software unit sales. This allows us to measure management predictive accuracy. The red line (management forecast) should be as close as possible to the dark green pillars (realized unit sales in the fiscal year).
Until CQ1 2009 devices sales grew in excess of forecasts. A similar pattern can be found for consoles and game titles. After Q1 2009 forecasts have been always higher than results, and more worryingly, the deviation between forecast and sales is widening. Management missed and lowered forecasts for two consecutive years. Management's hope for an increase on the back of initial 3DS sales in the launch quarter (CQ1 2011) did not come to pass and they subsequently lowered forecasts again in the following two quarters.
Looking at all categories, management lowered forecasts almost continuously. The deviation remains the largest in the portable hardware business segment indicating that management was largely surprised about the development.
What caused this reversal of fortune?
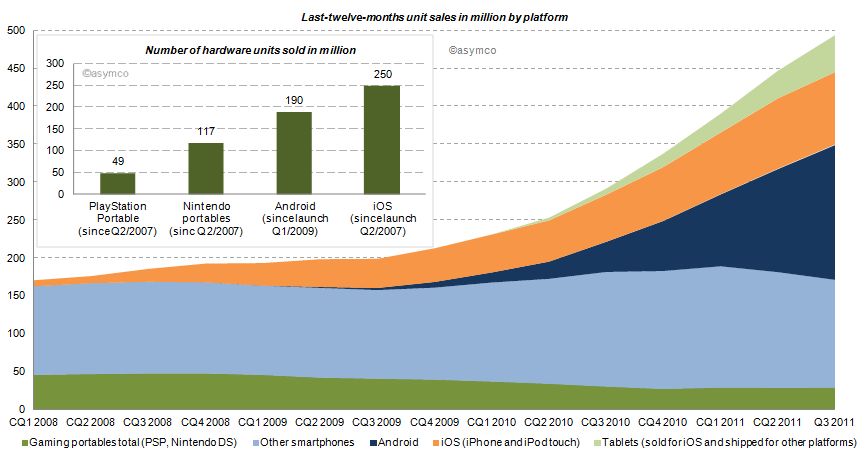
Two years earlier the iPhone had launched and by CQ1 2009 iOS reached an installed base of about 38 million, half the number of Nintendo portables in the same period. Furthermore, in CQ1 2009 Android phones came to the market. Smartphones (light blue area of the chart below) sold before (and after) the debut of iOS, but the iPhone redefined the category and an avalanche of smarter phones running iOS and Android followed (blue and orange area). Portable gaming devices from Nintendo and Sony declined ever since: 17% in 2009, 31% in 2010 and already 16% in the last twelve months.
How do the game players stack up?
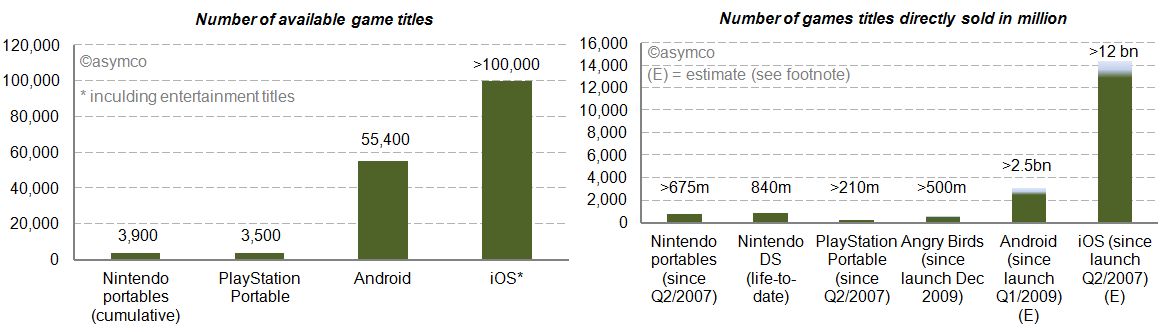
We already looked at the installed base in the chart above. iOS and Android have outsold Nintendo portable units by a factor of 2.1x and 1.6x. Furthermore, we can see (in the charts below) that the two main mobile platforms have 14 to 26 times more game (and entertainment) titles available. Nintendo and Sony also publish unit sales of directly sold software titles. For Android and iOS we know the cumulative app download statistics. By taking the share of Septembers’ paid and free app downloads as a proxy, we can conclude that also by this measure Android and iOS dwarf Nintendo and Sony [1]. The reach of iOS and Android is further underlined by the more than 500 million downloads of Angry Bird game titles - first released only two years ago - for any platform having sold more than twice the amount of Sony’s cumulative portable game titles and almost as many as Nintendo’s cumulative games titles since Q2/2007.
Who else has skin in the game?
Besides Nintendo, Sony, Apple and Google, who else is making a push into mobile gaming? Before investigating, let’s first have a closer look at Sony. Sony, just like Nintendo, is also active in stationary gaming segment with the PlayStation franchise. The Sony group also has access to entertainment most notable through Sony Pictures Entertainment and Sony Music Entertainment. Furthermore, Sony recently decided to buy Ericsson’s stake in the mobile phone joint-venture Sony Ericsson and is making a push with Android to bring its gaming titles as a differentiator for its own products to the platform. And the other major suspects? Microsoft, also active in the stationary gaming segment with its Xbox franchise, is pushing to bring the Xbox experience to mobile phones with Windows Phone. Amazon has retailed software and games for years and has started to distribute software and games via direct download on its own Kindle devices but also for the Mac. On the Kindle, Amazon is relying on a forked Android version on which it leverages its eBook and other entertainment assets. And then there is Facebook, a social network that wants to be on any platform or device. Out of 800 million users, 350 million access Facebook via a mobile device. Around 50% of Facebook members play games on the desktop. With Project Spartan, Facebook is aiming to bring the desktop experience to the mobile device including a stronger focus on gaming and video.
The competition between Apple and Google is already asymmetrical. Including the other contestants in the competitive landscape reveals Nintendo’s key weaknesses in the portable gaming market: attraction as a platform for developers in terms of ease and reach, pricing of hardware competing with operator-subsidized mobile phones and the jobs-to-be-done or value preposition. The new generation of mobile devices is standing against Nintendo’s dedicated approach. Although slowly adding features such as a browser and “app store” to its portables, Nintendo devices fall short in the variety of jobs-to-be-done compared to smartphones, let alone making a call.
Average selling prices and financial impact
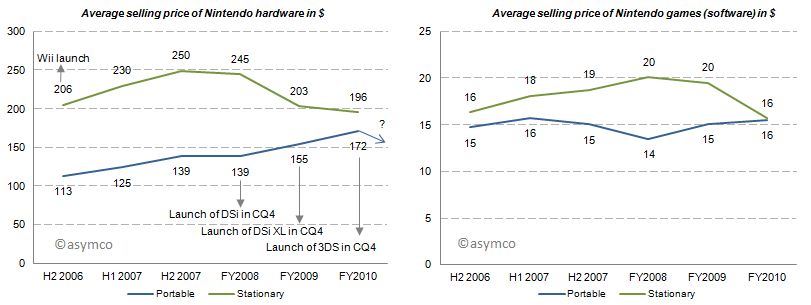
With this market pressure one would imagine that average selling prices decreased for Nintendo portables. But for the last three fiscal years average selling prices for portables have increased, all things equal, mainly due to new product launches. Game title’s average selling prices have remained relatively flat. Note that these are wholesales prices for hardware and a mix of retail and wholesale prices for games. In 2011, for which we do not have data yet, the price of the newest portable, Nintendo 3DS, was lowered from its U.S. debut of 320 250$ in February to 170$ in July which will have a negative impact on ASP going forward.
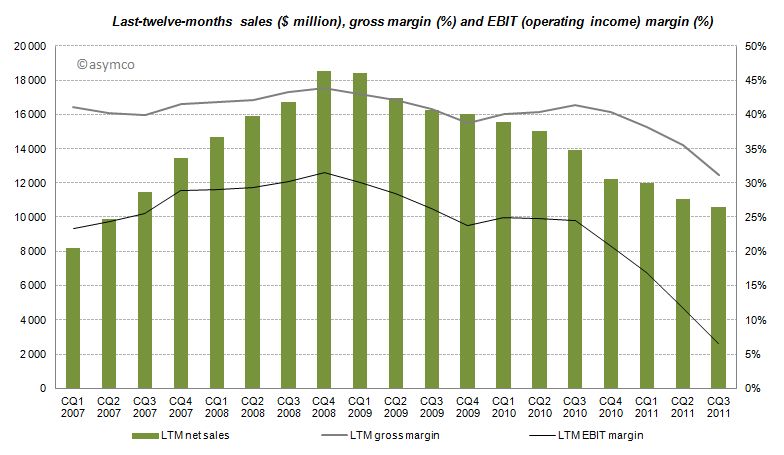
The effects of Nintendo’s rigid strategy and the fast changing competitive landscape are manifested in the devastating financial performance over the recent quarters with LTM sales, gross margins and EBIT margins declining starting from CQ4 2008 and even accelerating to decline after CQ3 2010.
Furthermore, even though the company has recognized its own difficulties, Nintendo has no intention of adjusting its strategy:
CEO Iwata on the question of whether Nintendo plans to bring its game library to other platforms:
This is absolutely not under consideration. If we did this, Nintendo would cease to be Nintendo. Having a hardware development team in-house is a major strength. It’s the duty of management to make use of those strengths. It’s probably the correct decision in the sense that the moment we started to release games on smartphones we’d make profits. However, I believe my responsibility is not to short term profits, but to Nintendo’s mid and long term competitive strength.
Although realized and obvious, the disruption’s invisibility is often manifested in the paralysis of the incumbent.
Conclusion
According to Isaacson, Steve Jobs apparently always worried who could eat Apple's lunch. The lunch of the iPod, he concluded, was ripe for mobile phones. Subsequently, Apple entered the mobile phone space. Google followed. Since then more powerful mobile phones have eaten the lunch of the dedicated gaming device. The jobs-to-be-done and their priorities in people’s life have not changed, but the tools people use to get them done have. Permanently.
---
Notes:
Estimated by multiplying total cumulative app downloads with September’s share of game downloads: For iOS ranging from 72-80% based on Top 150 free and paid app downloads, for Android ranging from 38-47% respectively. This is a very crude estimation, but the gist of it is that 4% for iOS and 11% for Android game downloads as percentage of cumulative app downloads would outsell Nintendo.