Asymco

Asymmetric Intelligence

ASP

  1. Estimating Samsung's smartphone mix

    Research · 57 comments

    Samsung no longer reports mobile phone shipments. The company's phone market performance reporting is limited to the following:

    Shipment : High-20%↑YoY (low-20%↑QoQ)

    ASP : Slight increase QoQ

    As the company did not report volumes or ASP last quarter either, the QoQ (Quarter on Quarter) growth estimates are almost useless. The only fragment that might be useful is the "High-20% YoY" given that they did publish units for Q3 2010: 71.4 million. This leaves the question of what "High-20%" means. Here are some ranges and what the result would be:

    • 92.1 million assuming 29% YoY growth
    • 91.4 million assuming 28%
    • 90.1 million assuming 27%

    The "best guess" might be 91.4 million.

    As the company also provides revenue for its mobile division (14.42 trillion Won) we can therefore estimate the average selling price: $142. Is this a slight increase? By a similar approach, last quarter's ASP was $139, and assuming exchange rates did not vary widely, this increase is small enough to be called "slight".

    We also have a figure for the operating margin for the entire Telecom group (16.9%) which gives an operating profit of $2.2 billion.

    The last piece of the puzzle is the number of smartphones Samsung shipped. Samsung said smartphones grew "more than 300%" year over year. That would imply 31.4 million. One estimate is from Strategy Analytics that suggests 27.8 but it's coupled to an overall volume estimate of 88 million (well below the 91.4 million estimated above). The Wall Street Journal published an estimate of 28 million.

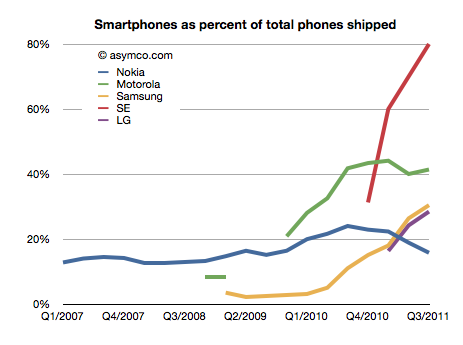
    I have no idea how to narrow down this estimate, but if we go with the one that claims the highest precision (27.8 million) we get an estimate of about 30.4% of Samsung's volumes being smartphones (what I call the "smartphone mix"). That is an interesting basis for comparing Samsung's smartphone business to other companies' smartphones. I prepared a graph showing how pricing is affected by the increasing mix of smartphones in vendor portfolios.
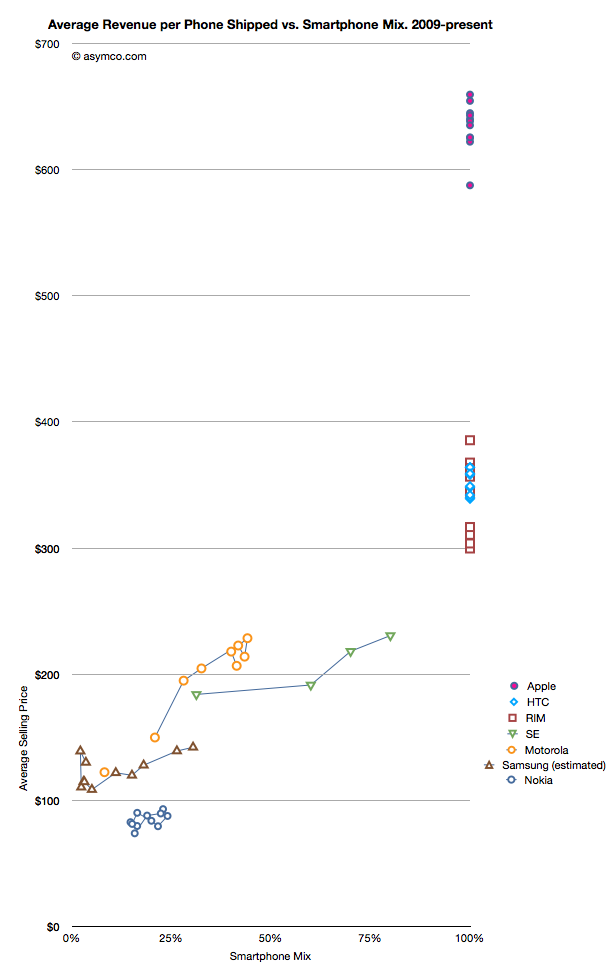
    What the graph shows is the movement of prices as companies have increased their smartphone mix since Q1 2009. For example Sony Ericsson moved from 31% smartphones to 80% smartphones in about a year. Their ASP increased from $184 to $231. Some companies have not changed their mix. Apple, HTC and RIM have maintained 100% smartphones in their portfolios so their pricing has been consistently high ($650, $354 and $357 over last 12 months, respectively). Conversely, Nokia has struggled with its smartphone portfolio and as a result its pricing has remained stubbornly clustered below $100.
    But the most interesting companies to watch are Samsung, Sony Ericsson and Motorola. You can see how their "vectors" or price migration point toward the sweet spot where HTC and RIM reside. Ideally, they would be very much better off with pricing in the $300 range.

    Samsung is moving quite rapidly toward the sweet spot but the slope is not as steep as the others. That's may be because SE and Motorola have much smaller volumes but it's still an open question why, with an estimated 30% mix of smartphones, the pricing remains $60 lower than when Motorola was at the same mix or $40 lower than Se.

    Some of the answer might be due to the number of "low end" smartphones (Bada?) that Samsung is selling or maybe their non-smartphone pricing is trending down a lot more rapidly.

    Keep in mind that if we change the assumption of the number of smartphones to a lower number (i.e. below 27 million) then the trajectory of the Samsung line in the graph would increase and may match more closely the slope of the other two vendors.

    I don't have any reason to believe that it's lower than 27 million but I don't have any reason to believe that it's above 27 million either. It's an estimate.

    If we believe it then we have to say that with a near tripling of smartphone mix (from 11% to 30.4%), the company grew its overall units by 28% and its revenue by 39% and pricing by 17%. Profits also grew by 130%.

    It would follow then that switching to a 100% smartphone mix would make a lot of sense.
  2. The new iPhone portfolio and implications on ASP

    Research · 74 comments

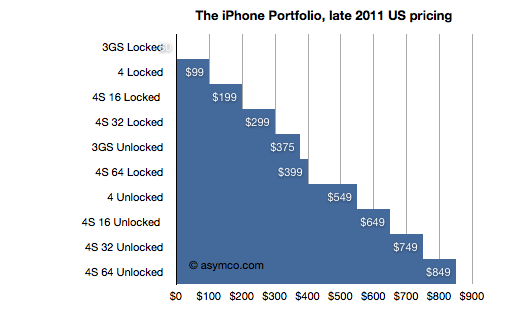
    The iPhone portfolio is now larger than ever. It's arguable that, for the first time, we can actually call it a portfolio vs. the [n, n-1] pair of products that's been available to date. A year ago I even argued that the n-1 variant of iPhone was more of a cognitive illusion than a real alternative.

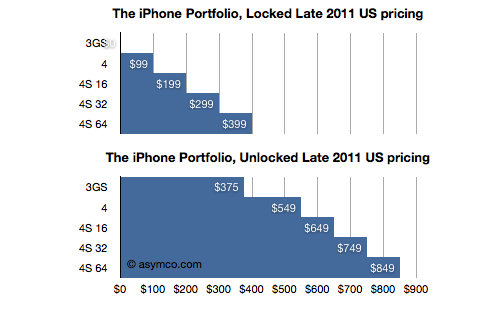
    But that all changed last week. For the first time since launch, there is a real portfolio. The iPhone is now available as five different variants with 10 different price points. Prices and options may vary by country, but I took the US portfolio as the baseline and illustrated it:

    Including all the pricing options It's a very regular pattern. It reminds me of the iPod which, at one time was sold at every $50 increment point from $50 to $500. The logic behind this pattern is that "there is now an iPhone for every budget". Of course, as with any purchase decision, each of these price points has trade-offs. Considering product performance or in terms of option value, the buyer has many things to weigh.

    To simplify, I divided the options into two subsets: Locked and Unlocked.

    We can now see the premium for unlocking (or, the discount for losing the freedom to use the phone on another network, as the case may be). We can also compare unlocked prices to unlocked prices for competing products.

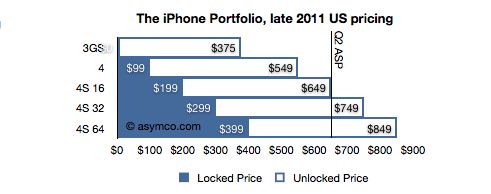
    To assess it further, I combined the two charts above into one, superimposing the unlocked price onto the locked price.

    In this last chart it becomes clear that buyers who purchase an unlocked phone are paying $450 more (the white areas), regardless of the phone's spec (except for the 3GS where the difference is only $375). For locked phones, the $450 discount is, presumably, the value of the change of carrier (GSM only) option for a buyer.

    But there is more to this picture. The unlocked price is also the price that Apple sells its product direct to consumers, many of which will be traded in secondary markets world-wide. Many will be sold in countries where Apple does not have distribution agreements with any operators. Because Apple needs to avoid channel conflict, they cannot price the unlocked product lower than they sell it to their channel. As a result, the unlocked price must be very nearly the price that operators themselves pay (excluding any volume discount).

    We can actually confirm this because Apple publishes the average selling price (ASP) that Apple obtains from the iPhone. I made a line in the last chart at the price Apple got in the last quarter.  It falls very nearly around the mid-point in the portfolio (and thus assuming the mode equals the mean and median in the distribution of sales.)

    There is one further implication in this. I think it's a safe assumption that the ASP for the new portfolio will be largely unchanged. Although Apple introduced the lower price for the 3GS ($375), it also added a more expensive 64G option. The lowering of ASP with the 3GS may be offset by the additional high-end sales, especially early on.

  3. Sprint's gamble

    Research · 62 comments

    The Wall Street Journal reported that Sprint Nextel made a "multibillion-dollar" gamble on the iPhone. This is based on information that Sprint committed to buy 30.5 million iPhones over the next four years.

    Wall Street Journal reporters calculated that the deal is worth around $20 billion on the basis of iPhone ASP during the last quarter (about $650). That Sprint would get that price is possible but not necessarily correct as there is likely to be some discount and the ASP Apple receives includes accessories.

    But the "gamble" is more than the deal value. The way it's being reported is that Sprint bet the company on being able to sell this many iPhones. So naturally we have to ask: how hard can it be to sell 31 million iPhones?

    First, note that the order is over a four year period. It's also not likely to be linear, with volumes accelerating over time. If I estimate a ramp where in year one the commitment is for 4 million, year two 6, year three 9 and year four 12 million we get a total of 31 million. Can Sprint sell this volume?

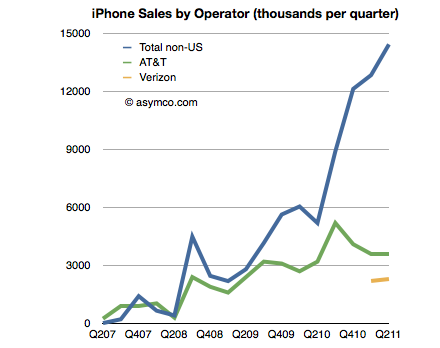
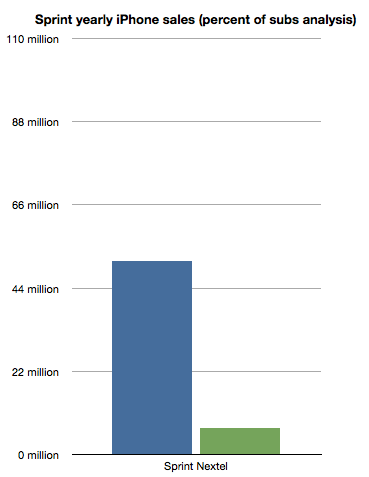
    To get an idea we can look at the sales rates for the other US operators. I built a table of iPhone sales by Operator last July. The data is shown in the following chart:

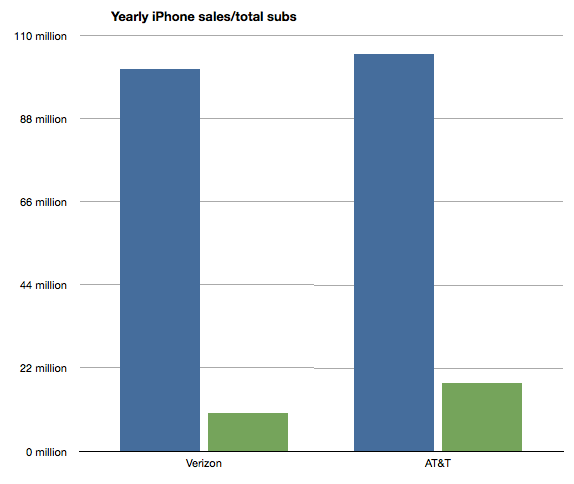
    What is interesting is to see the number of iPhones sold in a given time frame as a percent of subscriber base. I chose to measure a year's worth of iPhones where I extrapolated Verizon's volumes from the six months reported so far.

    The ratios are that Verizon sold iPhones at the rate of about "10% of its subscriber base per year". AT&T has been selling at the rate of about "17% of its subs per year". If we average these two we get about 13.6%.

    So if we assume that Sprint can sell iPhones at about the same rate as Verizon or AT&T (as a percent of their user base which was 51.1 million) we get about 7 million iPhones per year.

    That's right in the middle of the range it needs to get to 31 in four years [4,6,9,12]. I charted the projection on the following chart:

    So the gamble Sprint is taking is that they will be able to sell iPhones at the same rate as Verizon and AT&T.

    How is this risky?

    The deal seems to be inline with what is known about the product's popularity and the pattern of purchasing and upgrades that US consumers have been exhibiting for a few years.

    As with AT&T and Verizon, volumes ramp up over time. As with AT&T, users are loyal and they upgrade regularly. As with Verizon, there is competition from Android and Blackberry. As with both, payment is expected up-front with payback over the duration of contract length. As with the others, there will be incentives to keep churn down.

    If anything the riskiest thing for Sprint would have been not to do the deal at all. Indeed, we'll get to see the effect of that option on T-Mobile.

  4. iTunes App Store generated $3 billion in sales

    Research · 33 comments

    The announcement of $2 billion total for App store payments to developers did not come as a surprise. On January 22nd Apple reached 10 billion total apps downloaded. From that figure and an earlier derivation of the average selling price, I estimated $2 billion was paid out around the same time frame.

    We don't know exactly how many apps have been sold at exactly the moment when $2 billion was paid out so we don't have the means to update the ASP of apps (currently estimated at 29c).

    We do know for certain however that the app store generated $2.86 billion in sales if $2 billion was paid out.

    The new data affirms existing estimates.

  5. The price of Windows Phone: Nokia's evaporating smartphone share

    Research · 61 comments

    In the last quarter Nokia sold 28.3 million Symbian phones. The average selling price was €156 or approximately $210. That price was down 17% year-on-year.

    According to the company,

    The 17% year-on-year decline in our converged mobile devices ASPs was mainly driven by general price erosion and an increase in the proportion of lower-priced converged mobile devices sales.

    ASP erosion has been a fact of life across all of Nokia's products for quite some time, checked only by the increasing mix of smartphones. However the smartphones it sells have been consistently positioned for lower price points. This is consistent with Nokia's long-term goal of serving "billions" of users.

    The trouble with the new strategy is that the Windows Phone product lines currently in the market are not likely to be priced in the $200 range. The reason is that the minimum specifications for Windows Phone 7 are:

    • Capacitive, 4-point multi-touch screen with WVGA (480x800) resolution
    • 1 GHz ARM v7 "Cortex/Scorpion" or better processor
    • DirectX9 rendering-capable GPU
    • 256 MB of RAM with at least 8 GB of Flash memory
    • Accelerometer with compass, ambient light sensor, proximity sensor and Assisted GPS
    • 5-megapixel camera with an LED flash

    These don't add up to a product that can be sold profitably at $200. The bill of materials is likely to be in that range (and one has to add $15 for Microsoft).

    So there are two possible implications for Nokia's new smartphone strategy.

    1. Windows Phone will be ported to lower spec/cost hardware to allow the traditional Nokian market growth model to continue and perhaps combat Android proliferation
    2. Nokia's smartphone portfolio will consist of high-priced products, and exclude mid-to-low price products.

    Option 1 is difficult to imagine. The user experience that Microsoft is putting forward as its differentiation depends on significant hardware which is unlikely to become very cheap very soon. It is an interesting exercise to think through however. What would we have to believe for this option to become real?

    Option 2 is more likely as Nokia conforms to this a new definition of smartphone as "high-end" only. This seems to be the default option given what is visible to observers today.

    If Option 2 is in fact the outcome of the new strategy, then it leaves Nokia very vulnerable to a low-end disruption (after it's succumbed to a new market disruption.) The $50 smartphone will be reality this year.

    Option 2 also most certainly guarantees that Nokia's current market share of 30% in smartphones is likely to be lost and never regained.

    Some might argue that's no great loss. After all, Apple does very well with low share and high prices. However, Nokia is almost religious about market share. The reason being that scale offers significant purchasing power and logistical leverage. It sustains a cost structure, distribution network and a business model that is central to the company's core competency. It's also presumably the reason Microsoft partnered with Nokia in the first place: volumes and wide distribution.

    So we're back to the old question: how does the new deal lead to a thriving ecosystem? Does it depend on vendors other than Nokia? If so how does Nokia benefit from the sale of Samsung phones?

  6. The remarkable stability of pricing

    Research · 27 comments

    Prices provide accurate, independent signals about where, when, and how to create and deploy value-creating innovations. The mechanism of free markets signals what should be rewarded and what shouldn't. When comparing competitors, prices are the best indicators of differentiable positioning.

    However, prices are sometimes anomalous and subject to transient market conditions. It's therefore important to observe pricing over a long time frame.

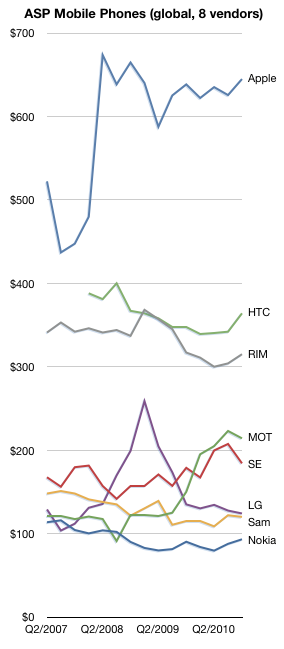
    This chart shows the average selling prices for all phones sold by the eight publicly traded phone vendors (covering approximately 70% of the market) since mid-2007.

    There is remarkable stability in the pricing of the competitors. One could argue that only Motorola and LG saw significant swings in price. (Apple's instability in 2007 was due to the revenue sharing deal for the 2G iPhone on AT&T).

    Motorola pared down its portfolio (and its market share) and as a result has seen a doubling in ASP. LG had a rapid rise and rapid fall as its feature phone business boomed and busted.

    But otherwise, pricing trends are subtle: down from Nokia and Samsung. Slight decrease for RIM and HTC and stable for Apple. In a future post I'll dive into the relationship between pricing power and share.

  7. How does the Mac gain share while increasing its price premium over the Windows PC?

    Research · 54 comments

    Apple set a new record for Mac sales in the fourth quarter. This was not a surprise. The growth was perhaps a bit lower than some expected (including me) but it was still a healthy 23% and 8x the PC growth rate. The Mac has outgrown the PC (and hence has gained share) for 19 quarters straight, nearly five years.

    What's more interesting is where the growth came from. Every region outgrew the market. Asia-Pacific led with a 67% year-over-year increase, almost 10x the market. Japan grew at 56%, which is about 6x the market, and Europe and the United States both grew in double-digits despite both markets contracting overall.

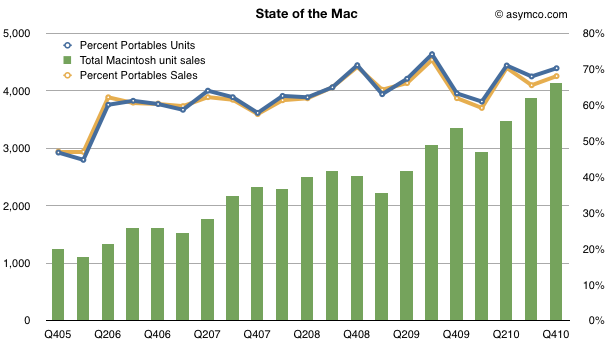
    Looking over a longer time frame, the Mac has nearly quadrupled in volume in five years. In the last quarter of 2005, Apple sold 1.2 million units. In the latest quarter it sold 4.1 million. So the performance has been relatively good.

    One significant reason for the growth has been the shift from desktop to portables. The lines show how the percent of portables went from about 50% to 70% of units and sales in four years.

    [hang1column]

    [/hang1column]

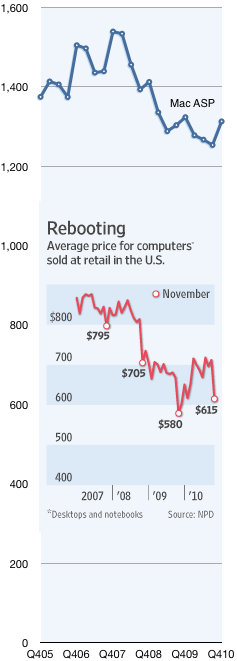
    But what was surprising was that the average selling price increased to $1,313, up from $1,253 and nearly even with last year's $1,324.

    Prices in the PC industry tend to fall. Actually, to be more precise, they tend to collapse. Compare the Mac's price trend with the rest of the industry as seen in the chart to the left[1]. It shows the Mac Average Selling Price which is what Apple books from selling into the channel vs. the retail price of PCs in the US.

    The chart tells a partial story. The PC figures are retail while the Mac figures are wholesale. Furthermore, the PC figures include Mac, so stripping out the Mac would show the PC prices to be even lower. Lastly the Mac figures are global whereas the PC figures are US only.

    But what I want to focus on is not the absolute difference, rather the relative value difference, which is diverging: The average PC went from $795 retail at the end of 2007 to $615 in November 2010. That's a drop of 22%. In the same time frame the Mac went from $1,539 to $1,313 wholesale, a drop of 15%.

    In other words, the Mac price premium at the end of 2007 was at least 93% and it now is at least 114%.

    So here's the real surprise: How does the Mac gain share while increasing its price premium over the PC?

    The only answer I can offer is what I already wrote on the Mac in November:

    ...something changed with PCs when the laptop became “good enough”. With portable computing, the job the PC was hired to do evolved. It was more important that the product be well designed (for aesthetic value, usability and reliability) than just fast and spacious. The microprocessors were plenty fast but what mattered more was low power consumption, a low profile and tighter integration with software.

    In other words, computers became re-integrated. You only need to touch the MacBook Air to understand why.

    ----

    Notes:

    1. The inset chart comes from The Wall Street Journal using data from NPD. The Mac data comes from Apple financial reports.
  8. The end of exclusivity doesn't change the price operators pay for the iPhone

    Research · 55 comments

    AT&T does not pay a higher price for iPhone exclusivity | asymco.

    At the risk of repetition, there are three instances in conference calls that Apple management has stated that the iPhone has a fixed price for all operators and resellers.

    The first was in October 20, 2009:

    “So when you go from exclusive to multiple, you don’t change the charge to the carrier?”

    Cook answered: “Correct.”

    The second was a year later, October 18, 2010:

    Chris Whitmore – Deutsche Bank:  And what is your experience then when you’ve gone non-exclusive from a subsidy and margin standpoint on the phone, have you had to give anything up in the past?

    Tim Cook: We don’t give specific information out on the margins. But I think you can look at our ASPs and see that they’ve generally stayed above $600, and that’s despite opening up several markets from an exclusive market to a non-exclusive market.

    And the third was a few days ago on January 8, 2011:

    Toni Sacconaghi - Bernstein Research:  You've said on previous earnings calls that the move to iPhone non-exclusivity in regions of the world has had no impact on your ASPs. Can you comment on whether that is it still the case today and whether we should expect any impact in the migration away from U.S. exclusivity?

    Timothy Cook: I don't envision the overall iPhone ASP decreasing from the December quarter that we just completed to the March quarter that we're currently in.

    But, as always, we can confirm and validate using the data on pricing we have available.

    In this case in the financial reports (take iPhone revenue and divide by units sold):

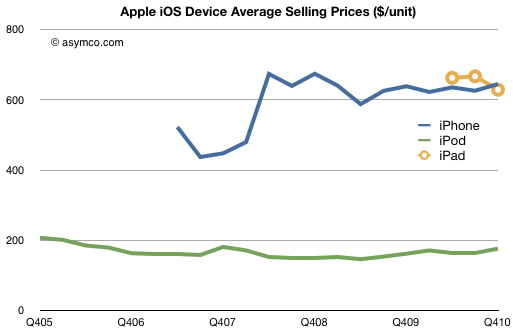
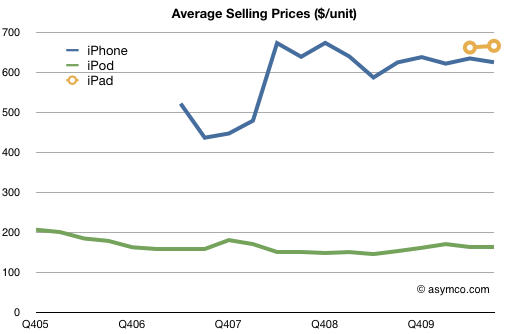
    You can see that after the first iPhone "2G" which had a peculiar pricing that included revenue sharing with the operator and which showed up differently in the accounting, the iPhone has had a steady price slightly above $600 for over two years[1].

    This is despite having more than 60% sales outside the US and being non-exclusive multi-operator in many countries. Despite being available locked, unlocked and everything in-between.

    We can even confirm what one particular operator paid exactly. In October 2008 AT&T reported that they had paid $900 million for 2.4 million iPhones. That's $375 per phone. Assuming a mix of $199 and $299 3G phones that gives something around $600--below the global ASP for that quarter of about $676. Here exclusivity would imply a discount to average price! The reason for the discount is most likely volume as AT&T was by far the largest buyer of iPhones globally.

    Still unconvinced? Try shopping for an unlocked iPhone at any of various retail locations where it's available unlocked. Accounting for VAT or other taxation, the price is always the same and is a slight mark-up to the operator ASP due to retail margins.

    Judging from comments on this site, the myth that loss of exclusivity in the US will change profit margins for Apple still persists no matter how many times I repeat this story.

    -----

    Notes:

    1. The steadiness of the price should give another huge clue as to the effect of competition on the product.
  9. The $85 Smartphone and the imminent extinction of non-smartphones

    Research · 136 comments

    In a recent article I made the claim:

    My bet is that by the end of 2012, it will be hard to find any branded phones which won’t run a smartphone

    I also showed how pricing has evolved over the last three years.

    Two days later an article in Fortune's Google24/7 blog highlighted the possible price points of low-end smartphones:

    I had a chance to speak with Jim Tran, VP/GM – Handset Line of Business for Broadcom, who was able to elaborate on the details of the new processor and what it meant for the industry.  Here are some of Broadcom's bullet points:

    The BCM2157 baseband, since it combines many functions on one chip, is able to run more efficiently, meaning less battery power will be needed than on current basic handsets

    Low-cost, low-power, 65 nm digital CMOS process means the silicon will be cheap

    The dual-core processors will run at 500-800mhz.

    Supports portable Wifi hotspot and Android 2.2 and up

    But the kicker is the price.  Tran says that phones made from the BCM2157 chipset will retail for under $100 and may dip as low as $75.  Those devices should debut in just 3-6 months (and we might hear about them next month at CES)....

    To be clear, That sub $100 price is not the cost of materials, it is the suggested retail price after the manufacturers (and carriers) have taken their profits.

    via 2011 will be the year Android explodes - Google 24/7 - Fortune Tech.

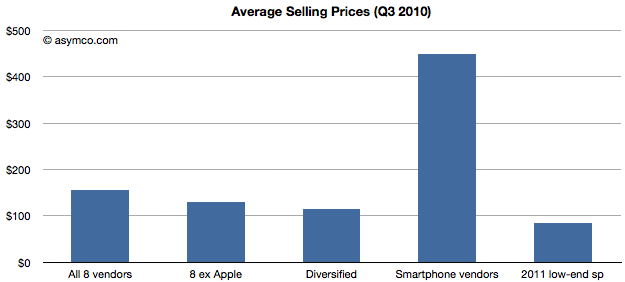
    My own data shows that the average selling price for the top eight phone vendors for Q3 of 2010 was $156. Smartphone-only vendors were charging $450 on average and diversified vendors selling both smart and non-smart phones were charging $144 on average.

    Nokia's ASP for its entire line-up was $88 (spread over about 84 million non-smart and 26.5 million smartphones).

    What strikes me about the claim from Broadcom is that a $100 retail price for a smartphone implies an ASP of about $85 or so (assuming $15 or a very modest 18% channel mark-up).

    That means that a smartphone could be built using this chip which would have nearly half the average price of all branded phones sold last quarter.

    It would also be priced cheaper than the average price Nokia charged for all its phones (75% of which were non-smart phones.)

    And this type of phone could be available not in three years in three months.

    The chart above shows how prices could collapse.

    Of course, low price is not the only condition for the widespread substitution of smart devices in vendor portfolios. But it does take away a significant objection. It no longer seems far-fetched to say that in another two years the price points for smartphones will be low enough to make them marketable in all markets. This may in fact be true next year.

    I suspect that non-branded vendors will lead the way and make these devices widely available in emerging markets. The question will then be entirely up to the branded vendors whether they will follow or will they try to market dumb phones vs. smart phones at similar price points. Will buyers opt for a branded device with no ecosystem or unbranded device with the Android ecosystem?

    It becomes harder to envision any reason why non-smart devices will earn positions in portfolios two years from now.

    Note that I'm not suggesting that the market for high-end smartphones is threatened yet--there is still a lot of innovation that still needs to happen to shape that market into one of mobile computing (vs. mobile phoning).

    Instead, what I am suggesting is that the bottom of the phone market is very vulnerable to becoming smart. This may sound like an odd sort of disruption, but it's a very sinister threat to companies who are in the business of selling brands and not platforms.

  10. What has Android done for Apple?

    Research · 44 comments

    One of the most popular themes running through the mobile phone industry this year has been the unprecedented growth in Android adoption. I've argued that the adoption was initiated on the supply side by vendors and operators, but demand has certainly manifested itself.

    Android is almost viral in the way it spreads. With no constraints on intellectual property, pricing, contracts, modification or terms of distribution, the incentives to push product out are phenomenal. It even works, mostly.

    One hypothesis of the consequences of this viral adoption is that there will be a "commoditization" of smartphones with rapid price erosion to follow. This in turn might even lead to lower margins for Apple and RIM and most major vendors, including those selling Android itself.

    In order to test this hypothesis, we need to look at what has been happening to prices. If prices have started tipping down at more than their usual rate then maybe commoditization is happening.

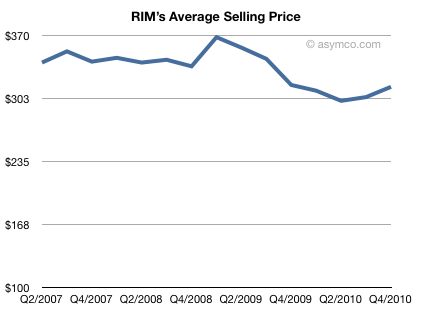
    We can begin this test with the industry's canary in the coal mine: RIM. RIM has been struggling for growth in the very market where Android has been growing the fastest. Is RIM's pricing under pressure?

    Interestingly, no. Their ASP (average selling price) decline, from an average of $350 to $310 in late 2009, came before the Android avalanche. During this year, the ASP has held steady, even rising in the last two quarters to $315 while Android activations reached 300k/day.

    So I don't see a big problem with RIM, yet.

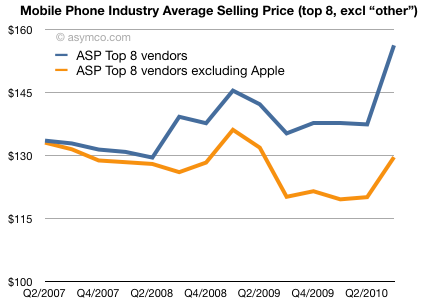
    What about the industry as a whole? Can we see patterns that suggest imminent commoditization? Using the top 8 vendors (Nokia, Motorola, Samsung, Sony Ericsson, LG, RIM, Apple and HTC) and using volume-weighted ASP (total device sales divided by total units sold) we have the following chart:

    Since the second half of 2007 the "industry ASP" (blue line) has actually increased. This is even though there was a huge recession in the middle of the time period.

    This should be only slightly surprising. If you suspected that the iPhone may have a lot to do with that, you would be right. If you remove Apple from the mix, the second line (in orange) shows that the top vendors (ex-Apple) had some, but quite quite mild erosion (from an ASP of $133 to $129)[1].

    This is far milder than what's been happening in the PC sector where prices are dropping catastrophically (According to NPD the average selling price of all Windows portable PCs has fallen from $659 in Oct. 2008 to $519 in Oct. 2009).

    So Apple was a big contributor to the industry increasing its pricing power.[2] but even without Apple the industry has been holding on.

    But is this just a lull?

    Is Android going to stop the growth?

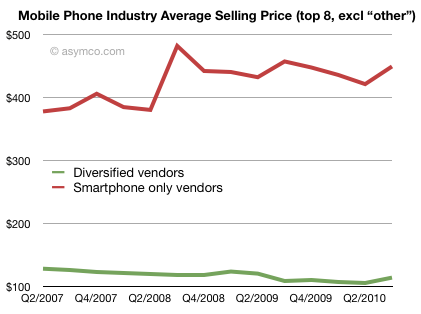
    We can look at the pricing data one more way: If we separate the eight companies into two cohorts, the "diversified" vendors who sell both smartphones and regular phones vs. the "pure play" smartphone-only vendors, we get the following price history.

    What is happening is that the diversified (Nokia, Samsung, LG, Sony Ericsson, Motorola) saw modest price declines (from $128 to $114) while the pure-players saw price appreciation (from $378 to $449). This is with the early impact of Android priced in. Unfortunately I don't have a chart showing non-smartphone prices in isolation, but I would be willing to bet it would be a significant negative slope.

    In these two lines Android is not an independent variable. Android was adapted by some of the diversified vendors (all but Nokia), but in different ways. The thing is that Motorola and Sony Ericsson had great increases in ASP with Android. Among the pure-play vendors only HTC adopted Android and its performance is undistinguished vs. RIM which didn't.

    So what, if anything, has Android done to pricing?

    I argue that there is no evidence in the pricing data of a coming commoditization of smartphones. Android vendors were able to use the platform to move to higher pricing and the more they switched their portfolio to Android the more they got a better average price. At the same time those vendors who built smartphones without Android also saw strong price supports.

    The only correlation with pricing power is whether you build smartphones or dumb phones. The more smartphones you build, the more price you can charge. This is regardless of platform.

    The reason for this is that the smartphone market is growing so rapidly (90% y/y). There is limited direct competition between smartphones and a lot of competition between non-smartphones and smartphones--a battle smartphones are winning handily, irrespective of price. Smartphones seem to be what everyone wants.

    So the real question that should be asked is:

    Why do vendors bother making any dumb phones at all?

    If you look at the third chart above you can see how attractive it must be for the diversified vendors to abandon the non-smart market to ZTE, Huawei et. al. Perhaps Nokia can still make a small profit there but to do so you need to run faster and faster toward extraordinarily low costs and prices. A point where phones cost less than everyday consumables. What keeps Samsung and LG in that game? Motorola and Sony Ericsson left once they hit profit warnings. Is that what it takes to drop what seems to be a loser business? I think not.

    My bet is that by the end of 2012, it will be hard to find any branded phones which won't run a smartphone OS. Demand and supply of smartphones will race each other to overwhelm portfolio logic at the largest companies. The zero (visible) cost of Android will snowball this effect. What's even more provocative is that I believe the "others" will follow and abandon voice-oriented phones for smartphones almost immediately after the larger group.

    So what have the Androids ever done for us?

    I've long argued that the phone market should be studied as a whole because the competition is not between platforms but between smart and non-smart. Pricing is a leading indicator of what drives decision making inside vendors and it leads margin, and thence portfolio discussion. Android is expanding the market without crushing pricing. The margin expansion is what attracts more vendors and creates more demand. It's a virtuous cycle.

    In a way, this is all good news--even for Apple. A world full of smartphone users is a better addressable market for iPhones than one filled with voice products. iPhone's traction was always in markets which had been seeded by some smartphones: the US with RIM and Europe with Symbian. Such a smartphone-soaked world will have better mobile broadband infrastructure, users with more demanding tastes and awareness of the value that a smart device can bring.

    ---

    [1] The effect of "other" vendors not among the 8 listed is a big unknown. It's been estimated that they now make up as much as 30% of total volumes and that they are beginning to ship significant volumes with Android. Without visibility into that part of the market, we should be cautious. However, the eight vendors sampled here are still a significant cohort and the conclusions still appear reliable.

    [2] This industry had, until 2007 suffered from chronic price erosion. Each sustaining innovation drove a mild burst of pricing power but it never seemed to last. From color screens to bluetooth, to 2.5G to 3G to MMS, to cameras to music playback, each hardware advance was not enough to keep the erosion away. The tipping point seems to be the iPhone and the shift to software as the component that drives price power.

  11. AT&T does not pay a higher price for iPhone exclusivity

    Research · 6 comments

    In last year's third calendar quarter earnings call (October 20, 2009) Tim Cook was asked:

    “So when you go from exclusive to multiple, you don’t change the charge to the carrier?”

    Cook answered: “Correct.”

    In this year's third calendar quarter earnings call (October 18, 2010) Tim Cook was asked again whether the future iPhone non-exclusive subsidy will affect the iPhone revenues and again Tim Cook repeated that it won't.

    Chris Whitmore - Deutsche Bank

    And what is your experience then when you've gone non-exclusive from a subsidy and margin standpoint on the phone, have you had to give anything up in the past?

    Tim Cook

    We don't give specific information out on the margins. But I think you can look at our ASPs and see that they've generally stayed above $600, and that's despite opening up several markets from an exclusive market to a non-exclusive market.

    The recurring assumption that the loss of AT&T exclusivity will cause iPhone price erosion is wrong and has been evident in the sales data for over a year now. Not only did Cook state clearly that there is one price for iPhone to the channel regardless of exclusivity but the price data shows that as Apple moved to non-exclusives in many regions of the world, the ASP remained fairly constant:

    Over the period when the blue line has been flat, Apple moved a number of markets from exclusive to non-exclusive.  There are three main countries where iPhones have a contractual exclusive relationship. That is the United States, Germany and Spain. (China and Japan are exclusive due to network technologies). All these markets will go to non-exclusive next year. I don't expect any change in the ASP as a result.

    The final data point comes from AT&T themselves when they revealed the price they paid for the iPhone was roughly the same as the ASP shown above.