Asymco

Asymmetric Intelligence

ASP

  1. The cognitive illusion that is iPhone n-1

    Research · 28 comments

    How do you think about the iPhone 3GS after the iPhone 4 is out? I have a hypothesis that it's not what it seems.

    The standard logic is that the 3GS (which I will call the n-1 where n is the current phone version) is a lower-priced leftover that covers a lower price point and expands the market.

    I think it's designed to give the illusion that the iPhone 4 is actually more desirable steering more potential buyers to the new (nth) phone.

    To illustrate I'm going to call upon the wonderful example given by behavioral economist Dan Ariely at the TED talks.

    Imagine I give you a choice: Do you want

    • (a) "a weekend to Rome, all expenses paid" or
    • (b) "a weekend in Paris, all expenses paid"?

    They are different but compelling choices. Perhaps a survey would find these two choices equally popular.

    Now imagine I added a third option to these two that nobody wanted:

    • (c) having your car stolen.

    It seems a strange choice, because how could having your car stolen in this set influence anything? Obviously (a) or (b) would be the only compelling options. But what if the option for having your car stolen was not exactly like this. What if the third option was

    • (a-) "a trip to Rome, all expenses paid but no free coffee with breakfast."

    Given that you can have Rome with coffee, why would you want Rome without coffee? It's an inferior option just like having your car stolen.

    But, the moment you add Rome without coffee as an option, Rome *with* coffee becomes more popular and people choose it much more often. Having Rome without coffee makes Rome with coffee seem superior, not just to Rome without coffee but even to Paris.

    Adding (a-) to the set of choices (a) vs. (b) makes choosing (a) much more likely.

    He goes on to describe a subscription offer from The Economist which, by inclusion of an inferior option, steered people to choose a more expensive option.

    My point here is that I hypothesize that the iPhone n-1 (Rome without coffee) is an inferior option to the iPhone n (Rome with coffee) and that it steers more people to choose iPhone n not just over iPhone n-1 but over the competition (Paris). Of course the inferiority of iPhone n-1 is offset by its lower price, but I put it that the difference of $100 is not that great in the eye of most users when they see the difference with the new model. The price difference does not make the iPhone n-1 look all that great. It's still Rome without coffee.

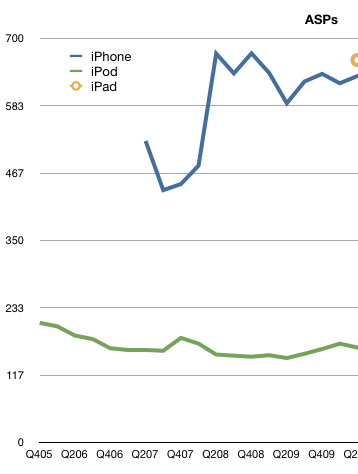
    We don't have precise stats to prove that iPhone n-1 is ignored as an option, but the ASP numbers never seem to drop. They seem to indicate that the overwhelming number of iPhones sold are the top of the line. Therefore the presence of an inferior option does not dilute the average selling price, but, in fact, increases overall volumes of the top product.
  2. It takes nearly $1 billion/yr to run iTunes

    Research · 44 comments

    In recent articles I highlighted the acceleration in iTunes App downloads where the rate is approaching 18 million apps per day and the cumulative total apps which is about to overtake the cumulative songs downloaded.

    We now turn our attention now to constructing the iTunes income statement: namely total sales, gross margins and deduce its operating budget.

    Gross Sales

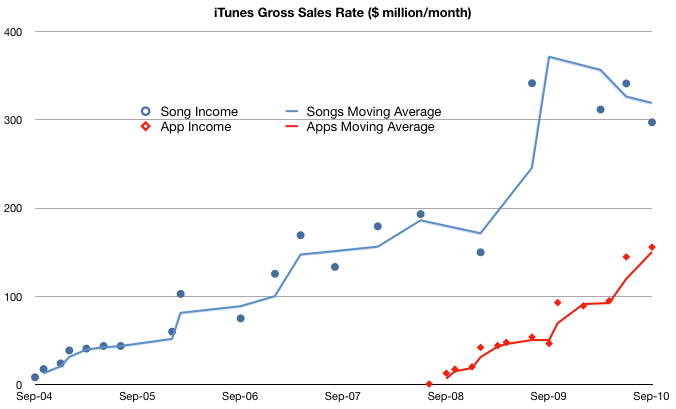
    To obtain the top line (income) for iTunes we need to know the average selling price (ASP) for songs and for apps. Apps are easy, we received that info in June: $0.29 per app. For songs, it was easy before early last year: $0.99/song. After the selective price increase, the blended price needs to be estimated. I chose $1.10 for 2009 and $1.2 for 2010. These are just assumptions and can be adjusted but should give us a rough estimate:

    I followed the convention of using income rate or $/month to show the history of sales. It shows that even with a price less than a third of the music product, apps are generating over half of the sales of music. In other words, apps are adding 50% to iTunes sales today. If the decline in music units continues and the app sales increase with the current trajectory then app sales value will overtake music sales next year, consistent with the cross-over of cumulative units sold.

    Gross Margin

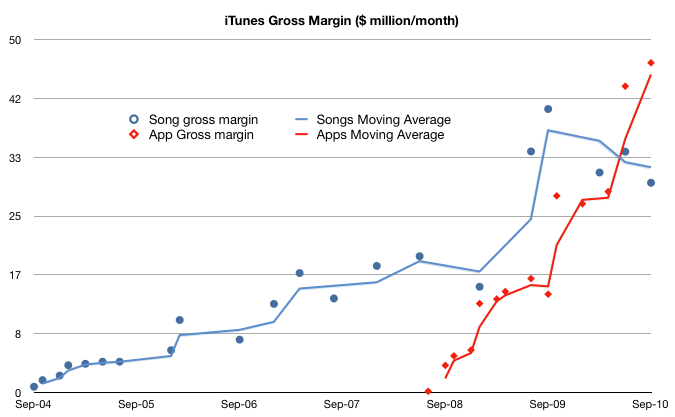
    If we know how much Apple pays music licensors and developers (i.e. cost of goods sold) we can calculate how much it keeps for operations (gross margin). Apple's app margin is 30 percent. The music margin was never official but the consensus has been 10 percent for a while.

    Using these figures, we get the following chart:

    This shows that what is left after paying the content license, Apple "keeps" about $50 million every month to run the App store (iTAS) and another $30 million to run the Music store (iTMS).

    The Operating Budget

    Apple has made a point of saying that both iTAS and iTMS are run at "break even" implying that the gross margin is used up in operating costs (CAPEX, R&D, SG&A). To be sure, the cost of bandwidth and the data center(s) needed must be considerable.

    But the operating budget for the store is beginning to reach a level that may be beyond what can be spent reasonably. The amount left over for operations has increased from ~$30 million a month in 2009 to $75 million/month today.

    In fact, if this burn rate is maintained (even though it's increasing) the operating budget for iTunes is nearing $1 billion/yr.

    I'm not an expert on the cost of operating data centers but $ 1billion a year seems like a lot. I would love to see an analysis of how this could be allocated.

    Implications

    I would also add that because of the increasing mix of apps, the overall gross margin percent is increasing. I estimate that to be a blended 17%--a healthy margin for a content store--and an increase from 10% before the app store came online.

    Finally, one implication of the economics involved is that a budget like this may provide a significant barrier to entry for any competitors looking to take on the iTunes juggernaut. iTunes has reached content critical mass (12 million songs), user base (160 million users) and wide distribution (23 countries for songs and 80+ countries for apps).

    These are non-trivial operational issues that even the best in the "cloud" business models will find challenging.

    Footnote:

    This discussion excludes video sales, rentals, book sales as we don't have solid histories for these product lines. However, we can do a spot check on the cumulative totals:

    • 450 million TV episodes downloaded implies $1 billion in sales.
    • 100 million movies downloaded probably adds at least another $1 billion
    • 35 million books adds another 500 million.
    • Compare with 11.7 billion songs at ASP of $1 for about $12 billion in song sales and 6.5 billion apps at ASP of $0.29 or about $1.9 billion.

    iTMS content downloads have generated $16.4 billion in sales to date.

  3. HTC: How They Compare

    Research · 17 comments

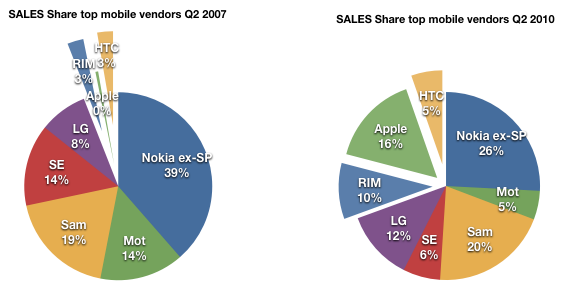
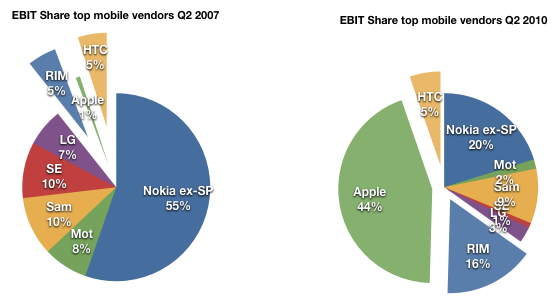
    In the last mobile market update series I wrote of  the evolution of market share, the shift in where dollars are spent, the tale of ASP erosion, profitability ratios over time and EBIT share over time.

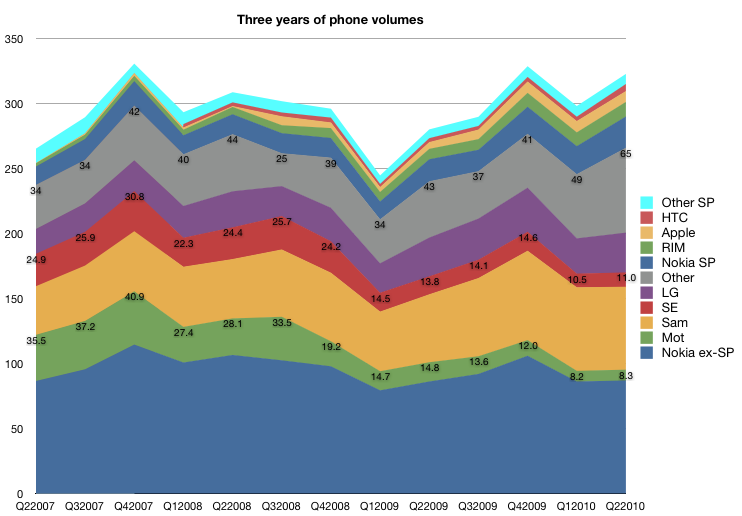
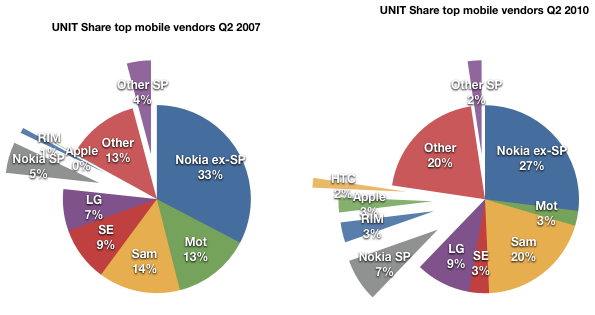
    I did not include all vendors for various good reasons. The first survey (market share) did include an "others" category that made the volume data complete, but in the financial data sets, I chose to include the top 7 vendors that make up 80% of device volumes.

    One noteworthy vendor that was not included was HTC. HTC is an important vendor for several reasons:

    • it's a pioneer in smartphones having made the first Windows Mobile devices and the first Android devices
    • at one point it sold 80% of all Windows Mobile devices
    • even if it did not brand its devices, it was the name behind many re-branded or white-label operator branded phones
    • it has a brand of its own today and is expanding its reach

    HTC has been around building devices since 2001 and so it would be a pity to exclude them from any analysis of the effect of iPhone on the market or any discussion on the effect of smartphone disruption on feature phones.

    The challenge with HTC was that historically their branded devices and white label devices were not reported by the company separately. This matters because white label devices are valued differently. Typically these devices are not marketed by the original manufacturer so SG&A is not applied to their cost base. Operating margins, ASPs and hence profitability is not directly comparable with other OEMs.

    But HTC has recently changed its reporting. Thanks to a reader I discovered that, since 2008, HTC has been listing its ASP and Operating Margin making direct comparisons possible. I still don't have all the data, but enough to add HTC to the analysis.

    So, here are the 5 industry performance criteria, now with eight vendors listed.

    Volumes

    Note that HTC volumes start in 2008.

    The volume of units HTC sold has been increasing at about the rate of market growth.

    As a result, HTC's share has not increased as dramatically as those of the other smartphone entrants.

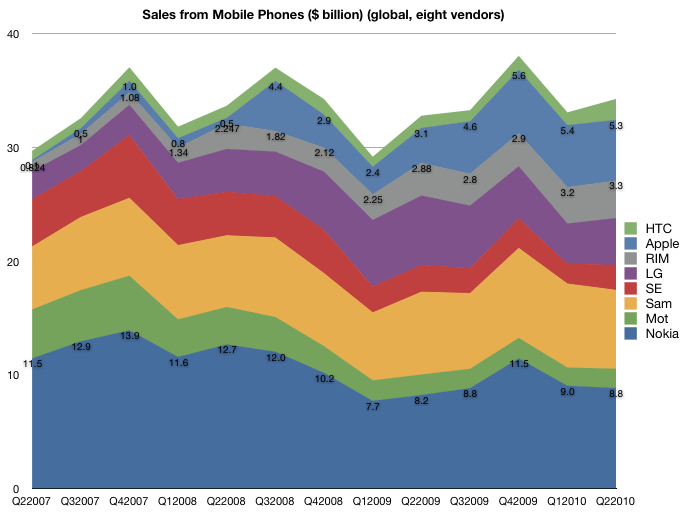
    Sales

    A similar story in the sales picture. Although a consistent performer, the growth has not matched that of RIM and Apple.

    ASP

    The pricing story is also a mixed one. Although HTC lies between RIM and Apple in price, the erosion is more consistent with RIM and the rest of the industry.

    Margin

    The margin story is also not as positive as one might expect. The margins for HTC started out above Apple and RIM but have dropped to closer to industry average. This is not what one might expect from an exclusive smartphone vendor.

    Earnings

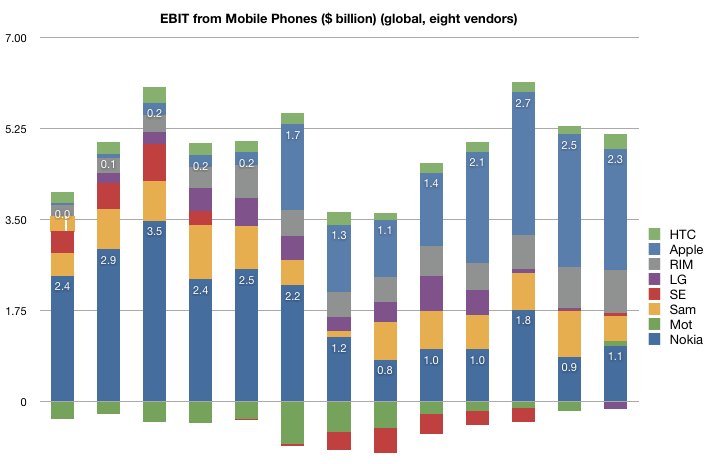
    The share of earnings has remained unchanged at 5% over the period of iPhone presence. It's perhaps a credit to HTC that they did maintain their position in the market with the massive change that has come to pass.

    However, here we also have to ask if HTC is riding a disruptive wave.

    When I wrote the last series, my definition of “loser” was a company that had faced a long series of operating losses and has no viable software assets of its own, making it vulnerable to Android (and Windows Mobile). Motorola first, Sony Ericsson second and LG now coming into the picture. Nokia is not a loser in this sense since it has remained profitable and does maintain an investment in software. Same with RIM and Samsung (now with Bada). When/if they do have the near death experience, they might opt for the Android lifeline (flimsy as it is).

    However HTC does not fit the mold of either "winner" or "loser". It's the Goldilocks company, not too hot, not too cold.

    But I would add that HTC is not an example of a winner because of its adoption of Android. HTC’s dependence on Windows Mobile made their move to Android the most desperate of all. Unlike the larger OEMs, who had their low end devices to fall back on, they are completely dependent on a smartphone OS vendor. When WinMo was showing the first signs of crisis in 2007, they were the first to flee to Android (think of why they would risk the wrath of Microsoft for something so fragile as Android in 07). They are also trying hard to escape the dependence by building up their own UI (SenseUI) and I would not be surprised if they move to their own OS in the future. Being associated with Android does not confirm them as "winners" but in fact, shows their vulnerability.

    What does this all say about Android?

    Again here my thesis is that Google chose to sustain the industry rather than try to upend it. I don't judge their motives, but the fact is that with Android, Google is not in a position to disrupt telecom. There were high hopes dashed with the Nexus One and hearts broken with net neutrality and now there are patent wars to be fought. Android, with its licensees, is still at the mercy of operators.

  4. Phone incumbents' average operating margin: 4.5%. RIM and Apple: 34%

    Research · 10 comments

    After ASP, Sales, and Unit Volumes we look at the three year history of operating margins for the seven most significant mobile phone vendors (Nokia, Samsung, LG, Motorola, Sony Ericsson, RIM and Apple).

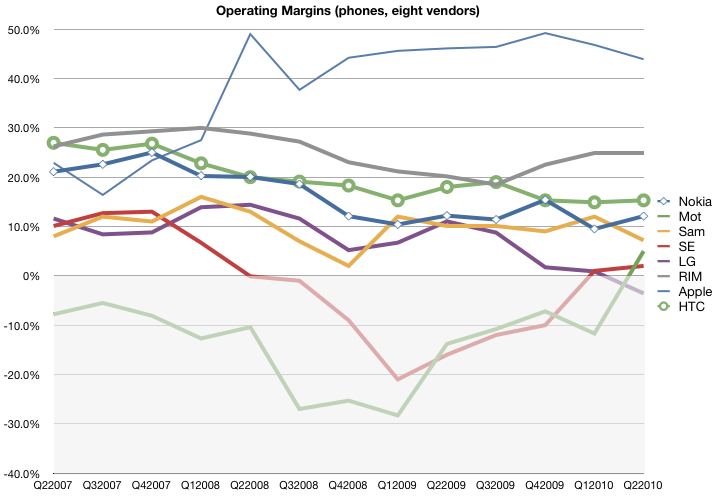
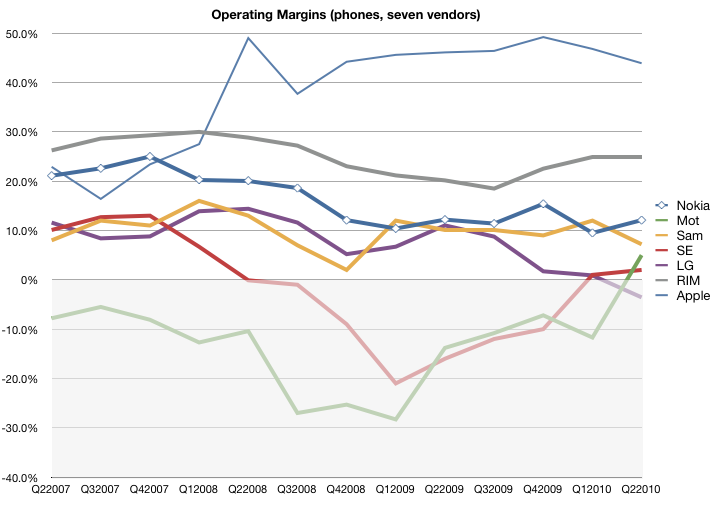
    The following chart shows the OM from mobile phone sales. These figures are as reported by the companies with the exception of Samsung and Apple. Samsung reports OM for its telecommunications unit as a whole and we have to assume that it's largely accurate for mobile phones. Apple does not report margins for its iPhone but it's possible to estimate gross margin percent for the iPhone and then subtract its overall OPEX as percent of sales. This assumes that OPEX is allocated to the iPhone in proportion to sales, which is the best assumption we can make at this time.

    The data shows that the iPhone has been considerably more profitable, due mostly to a high ASP, than other vendors. Motorola and Sony Ericsson have been "underwater" with respect to margin for much of the time period, with LG recently dipping into the red.

    Nokia's margin erosion is a source of significant angst but note that it has just reached Samsung's historic level (around 10%). LG, long seen as an up-and-coming vendor who took over the number three spot from Motorola is shown to have done so with moderate-to-low profit margins.

    Overall, the phone incumbents have an unweighted average operating margin of 4.5%, down from 8.6% three years ago. In contrast, RIM and Apple have an average OM of 34%, up from 24%.  In other words, profitability has halved for the volume leaders while it has increased nearly by half for the entrants.

    This goes a long way toward explaining the "smartphone gap" which is being filled by Android. As vendors see their unit growth, ASP and operating margins under pressure from low end disruptors, there is a tendency to flee to the high end that smartphones represent. Android offers an irresistible siren's song.

  5. Is an iPhone worth 8 Nokia phones or 2 Blackberries?

    Research · 4 comments

    Pricing is a leading indicator of value. Some might argue price and value are often out of whack but, in the long term the two converge.

    So it's instructive to measure how a vendor creates value by what it's able to charge for its goods. In the case of mobile phones, price is summarized by something called ASP (average selling price) which is measured each quarter across a vendor's entire portfolio.

    Again, there might be local fluctuations, but the trend is your friend here.

    Take a look at these charts I prepared based on the group of seven vendors I previously analyzed in terms of their sales and volume performance.

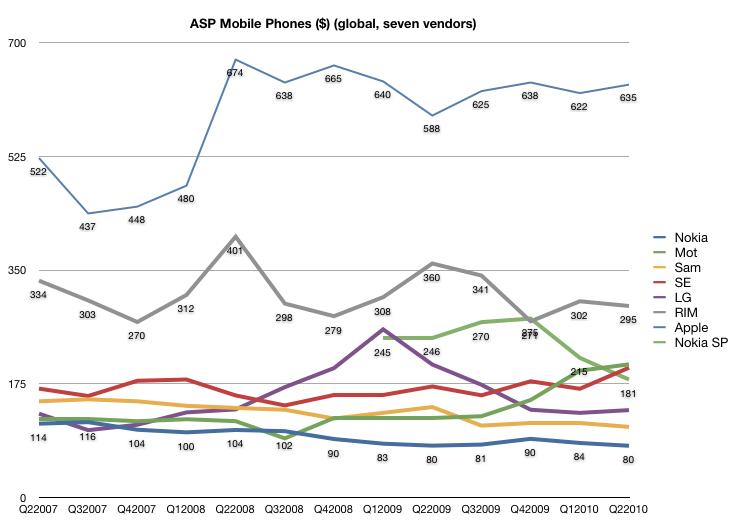
    First, a history of pricing since Q2 2007. All figures are in US dollars current as of time of reporting.

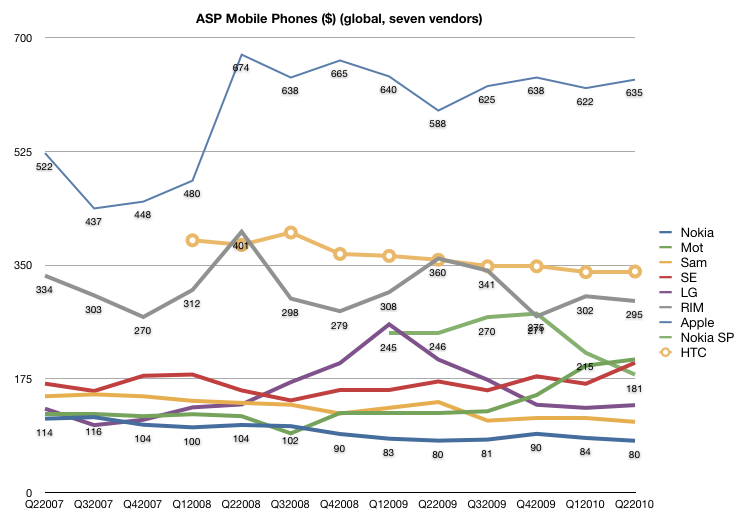
    Here we see the ASP erosion inherent in the large incumbents with Nokia and Samsung both seeing price slides. LG went through a phase of price growth but has returned to a point near to where it started three years ago.

    While Sony Ericsson and Motorola were following the downtrend until 2008, they reversed and began an ASP climb while fleeing upmarket (at the expense of volumes).

    Finally we have RIM and Apple both holding the line on pricing while growing volumes. Not only are the lines steady (with Apple slightly increasing and RIM slightly decreasing) but they are way above their competitors; Apple's shockingly so.

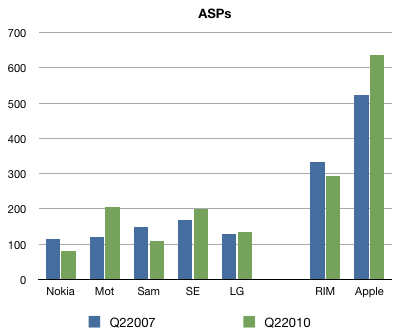
    Here is the before-and-after view:

    During the three year window we're looking at, Apple and RIM showed ASP durability while incumbents showed ASP erosion.

    Pile these data points on top of the volume and sales data and we can move forward.

    (In answer to the question in the headline, the answer is: Yes.)

  6. The deterioration of Nokia's core business

    Research · 5 comments

    The saga of Nokia's challenges has been well documented in this weblog.

    For this quarter, we take a look at the sequential deterioration in Nokia's bottom line and draw causal inferences to its lack of competitiveness in mobile operating systems.

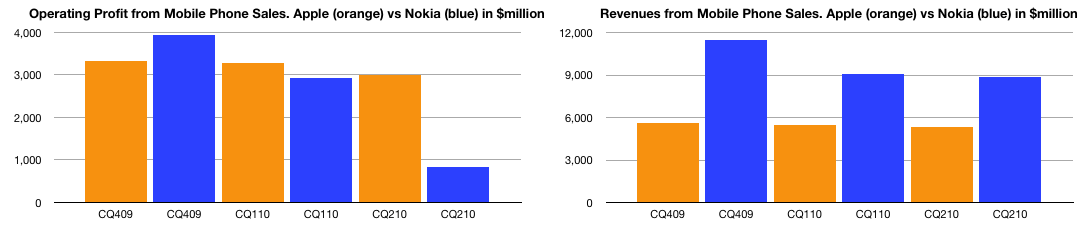
    First, the bottom and top lines are shown below (in blue) and compared with Apple (in orange):

    The charts show how Nokia's bottom line (left) collapsed while the top line (right) remained relatively solid. By comparison, Apple remained consistent in revenue with slight dip in profit as it transitioned to a new model.

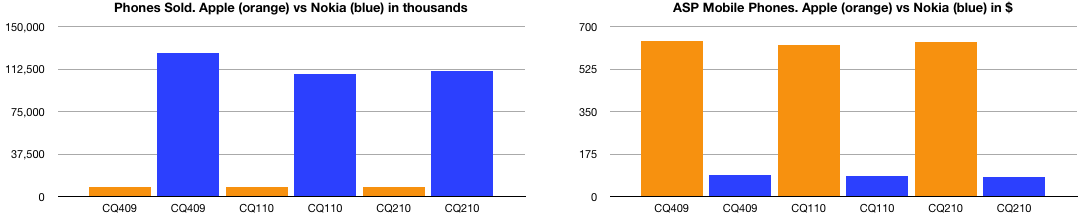
    The top line (sales) is the product of units sold and their average selling price (ASP). Here are these two quantities side-by-side:

    Note how Apple's units are hard to discern relative to Nokia's volume and how the opposite is true for the selling price. These values include all phones sold by the companies.

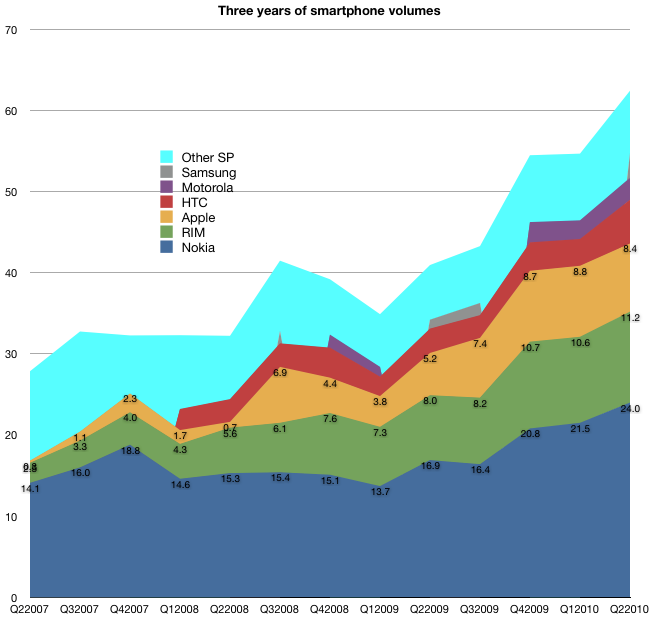
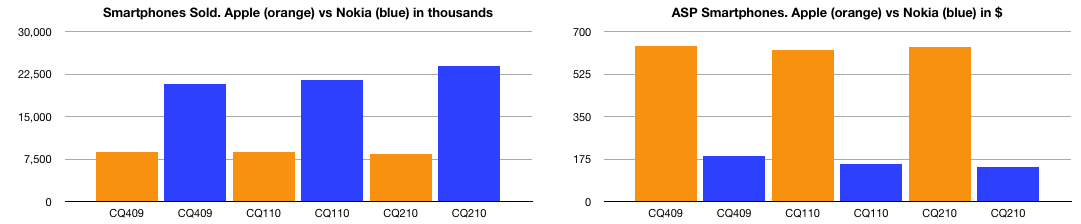
    The story is a bit more clear when comparing the smartphone part of Nokia's business, again with units and ASP:

    The story here is telling: even in smartphones, Apple's ASP is dramatically higher and much more resilient.

    The question has to be why: Why can Apple retain not only higher prices (and hence margins)? The answer is competitiveness. Margin is an indication of value created and value differential is competitive differentiation. All the user satisfaction surveys, the reviews and tests boil down to these hard numbers above. The deterioration of Nokia's business is directly traceable to its historic failure to embrace mobile software as a disruptive force and instead using it to sustain a hardware business.

  7. 3Q review: The iPod revenues increase again

    Research

    The iPod touch increased sales 48% year-over-year.  The continuing mix shift toward iPod touch resulted in an overall iPod ASP increase of 12% to $164 (up from $143) generating total iPod revenue growth of 4%.

    Units declined 7.9%, inline with my expectations of -8%. I had forecast 9.40 and the actuals was 9.406 million. I note that most amateur analysts over-estimated iPods with my guess being the second lowest.  It's important to consider just how much the iPhone (and iPad) cannibalize the non-iOS iPods.

    I am estimating gross margin holding steady at 28%.

    Looking forward I am forecasting ASP of 170 and unit growth of -8%.

    I'll also mention here the Music business.  Revenues grew at an accelerating 26.7%. This growth is a significant rebound from the 15% to 22% growth of 2009 though lower than the 30%+ range of 2007 and 2008.

  8. 3Q review: Mac units grow 33%

    Research

    Apple Reports Third Quarter Results.

    I was surprised by the poor predictions of Mac units by the analyst community with estimates ranging from 2.86 million to 3.51.  It was fairly clear to me early in the quarter that the product would get 30%+ growth.  There was little news except overall Mac momentum to shape the forecast and it seemed logical that the growth would stay inline with the last quarter which was 32.8%. I dialed in 33% after the first month and stuck with this so my forecast came out to 3.46 million.

    In the event, 3.472 million were sold for a growth of 33.4%.  The ASP came in at $1,267, slightly down from $1,278 last quarter and $1,289 the year before. ASPs are eroding but Apple are holding the rate down with product updates. Looking forward, I'm forecast $1,300 ASP.

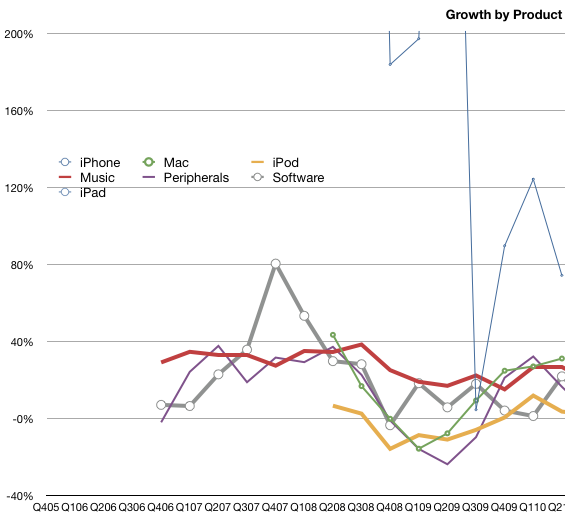
    I estimate gross margin for the Mac at 27%. This is down from 31% a year ago. Revenue growth year-on-year was 31%.  The Mac  franchise is still doing better than most PC vendors and is gaining share. The graph below shows the growth by product revenues.  The Mac is now the second fastest grower after the iPhone (the iPad is not included yet as these are y/y growth rates.)

  9. 3Q review: iPhone revenues grow 74%

    Research

    Calling the iPhone this quarter was going to be a challenge. This was a transition quarter where an old lead model would be replaced with a new one. The launch of the iPhone 4 was going to affect the volumes, but nobody could predict how. We've had a few such quarters and they were volatile. The number of sales days varied and the distribution of the old product was much different. The problem was compounded by the leak of the prototype and the uncertainties of launch day logistics. My forecast had been 8.5 million units.

    In the event, 8,398,000 iPhones were sold. This included 1.7 million iPhone 4s which means about 6.7 million 3GS phones sold. That's quite remarkable given the end-of-cycle timing.  8.7 million 3GS were sold in Q2 which means the sell-in was down only about 2 million for the transition.

    The even more remarkable story is the average selling price. It came in at $635.15. The iPhone has ranged from $437 to $674 ASP over the last three years (see chart). This figure places it near the top of the range, a great performance for the end of a product cycle quarter.

    I estimate gross margin at 56%, a drop from the more typical 60% due to iPhone 4 launch. With revenues of $5.33 billion and cost of sales of $2.2 billion, Apple created operating profit of $3.13 billion--we'll take a look at that number relative to other vendors later.

    Growth year-on-year were 74% for revenues and 61% on units. For a transition quarter, these numbers are spectacular. For comparison, during 2009's transition quarter (Q4) revenues grew at 5% and units 7%. Furthermore, according to Apple's management, iPhone unit sales in the June quarter were running 90% above the year-ago period prior to the company draining thechannel ahead of the iPhone 4's release. In the December and March quarters, unit sales were 100% or more above prior-year results. This means that 100% growth is sustainable though going forward I'm keeping forecast at 65% growth.

    Seventy percent revenue growth cannot be seen as anything other than a sign of rude health.

  10. iPhone 4 ASP is $600

    Research · 2 comments

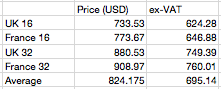
    As a footnote to the unlocked iPhone 4 story, it's worth noting that the average Apple store pricing for UK and France is around $824 (assuming equal blending between the two countries and between the two models).  Excluding corresponding VAT leads to an approximate ASP of $695.

    Operators probably get a slightly better price so my estimate for the iPhone 4 ASP of $600 seems reasonable with potential upside based on product and regional mix.