Asymco

Asymmetric Intelligence

cash

  1. The thermodynamics of Apple's share price

    Research · 82 comments

    Andy Zaky at Bullish Cross wrote a great post on Apple’s valuation, showing the deep discount of Apple's earnings vs. an average company. It essentially states that Apple's money is not green.

    Felix Salmon took it forward by enumerating a few explanations that might be used for the despondent valuation. None are successful arguments, but that should not be a surprise.

    To understand the phenomenon a bit more precisely, I maintain and think about these charts:
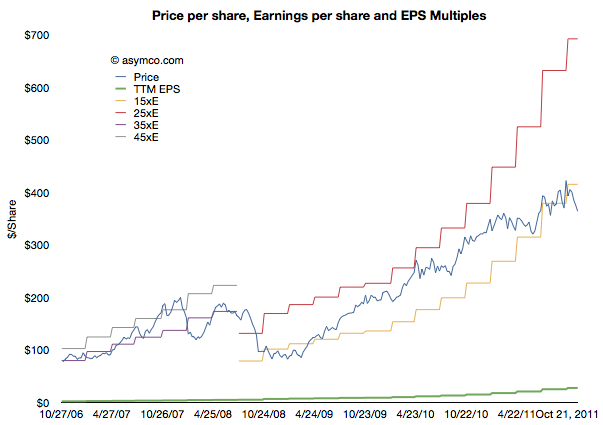
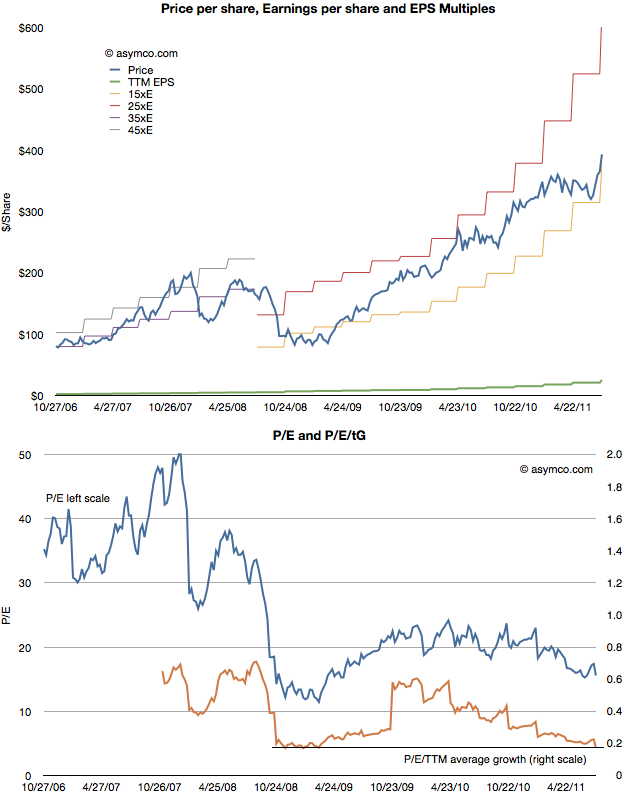
    This shows Apple's share price ("P" in blue) and its earnings per share ("E" in green). In addition there are multiples of the earnings in "bands". The first band is 35xE to 45xE which bounded the price during the period of 2006 through most of 2008. The second band is 15xE to 25xE which bounded the price since then. The data is updated weekly so it is current as of last Friday.

    Illustrating it this way shows how the stock is seen as representing different companies at different times. The 2006 era (iPod) Apple was seen as a high growth, dynamic company with loads of headroom for growth. The current (iOS) Apple is seen as a slow growth, fairly static company with most forecasts showing 20% growth potential.

    Note that the price has dropped outside the current band for the first time since the great recession. It is still below 15xE today. Perhaps a new band is forming.
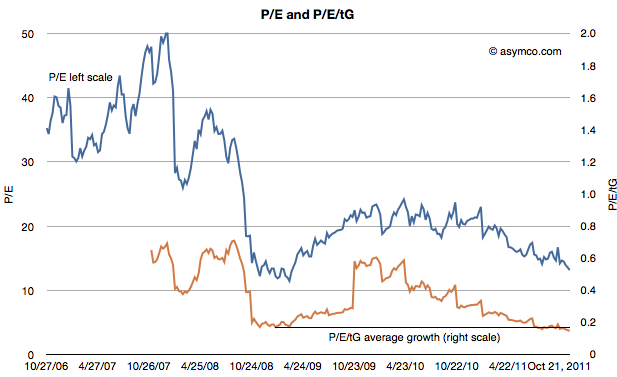
     

    The second chart shows the P/E on its own (in blue) but with a second measure where the P/E is divided further by the average trailing twelve months' growth (P/E/tG). This is a variation on the P/E/G (aka PEG ratio) where instead of (mostly wrongly) estimated future growth I use actual growth history--hence the t for trailing. The P/E/tG is a way to normalize P/E as a function of growth and hence a more appropriate index of value potential.

    I added a horizontal line to the chart to show the minimum value P/E/tG reached during the recession (0.17 in January 2009). As you can see, the P/E/tG is now lower than at that time (0.15). It implies a deeper discount for the company's earnings growth than during the time when the world faced economic contraction.[1]

    Note also the trend of that line as it shows a steady linear path toward zero.

    Of course, it cannot reach zero unless Apple files for bankruptcy. But until it does file, the line can only reach zero asymptotically as E/tG increases. Which is a relief, I suppose, as it means the rate at which P/E/tG drops will decrease. This implies that as earnings growth persists, the drop in price will have to moderate.

    The other threshold to keep an eye out for is when Apple's share price will reach its cash per share. That's the point when investors will consider the company to be a net value destroyer. If you performed that analysis in January 2009, and you were accurate about earnings forecasting, the answer would be well before today. See the following chart:
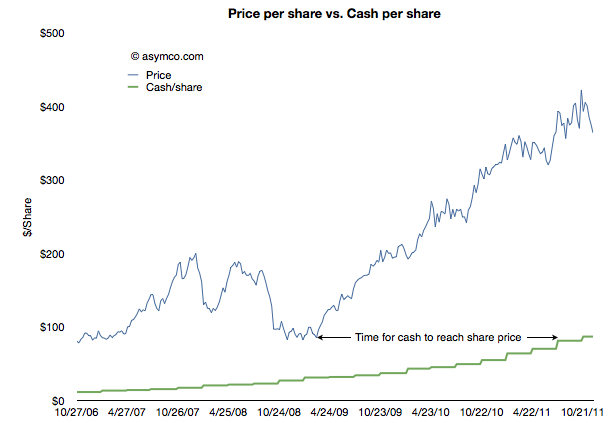
    In other words, in January 2009 the stock was trading at a price (<$80/share) below the current cash per share (>$85/share). It took Apple 18 months to grow its cash to reflect the price set on the company. Had the stock not risen then the company would today be trading below book value.

    The amazing thing is that today the valuation structure (P/E/tG) is even worse than in it was January 2009. An interesting exercise would be to project how long it would take for the cash to increase to the current share price.[2]

    I imagine this time interval should have a name. How about the time to boil: the time for growth pressure to become sufficiently high to exceed disbelief that growth can happen.

    ---

    Notes:

    1. Note that the low values were placed on the company after the crisis took hold, not as an anticipation of contraction. See the behavior of the index during the summer of 2008 as the credit crisis was unfolding.
    2. This analysis is consistent with the analysis that Apple is not valued on earnings or earnings growth but on its balance sheet. The ratio of Price/Cash has been fairly constant but if it breaks down (as it has been--see below) then we need to assume a new dynamic is in place. 
  2. Apple could buy the mobile phone industry | Updated

    Research · 84 comments

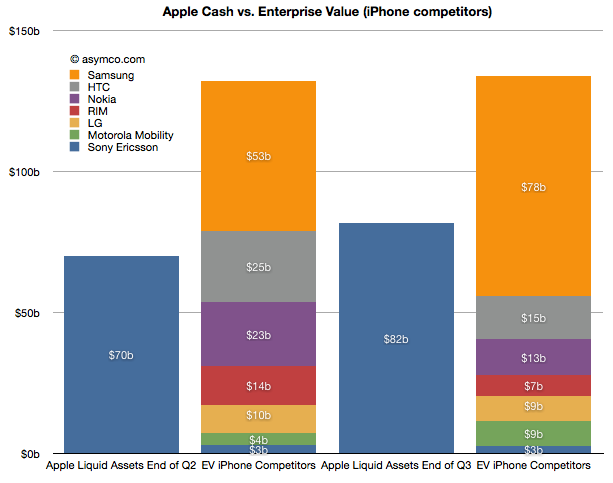
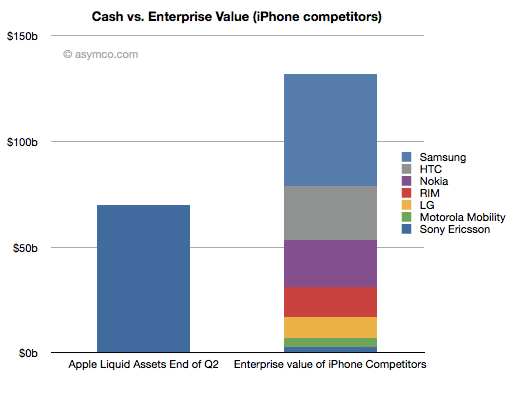
    The last time I did this comparison (Apple could buy the mobile phone industry | asymco) was in June after the end of the second quarter. The following chart is an updated look.


    Here is a discussion of the changes since the last analysis:

    • Sony Ericsson was valued through its acquisition by Sony. We did not have a way to value the enterprise before as it was not traded independently. Last June I estimated a 14x multiple on its trailing twelve months' profits and got $3.0 billion. Since then half the company changed hands for about €1.05 thus yielding a total company value of $2.8 billion. The enterprise value should be therefore slightly lower but I'll stick with the current transaction value as the EV.
    • Motorola Mobility has entered into an agreement to be acquired by Google for $12.5 billion by Google. The company's enterprise value jumped as a result to about $8.6 billion.
    • RIM's share price collapsed and it's now also trading at an EV of about 7.3 billion (Yahoo finance).
    • Nokia's price has also dropped and it now has an EV of about $13 billion (Yahoo finance).
    • HTC recently dropped significantly in price and is now worth about $15 billion EV. (Note that pricing of its equities is subject to suspended trading due to drop limits).
    • LG's phone business is still losing money and it's still difficult to value. In November it was revealed that the company was seeking to raise $890 million in capital to fund new initiatives including smartphones. The share price fell by 14%. In June I suggested a nominal value for the phone business of $10 billion. I think that's very generous and with recent events I would place that value at $9 billion today.
    • Samsung's fortunes have increased. In June I applied a 14x multiple to their trailing 12 months' operating earnings. Given overall discounting of the sector I applied a multiple of 13 today. That yields a business value of $78 billion. Interestingly, that is larger than the value of all other competitors apart from Apple. That also makes it six times more valuable than Nokia.
    • Apple's cash and cash equivalents and investments grew by about $12 billion and were worth about $82 billion as of October.

    In summary, in June Apple's cash was about 53% of the sum of competing phone vendor enterprise values. Today it's about 61%. Excluding Samsung, Apple could buy the industry and still have $25 billion left over. This makes the claim that "Apple could buy the industry" even more believable.

    This analysis is mainly academic. It does not imply that any such transaction will take place. As the purchase of Motorola shows, control has a premium and individual buyers may be less "rational" than markets. What it does show however is that the entire industry is in a state of crisis. Valuations for phone companies are collapsing and two major brands (Motorola and Sony Ericsson) are being absorbed and could disappear.

    At the same time entrants are arriving with completely different business models. Amazon, Facebook, Baidu, Alibaba are intent on selling phones or platforms to be valued as enablers for asymmetric business models rather than as phones. One could argue that what Apple itself sells is more than hardware and that its value-add "on top" of hardware is increasing. This is a sign of commoditization. Certainly the voice business is well beyond that point but it now appears that even the smartphone business is already in an advanced state of value compression.

    All the while the overall market is growing. I had separately looked at the profit pool and concluded that the brands are suffering. Summing up the votes from stock markets, the sentiment is even worse. 2012 is looking more and more as a year of inevitable and dramatic industry change.

  3. Apple's Residual Enterprise Value is less than 7x Earnings

    Podcast · 70 comments

    In his third “The Critical Path” podcast, Horace Dediu explained how Apple’s cash can be viewed as a strategic option, an opinion that resonated also with other analysts [1]. Cash is one of the most flexible resources as it can convert quickly into other resources such as brands, companies, technologies, people and even processes. More cash means more strategic flexibility. The large cash reserve Apple has accumulated provides high flexibility for future investments. These characteristics of cash already imply an intrinsic option value. But how big is this value?

    Calculating Option Value

    To help us determine, I will apply the Black-Scholes model. The model has two key characteristics that are applicable to valuing the option character of Apple’s cash. First, the simple form of the calculation excludes dividends and, as far as we have seen, there is no new information available that would suggest that Apple will pay dividends in the near term. Second, it implies that the option can be exercised at any given time until the end of the option exercise period - just like any buying or investment decision made by consumers. Lastly, we will assume that Apple’s cash (including short-term and long-term cash as well as financial investments) is instantly available. Although large amounts are held by foreign subsidiaries or are invested in maturities longer than one year, we can overcome these practical issues by borrowing against it. As we are interested in the value of the whole pile, we use the latest reported figure of $81.6 billion as the strike price (or exercise price).

    What other inputs do we need to determine the option value of Apple’s cash [2]?

    • Volatility: A measure that determines financial risk of a certain asset. Apple’s share has shown a volatility of 26,1% over the last year.
    • The risk free rate determined by the 10 year US governmental bond interest rate: 1,96%.
    • A timeframe in which the option can be exercised. Let’s assume a 10 year timeframe in line with the risk-free rate and an imaginable horizon for mere mortals.
    • The value of the underlying (or what Apple is investing in):

    The return of the investment exercised with the cash at hand should yield a higher Return on Capital Employed (RoCE) than previously achieved to increase shareholder value. On the other hand, such a high cash pile also provides the flexibility to invest into lower return ventures. Such an investment would be taken if a certain technology or trend has been missed by management or becomes suddenly more important in the priorities of the company. In defensive moves or moat creating ventures, the expected return would be significantly lower or can even be negative. For the last twelve months, Apple has returned 106% in terms of operating income over its capital employed [3]. I use the return to value the underlying. For example, investing $81.6 billion in assets that yield 106% return equals a underlying value of $168 billion.

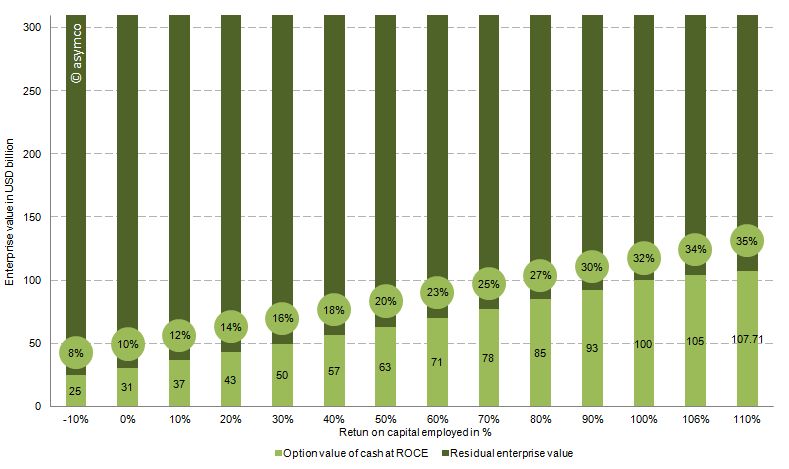
    The chart below shows the option value of the cash as a percentage of enterprise value of Apple (at the time of writing $310 billion) based on the range of the expected return on capital employed. Or in other words, how much of Apple’s current value is explained by the option value in holding such a large cash reserve.

    Conclusion

    Therefore, with the assumptions above and a RoCE from -10% to 110%, between 8% and 35% of Apple’s current valuation is explained by the option value of cash. We can see that even with large variations of the key input variables, Apple’s enterprise value is partly explained by the option value of cash which, in turn, is attributable to the sheer amount of cash at hand.

    If we look at the option value explaining 25% of Apple's enterprise value then 75% or $232 billion is the "Residual Enterprise Value" (REV) representing the value of Apple's cash flow generating operations. That puts Apple's valuation at 6.9x REV/EBIT 2011 or 6.5x REV/EBITDA 2011 -- fairly low relative to recent performance. EBITDA and EBIT have been growing at a rate of 70% for the last two years and at a rate of 84% over the last year alone.

    1. It’s good to be king (http://5by5.tv/criticalpath/3) , Apple: Behold The ‘iEndowment,’ Says Wedgewood (http://blogs.barrons.com/techtraderdaily/2011/09/20/apple-behold-the-iendowment-says-wedgewood/)
    2. For more information regarding option pricing see http://en.wikipedia.org/wiki/Option_(finance)
    3. Operating income of the last twelve month of 33.8 USD billion divided by capital employed of 31.8 USD billion defined as total assets minus cash (or sum of all asset excluding cash)
  4. Putting capital to work

    Research · 30 comments

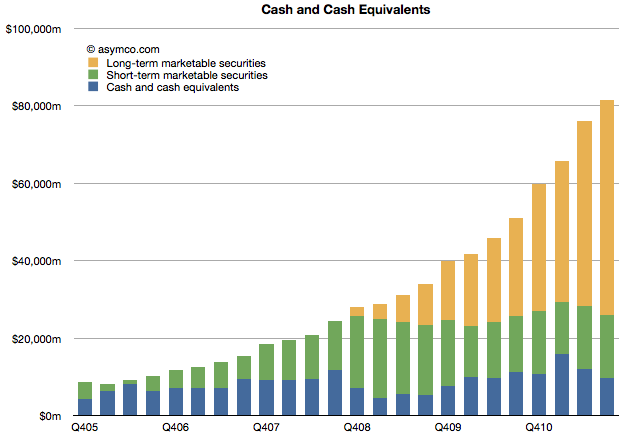
    Apple's Cash and Marketable Securities has been the focus of attention for many year now. It has now reached $81.6 billion equivalent to a value of $86.8 per diluted share. Currently each share is worth about $393 making the enterprise value $306/share or 11 times last twelve month's earnings.

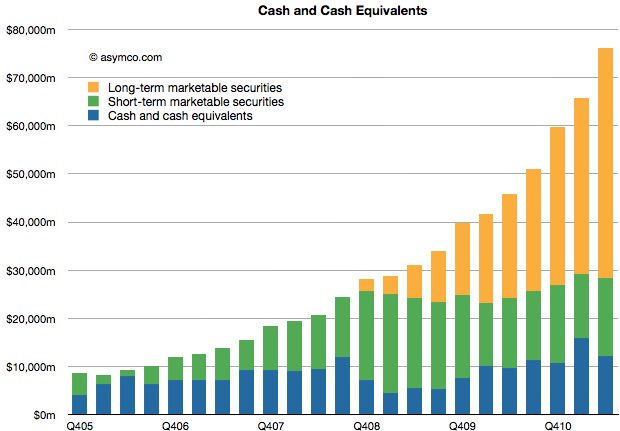
    The division of liquid cash and cash equivalent asset types is shown in the following chart.

    The company added $5.4 billion to its cash reserves during the quarter and now keeps two thirds of that outside the US. Long-term securities (bonds mainly) are now also about two thirds of total. Both of these ratios have increased this year. Some of this shift may be explained by changes in the strategy employed by the CFO/treasurer, but there is another set of assets that has changed dramatically and may explain the change in cash allocation.

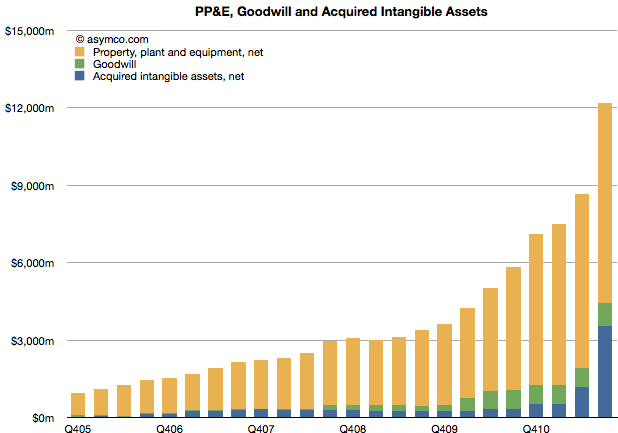
    I've written about the PP&E assets and their dramatic increase, but the "Acquired intangible assets" have also had a huge increase in the last quarter ($2.3 billion). Much of that is attributed to the acquisition of Nortel's patents.

    Unlike cash, these assets can be considered an "investment" by the company. They are expected to (but may not) return value to shareholders in excess of the average cost of capital. Therefore, they demonstrate that some of Apple's capital is being "put to work" rather than resting idle as many suggest. Apple is buying patents and companies and intellectual property. $12 billion worth so far.

    Whether they will be a good investment, we cannot tell, but the allocation of capital to non-cash assets is already significant and has grown more quickly than cash. They have, in fact, more than doubled in a year and quadrupled in two.

  5. The down payment on iCloud

    Research · 96 comments

    Balance Sheets are not typical targets of focus in software or services or "high tech" companies. Except for Cash, there are usually not much in terms of assets for analysts to contemplate. With outsourced manufacturing, even hardware companies don't maintain depreciable assets on their books.

    Apple, as usual, is different. It turns out there is a lot there and there's a lot to learn from what's there. I've looked at the Cash and Long Term Securities in the past but in the next few posts I'll dive into fixed (non-current) assets. Specifically Apple's Property, Plant and Equipment.

    Apple Inc. has selected North Carolina as the location for a new data center and will invest more than $1 billion in the project over nine years, Gov. Bev Perdue announced

    via It's Official: Apple iDataCenter to North Carolina » Data Center Knowledge.

    When Apple committed to the North Carolina data center in mid-2009 the iPhone was two years old. Only 26 million iPhones had been sold to date (about as many as Apple now sells every quarter.) Clearly if the commitment was on such a scale there must have been a plan. A big plan.

    We don't know for sure if NC was used last week or whether it was handling only part of the load, but let's assume it was. What I want to think about is how much iCloud would thus cost and hence what would be the cost for alternative providers of such a service. That analysis might let us determine if "cloud" forms a substantial barrier to entry for competitors.

    Beside the public statement above (which may have been designed for political benefit) can we find any evidence of what Apple spent on data centers? That's where the PP&E line comes in.

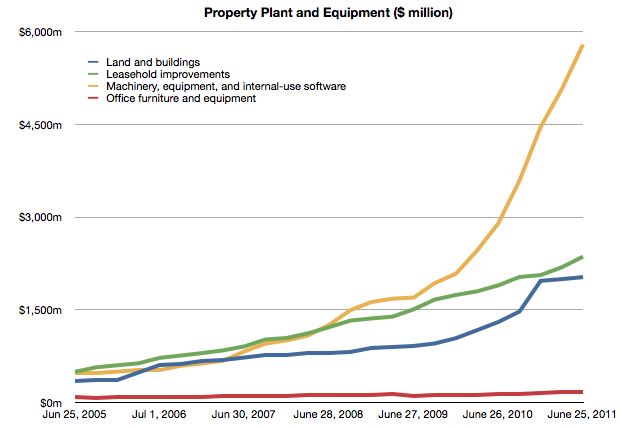
    The following chart shows the Property, Plant and Equipment asset in Apple's Balance Sheet.


    Each line represents a particular type of asset and its value at a particular point in time. I will now pay attention to the blue line, Land and Buildings. I'll look at the other lines separately.

    Note that each line represent current value so it does not say directly what was happening in the quarter. However, if we look at the change q/q for a particular line we get how much new spending occurred in the quarter for that particular asset.

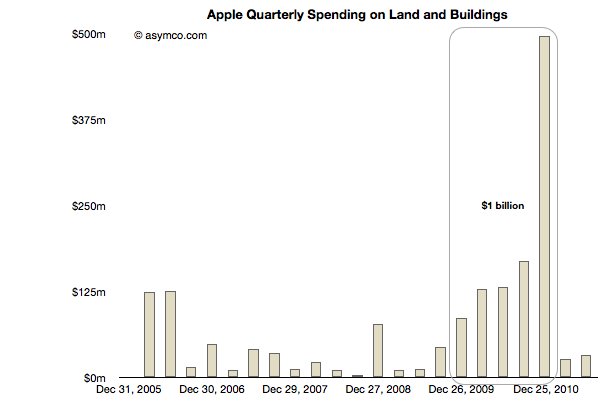
    This change in Land and Building asset value is shown in the following chart:

    Going back to 2005, there were minimal changes. Perhaps there is some significance in the $250 million spend in early 2006 or the nearly $78 million spent in Q4 2008, but there is a definite significance to the massive spending that occurred right after the NC commitment was made.[1] Some of that payment also included the old HP campus in Cupertino. "Local real estate experts said HP’s asking price may have been $300 million or more, but they also said the final amount may have been less."

    There is also a clear cut-off on that spending at the end of 2010.

    The total spending during this time adds up to nearly exactly $1 billion. If we subtract $250 million for the Cupertino expansion we still have $750 million that must have gone into NC.

    Note that the original statement quoted above was $1 billion over nine years. We can see that Apple spent $0.75 billion in one year. On the building alone. This is why I consider this a down payment. It does not include any of the equipment in the plant. It does not include the cost of operation (incl. labor) or any development costs (R&D). In fact, it does not include any of the funds that would be part of the nine year commitment.

    What this level of spending implies is that iCloud (and Siri and iTunes) are expensive. They may seem ephemeral and even trivial as services, but they require a staggering commitment few can make. Apple made that commitment and they made it early on, before the first quarter billion users were even on the horizon.

    If platforms are moving from local to distributed and if value moves from selling things to "getting to know you" and if that knowledge requires infrastructure control then the number of companies that can participate in the market shrinks dramatically. Not only in terms of who has the capabilities, but who could even afford to acquire them.

    The invoices Apple pays are shown above.

    ----

    Notes:

    1. Apple's retail stores are not included in these figures as Apple leases them. The cost of the stores will be discussed in a separate post.
  6. When will Apple's share price reach $500?

    Research · 51 comments

    Apple's share price has recently hit a new all-time high, over $400 per share. As often happens there was no specific new information from the company to justify this increase. On the other hand there is usually no news to justify share price drops in Apple. In fact, the stock is up on what would be considered counter-indicative news: the resignation of a very important CEO.

    But readers may recall that there is a measure of performance for Apple we can turn to that seems to show strong correlation to its stock price. It's not income and it's not growth in income but it's the strength of the balance sheet.

    I demonstrated this relationship last May with a post titled The market values Apple’s balance sheet, not its income statement.

    It's time to look at the data again to see if the relationship still holds. I added the data for Q2 and made some estimate about the cash position since July 25th (we will know this data with more accuracy when Q3 data is reported in a few weeks).

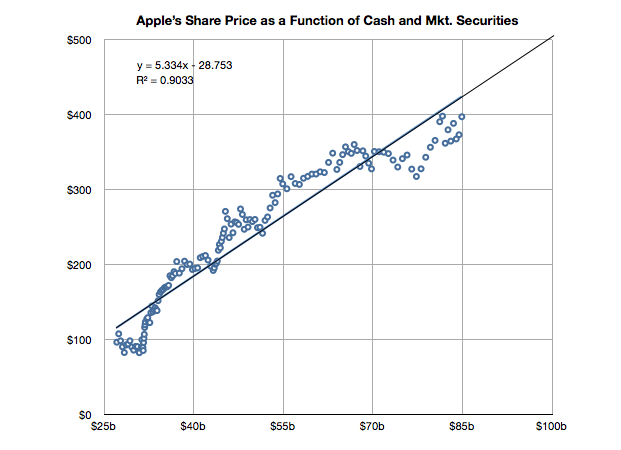
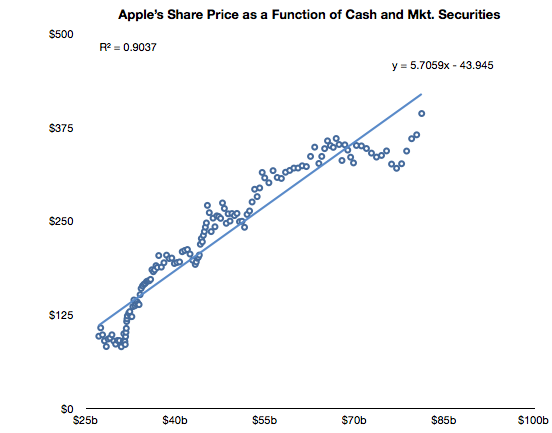
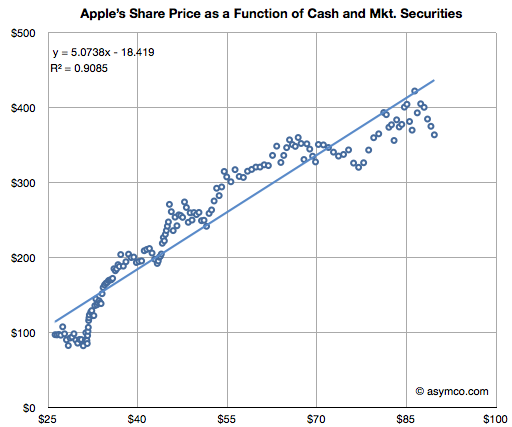
    The slope of the line above has decreased slightly but a strong correlation can still be observed. The old r-squared was 0.94 and it is now 0.90. I included the formula for the y variable (share price) as a function of x (cash).

    If you plug in $100 for x you get about $500 for y. So if this relationship continues[1], the answer to the question in the title would be "When the cash and cash equivalents reach $100 billion."

    ----

    Note:

    1. Note that whether the relationship holds (which it very well may not) depends on a strong correlation and "strong" is not well defined. The correlation has weakened slightly in the last six months.
  7. Apple's share price (adjusted for earnings and growth) reaches new low

    Research · 30 comments

    After Apple reported earnings growth of 125% its share price dropped to a P/E of about 15. This reduction in valuation is part of a trend I've written about for over a year so there were no surprises. The first chart below shows how the stock has traded between increasingly lowered P/E bands.

    As the second chart shows, not only is the P/E ratio declining, but when seen against the trailing twelve months (TTM) average growth rate, the P/E/TTM ratio is now at the lowest since the great recession (around 0.17--a value of 1.0 is a rule of thumb for "fair value" in a growth stock).

    Those values include cash. Excluding cash, the P/E as of Friday was 12.4. On a forward basis (my estimate--which has shown be be conservative lately) the P/E is around 7.

    Perhaps some day in the future investors will come around to looking at Apple as a growing company, but there has been no such inclination for over two years. As I've pointed out numerous times, growth and valuation are moving in opposite directions.

    The only correlation to the stock price has been found on the balance sheet, not the income statement. Looking again at the relationships between cash and the stock price, we see a clear relationship (r squared of .9)

    After a lapse during the first quarter, the relationship that has been in place since October 2008 is returning.

    Note the formula of the trendline which allows some interesting guesses on what the stock price will be. For example, putting $95 in cash per share results in a share price of $500. Let's see if the relationship holds until then.


  8. A princely sum

    Podcast · 146 comments

    Apple's cash and marketable securities increased to $76,156,000,000. The increase was 15% sequentially or $10.4 billion in three months. That's the equivalent of an increase of $11 per share (to a current $81.2/share.)

    The composition and growth of liquid assets is shown in the following chart:

    There is little I can think to say about this that hasn't already been said (see last Critical Path show.)

    Except maybe that the amount is now nearly 16% higher than three months ago. And that the amount added last quarter is higher than the amount on hand 4.5 years ago. And that the cash added is higher than Google's overall revenues in the quarter.

    ---

    Footnote:

    In Q1 2009 the company's share price briefly traded at $78. A buyer of shares at that price will have recovered their investment in retained earnings in nine quarters.

  9. Apple could buy the mobile phone industry

    Research · 75 comments

    The second quarter ends in less than two weeks. When it does, I expect Apple will have over $70 billion in Cash, Cash Equivalents, Short-term marketable securities and long-term Marketable Securities. That figure has been growing predictably.

    Also predictable has been the decline in value of Apple's mobile phone competitors. Most spectacularly Nokia and RIM. The enterprise values of the public companies selling 75% of all phones sold world-wide are as follows:

    • Nokia $22.6b
    • RIM $13.8b
    • HTC $25.4b
    • Motorola Mobility $4.2b

    The values of the profitable phone-making subsidiaries are a bit more difficult to estimate but we can use multiples of trailing operating profits. I generously use the multiple applied to HTC (14).

    • Sony Ericsson $0.21b x 14 = $3.0b
    • Samsung $3.76b x 14 = $53b

    That leaves valuing LG's phone business which has not been profitable in the last four quarters. I assume a nominal value of $10b. These data points are shown in the following chart:

    Given the current valuations, it would not be difficult for Apple to acquire every phone vendor except for Samsung with cash alone.

    The more remarkable thing is that as market values of phone vendors continue to decline, Apple's cash will continue to grow dramatically. Indeed, a time may soon come when Apple's cash will be worth more than the entire phone industry.

  10. iPhone liquidity: Why an unlocked Phone in the US matters

    Research · 93 comments

    The iPhone is now available in the US unlocked. Judging by the lack of reaction to the news, one would assume that this is not a significant event. I would argue however that it's a very significant event.

    What is unappreciated is that the iPhone is a very restricted product. Unlike any of Apple's other products (iPod, Mac and iPad), the iPhone is designed to be hard to get. Apple did not make it easy in the one dimension of ease that matters most: its purchase.

    Consider that many people in the world cannot buy an iPhone because it's not available locally. In case it is, in most cases you need to sign a contract and commit to a long-term relationship with a company other than Apple. In those cases where you don't sign a contract, you cannot use it with a service provider other than the one (arbitrarily) chosen for you.

    A few have been able to buy iPhones unlocked if they lived in a few countries (UK, France, Australia, Belgium, Hong Kong[1]) but those phones could only be purchased online if sent to a local address or in an Apple retail store--of which there are not many.

    Consider that in Europe alone, the following countries do not have iPhone distribution: Albania, Armenia, Azerbaijan, Belarus, Bosnia, Georgia, Iceland, Kazakhstan, Serbia and Ukraine. The populations total over 100 million people. In Asia the number of countries without iPhone distribution outnumber those with distribution. Add in Africa, Latin America and the Middle East and the unaddressed market begins to look very large.

    If you contrast this with every other phone platform out there, Blackberry, Android or Symbian, the iPhone is extremely restricted and the number of people that are permitted to buy it much more limited. The number of operators supporting Blackberry outnumber the iPhone at least by a ratio of two to one.

    Then there is the matter of distributors. This is a channel that iPhone does not leverage. Distributors account for more than half of Nokia's volumes. They buy in bulk and resell (sometimes illegally or in violation of contracts) vast quantities of phones.

    By offering unlocked iPhones in the US, the restriction on distribution is lifted to a large degree. What's different is that these phones can be purchased in 200+ retail locations. Many of these locations are in tourist hubs where there are large diaspora communities rotating continuously back to home countries. iPhones can now be purchased with cash and become as good as cash.

    And this is not a new phenomenon. When the original iPhone was available, Apple had to restrict buyers to 5 per person and stopped accepting cash because of the huge grey market demand. The same thing happened with the original iPad and with iPad 2 lines are still forming for it because distribution is so restricted. Consider also that sales in Verizon stores pale in comparison with those for GSM products.

    The way to think about it is that the iPhone has just become more "liquid" and it can now flow to parts of the world where it has been difficult to acquire. The iPhone was already liquid to some degree with unlocking and sales through Hong Kong/UK, but the US market's retail footprint and the lower costs that result will boost liquidity dramatically and probably increase volumes substantially.

    ---

    Note:

    1. According to Apple, the following 27 countries offer phones which are not "locked to carrier" : Belgium, Czech Republic, Finland, Germany, Greece, Italy, Luxembourg, Russia, Slovakia, Turkey, Hong Kong, India, Indonesia, South Korea, Macau, Malaysia, New Zealand, Singapore, Taiwan, Thailand, Vietnam, Bahrain, Kuwait, Qatar, Saudi Arabia, United Arab Emirates, South Africa
  11. The market values Apple's balance sheet, not its income statement

    Research · 79 comments

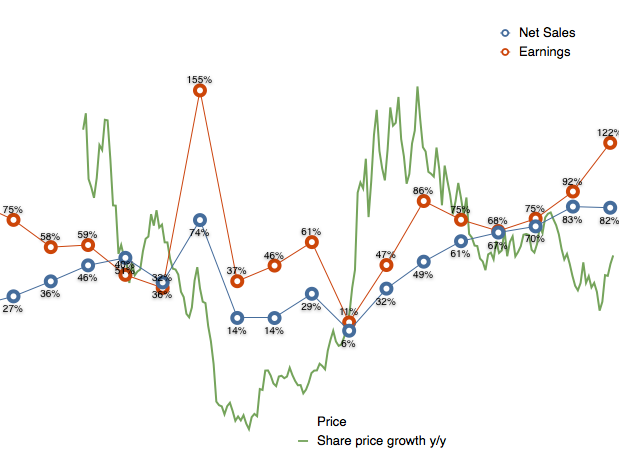
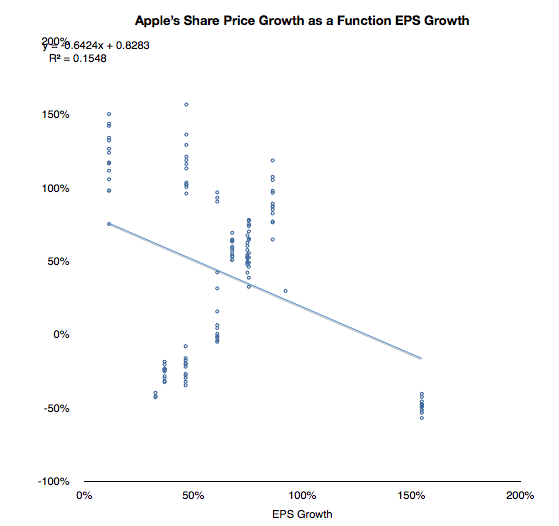
    As I have tediously repeated in this blog, Apple's share price has been de-coupled from its earnings for many years. Consistent earnings growth above 70% is not seen as valuable. As the chart below shows, there is no correlation between EPS growth and value growth.

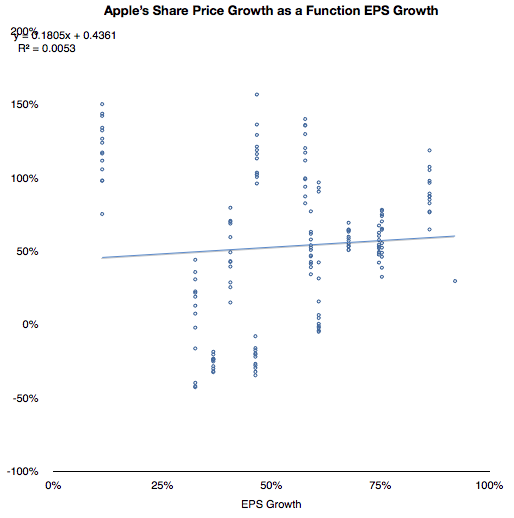
    With the outlying quarter when 154% growth was matched by a negative 50% price change, the correlation does not look much better:

    If we cannot correlate share price with growth then what is being valued? This has been a vexing problem because growth is the traditional, and logical, metric of valuation. Share prices, by definition (net present value of future cash flows) reflect future potential. That potential is more sensitive to growth than to anything else.

    But I've been leaving one factor out of the share price definition. Share price is NPV of future cash flows plus current assets.

    Since future cash flows are being thrown out of the equation, the company must be valued as a multiple of its cash. Does this relationship hold true?

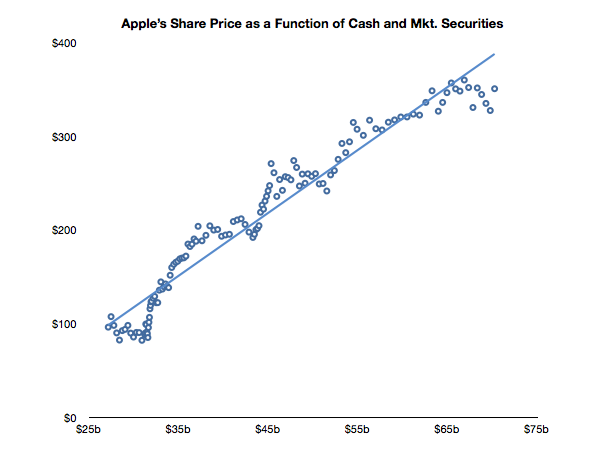
    In the chart below I show the weekly closing price of the shares and the corresponding value of the interpolated cash (and marketable securities) per share over the last two and a half years.

    A strong correlation can be observed. The R squared value is a healthy 0.94. Of course this is not to imply causation. Correlation is not causation, but it is a hint.

    Can predicting the cash per share be a strong indicator of future stock price? Perhaps. As long as this relationship holds, then having a reliable earnings model would still give us a solid predictor for the share price. Not because we can use EPS forward estimates multiplied by P/E but because we can estimate cash flows and the increase in retained earnings.

    Of course, the market "is being irrational" because it values on the basis of the present only (not its future.) But who are we to argue? This valuation has held since October 2008.

    As far as the market is concerned Apple's future is irrelevant. Its value is defined as a constant multiple of cash.