Asymco

Asymmetric Intelligence

estimate

  1. Estimates for Apple's fourth fiscal quarter: Entering the post-P/E era

    Research · 92 comments

    I'm late with posting my estimates for Apple's current (fourth fiscal) quarter. Normally I post my estimates a few days after the previous quarter's earnings are announced. This quarter however there was a lot to think about.

    As pointed out in my analysis of the previous quarter, the iPhone sold at a far faster rate than I thought. I had expected it would be a "lame duck" in the quarter but the expanding distribution allowed it to continue at a triple-digit growth rate (142% in fact, the highest quarterly growth rate since 2009).

    So the question for this quarter is, as always, what's the iPhone growth? The problem for me is that I have to choose between two assumptions:

    1. Due to distribution and dual product strategy (n-1 variant) production has now become more consistent.
    2. This quarter is the actual transition quarter when iPhone 4 production is throttled down in favor of the new model.

    The first assumption would put the iPhone growth at 100%+ while the second would place it in the 60% to 80% range. I decided to dial in a figure somewhere in between at 90% but I'm not very confident in this until we see more evidence that a new pattern has emerged.

    So here are my "mid" quarter forecasts:

    • iPhone units: 26.8 million (90%)
    • Macs: 4.8 million (23%)
    • iPads: 10.5 million (150%)
    • iPods: 7.0 million (-22%)
    • Music (incl. app) rev. growth: 30%
    • Peripherals rev. growth: 23%
    • Software rev. growth: 32%
    • Total revenues: $33.2 billion (growth: 63%)
    • GM: 41.8%
    • EPS: $9.05 (95%)

    Three years ago the company's share price was trading at a P/E ratio of about 35. The above estimate and today's price implies that's it's trading at the same multiple but the Earnings is measured over one quarter not one year.

    As @Patricklgoe noted on Twitter: the post-PC era for Apple means it's the post-P/E era as well.
  2. The Android and iOS pincer movement

    Research · 47 comments

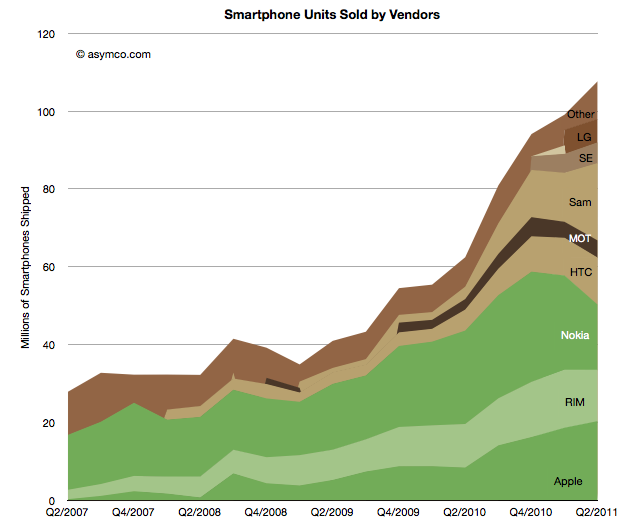
    Nearly all the data on smartphone shipments is now available for the second quarter 2011. Some fragments are still not public, including ZTE and Huawei (and any others) shipments. We also have estimates for the various platforms including an estimate for Windows Phone and Bada (though not for WebOS).

    This allows the following chart:

    Using the traditional color scheme which separates "integrated" from "modular" vendors, the chart shows overall volume growth and how the volumes are split among vendors.

    The market grew at about 73% y/y and 50% compounded over three years and 9% sequentially. The y/y growth rates for individual vendors were:

    1. Samsung 525%
    2. Apple 142%
    3. HTC 124%
    4. Motorola 63%
    5. "other" 29%
    6. RIM 18%
    7. Nokia -30%

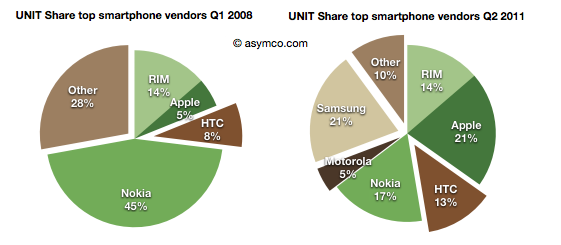
    In terms of unit share, the pie charts below show the before and after (three year span):

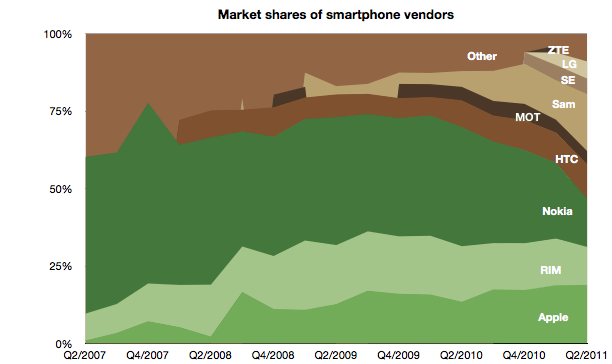
    And the stacked area below shows every quarter over a four year period.

    The story is largely unchanged since last quarter except perhaps in the rapidity or deterioration in Nokia's performance and Samsung's partial exploitation of that decline.

    It should be noted that not all of Samsung's volumes are licensed platforms. An increasing share of Samsung smartphone volumes is Bada, an internally developed OS.

    In the charts above I arranged the bars to place Nokia and RIM in the middle to show their double envelopment. A pincer movement is only an analogy but perhaps it's evocative of what's happening.

  3. The Samsung hedge: Estimating Bada for Q2 and hence Samsung's Android shipments

    Research · 28 comments

    The number of Bada phones shipped last quarter is not public, however some assumptions can be made that lead to plausible estimates.

    First, we know that Samsung shipped about 3.2 million smartphones in Q2 2010 and that total included Bada and Android (and perhaps even some Windows Mobile).

    Second, we know that there were about 19.9 million smartphones in Q2 2011.

    Third, Canalys published an estimate that Bada grew by 355% y/y.

    So if we knew how many Bada phones shipped in Q2 2010 we could derive the current Bada shipments and also realize how many of the nearly 20 million smartphones from Samsung were actually Android.

    The clue is in an estimate from December last year that suggested that there would about 5 million Bada shipments in 2010. Coming close to the end of the year, and from Samsung directly, we can be pretty sure the figure is accurate.

    Taking this 5 million and spreading it over four quarters could give us enough of an estimate. That makes 1.25 million quarterly units. If we assume some seasonality or increase toward the end of the year, a Q2 figure of 1 million might be more accurate.

    Therefore, applying the 355% growth rate yields a Q2 2011 estimate of 4.5 million Bada shipments and hence about 15.4 million Android devices from Samsung last quarter.

    Considering the increasing importance of Bada to Samsung, it should be clear that Android is not the only source of growth for the company and its transition of feature phones to Bada as well as Android is a key strategic driver for differentiation vis-a-vis low end entrants.

  4. The app industry vs. the music industry

    Research · 25 comments

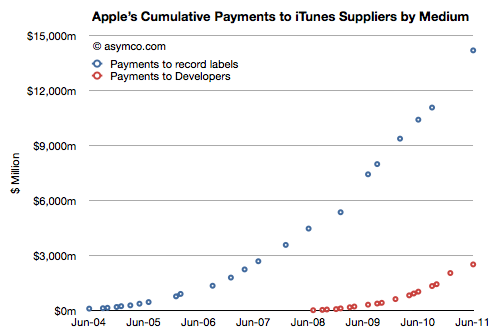
    By my estimate, Apple has paid out $16.6 billion to content owners. $2.5 billion to app developers and about $14 billion to music companies. The developer payments are published by Apple, the music payments are estimated based on total downloads and guesses about the split and pricing of that content (90% for the content and $1 to $1.2 average pricing over time.) There might be reason to move the music figure up or down but the difference will still be nearly a factor of 5.

    The cumulative payments are shown in the following chart:

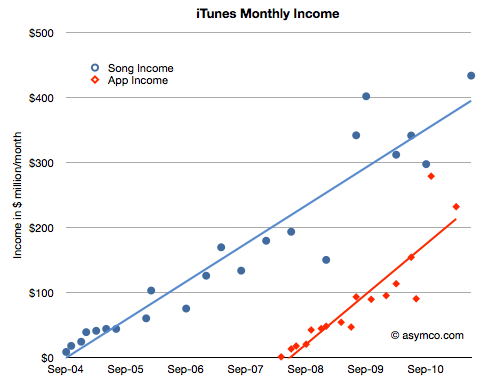
    From this perspective, the music business is still a far bigger ecosystem than apps. However that's cumulative data and digital music has been around far longer. The story can be told a different way: What's the rate of sale in the present period? From what we know about the business, we can see what Apple takes in for apps and music (I've already estimated what Apple "keeps" after paying content owners)

    The combined "sales rate" is a remarkable $665 million per month, but the split now is that music generates only twice the income of apps (i.e. cumulative is a factor of 5 but on a monthly basis the factor is 2). But what should be more impressive is how quickly the app business is ramping. By the slope of the trend lines, it would appear that app income will exceed music income within three years. Therefore, it's only a matter of time before apps generate as much income (exclusive of advertising) as music.

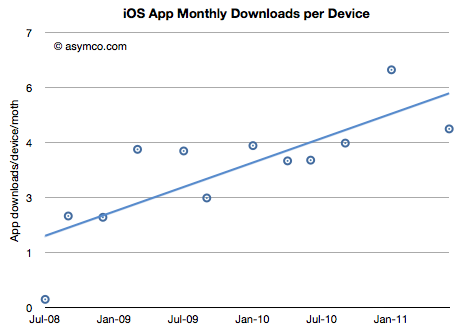
    Another perspective is the number of downloads per device per month. This shows that the rate of consumption of apps is increasing and is now about 6 apps per device per month.

    (You have to think of apps not as traditional computer applications or console games where each device has a certain number of expected apps attached, but rather that apps are more like a subscription where there is recurring monthly income).

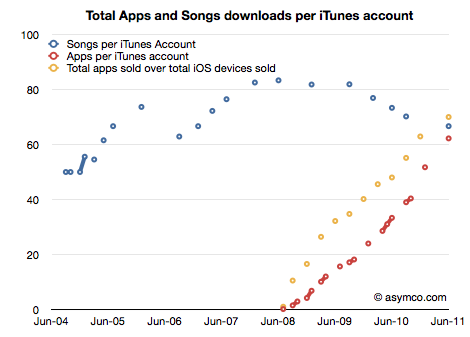
    I don't have a comparable figure for music because the number of iPods and Macs as target devices is hard to estimate, but I doubt consumption for music on a per device basis is increasing. As a consolation, I can estimate the number of apps or songs per iTunes account. Here the story is consistent.

    Each iTunes account has "consumed" about 67 songs but also 62 apps. Remarkable parity in such a short time. And the trend speaks for itself.

    All this data points again to the ascendancy of apps as a new medium. In a mere three years these digital objects have redefined themselves. They went from being tools to enhance the use of your phone to a new medium of expression and art. They have the ability to create a powerful economy of their own and will likely lead a profound shift in where value resides in mobile computing.

  5. The market values Apple's balance sheet, not its income statement

    Research · 79 comments

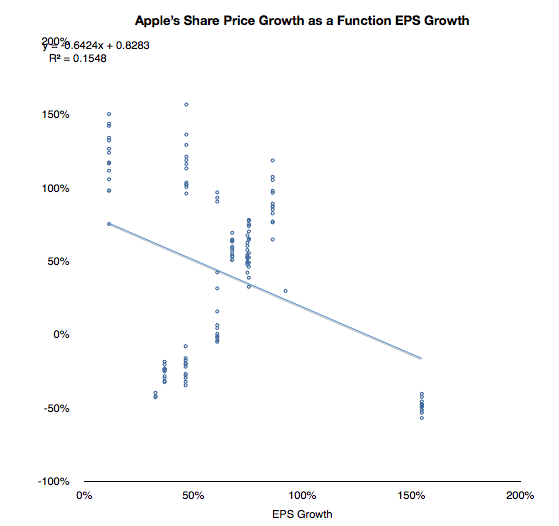
    As I have tediously repeated in this blog, Apple's share price has been de-coupled from its earnings for many years. Consistent earnings growth above 70% is not seen as valuable. As the chart below shows, there is no correlation between EPS growth and value growth.

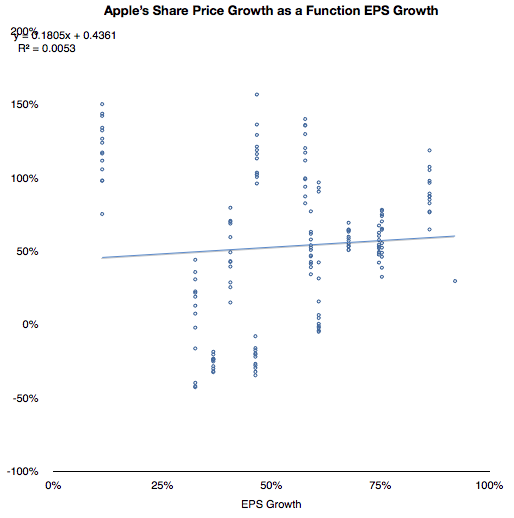
    With the outlying quarter when 154% growth was matched by a negative 50% price change, the correlation does not look much better:

    If we cannot correlate share price with growth then what is being valued? This has been a vexing problem because growth is the traditional, and logical, metric of valuation. Share prices, by definition (net present value of future cash flows) reflect future potential. That potential is more sensitive to growth than to anything else.

    But I've been leaving one factor out of the share price definition. Share price is NPV of future cash flows plus current assets.

    Since future cash flows are being thrown out of the equation, the company must be valued as a multiple of its cash. Does this relationship hold true?

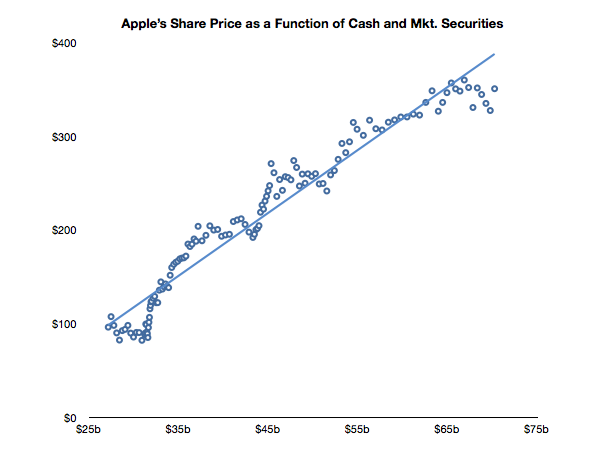
    In the chart below I show the weekly closing price of the shares and the corresponding value of the interpolated cash (and marketable securities) per share over the last two and a half years.

    A strong correlation can be observed. The R squared value is a healthy 0.94. Of course this is not to imply causation. Correlation is not causation, but it is a hint.

    Can predicting the cash per share be a strong indicator of future stock price? Perhaps. As long as this relationship holds, then having a reliable earnings model would still give us a solid predictor for the share price. Not because we can use EPS forward estimates multiplied by P/E but because we can estimate cash flows and the increase in retained earnings.

    Of course, the market "is being irrational" because it values on the basis of the present only (not its future.) But who are we to argue? This valuation has held since October 2008.

    As far as the market is concerned Apple's future is irrelevant. Its value is defined as a constant multiple of cash.

  6. Estimates for Apple's third fiscal quarter (ending June)

    Research · 42 comments

    Apple's CFO guidance statement:

    We expect revenue to be about $23 billion compared to $15.7 billion in the June quarter last year. We expect gross margin to be about 38%, reflecting approximately $55 million related to stock-based compensation expense. We expect OpEx to be about $2.5 billion, including about $255 million related to stock-based compensation expense. We expect OI&E to be about $70 million and we expect the tax rate to be about 25%. We are targeting EPS of about $5.03.

    Apple Management Discusses Q2 2011 Results - Earnings Call Transcript - Seeking Alpha

    Last quarter Apple guided revenue growth at an aggressive 63% with an EPS growth of 47%. They delivered 83% and 93% respectively.

    They are now guiding about 47% revenue growth and 43% EPS growth and my current estimates are 65% and 72% respectively based on the following:

    • iPhone units: 14.7 million (75%)
    • Macs: 4.3 million (25%)
    • iPads: 9.8 million (200%)
    • iPods: 8.0 million (-15%)
    • Music (incl. app) rev. growth: 25%
    • Peripherals rev. growth: 25%
    • Software rev. growth: 25%
    • Total sales: $25.8 billion (65%)
    • GM: 38.5%
    • EPS: $6.02 (72%)

    The biggest uncertainty remains iPad growth. This will be the first quarter where we can dial in a y/y growth rate. I'm being bullish with 200% because I believe the ramp for the iPad 2 may get sorted out. There are also more countries being opened up this quarter (13 this week).

    Apple's stock price to earnings ratio has dropped to 16.72. Ex-cash it's 13.5. On a forward basis (my estimates) it's 8.3. Apple's valuation is now a case for business historians to discuss because I don't think there are modern precedents.


  7. Apple Earnings: Evaluating my performance

    Research · 24 comments

    As chronicled here, this quarter I went through three sets of estimates. This is a departure from my standard practice of sticking with one forecast made three months in advance. I felt last quarter was filled with materially important developments which deserved updating.

    So how did I do?

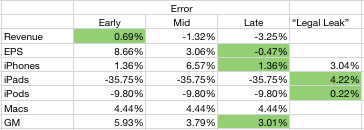
    I wanted to see if the additional information helped or hindered predictability so I put my three predictions side-by-side and measured the errors. I also added the "legal leak" from April 15th (published April 19th) to see whether it was an accurate predictor. The table below shows the error rates with the lowest error highlighted.

    It's clear that my error rate decreased as new information was used. It's also clear that the "legal leak" was very accurate. What follows is a discussion of each line item.

    The iPhone forecast was very accurate both early and late in the quarter. At 1.36% error it was even lower than what was leaked by Apple. I used the information about China and Verizon to boost sell-in and increased the growth rate to 110%. That proved to be the right call. I did not pay any attention to talk of component shortages as I did not consider them to affect Apple whose market share of devices is so low. I would score my "late" estimate as an "A".

    Even though I disclaimed it, my iPad forecast was very inaccurate. In contrast, the leak was very accurate. Although mitigated by the higher sell-through (5.1 million) shipments were constrained by the change in product. Details like the date of shipment, the date of announcement and the ramps made this a particularly difficult transition to predict. At 36% error, I score it as an "F".

    The iPod error was about 10%. That's mediocre. The product dropped in sales by 17% (vs. 10% expected). Again, the mitigating factors, like higher mix of iPod touch and thus increased prices helped to keep the financial performance decent. I score this as a B-.

    The Mac prediction was accurate. The error was less than 5%. I will discuss the Mac business in a separate posting but it suffices to say that the growth was excellent but predictable. I score my prediction as an "A-".

    Revenues were reasonably predictable however pricing seems to have been affected by exchange rate volatility. The iPhone turned out to have a huge average selling price ($660) which made up for the lower revenues from iPad. The error of 3.25% is acceptable. I score it as an "A".

    The Earnings number was very accurate. The error for the late estimate was less than one half of one percent. This bottom line number is a function of all the other numbers so it's the most encompassing. You have to account for factors like interest income, changes in the number of outstanding shares and tax rates. None of these are predictable. However, I was lucky. With an error below 1%, I rate this as an "A+".

    My overall performance as a grade point average would be 3.43 or B.

  8. Review of Apple's unit numbers released in legal filing prior to earnings

    Podcast · 48 comments

    Thanks to Nilay Patel at This is My Next for posting the complaint filed on April 15th against Samsung by Apple which revealed some potentially material data about its performance in the last quarter (which won't be public until the 20th).

    On page 4:

    "As of March 2011, more than 108 million iPhones had been sold worldwide"
    "By March 2011, Apple had sold over 60 million (iPod touch) units."

    On page 5:

    "By March 2011, Apple sold over 19 million iPads".

    These numbers are material because we know units sold prior to CQ1 and can derive the minimum units sold for these three product lines during Q1.

    Namely:

    • Total iPhones sold before Q1: 89,971,000 implying a minimum of 18.1 million sold during the quarter (my estimate is 18.4)
    • Total iPod touch sold before Q1 (estimated): 55.5 million implying a minimum of 4.5 million iPod touch sold during the quarter (my estimate 5 million)
    • Total iPads sold before Q1: 14,789,000 implying a minimum of 4.2 million iPads sold during the quarter (my estimate is 7.3 million).

    The only outlier in terms of delta to my estimates is the iPad units which has always been the wildcard.

    Apple published lower bound figures but it's a matter of speculation as to how far below actuals they are. Nevertheless, I would treat the iPad numbers with extreme caution.

  9. The Android step function

    Research · 40 comments

    There is precious little data on Android units sold. There are estimates but no actual summary. Google themselves don't seem to know as they don't report sales, preferring to report "activations."

    Assuming that activations means "unique activations of new devices" then we can draw some equivalency between Google's reports and the reported units of iOS sold. There is some uncertainty with respect to iPod touch units, but that is not very big (estimates are drawn from Apple's reporting of overall iOS units at several points in time.)

    To estimate Android, I took the download rates currently available and placed them in the month when they were published. I then interpolated the data monthly and quarterly.

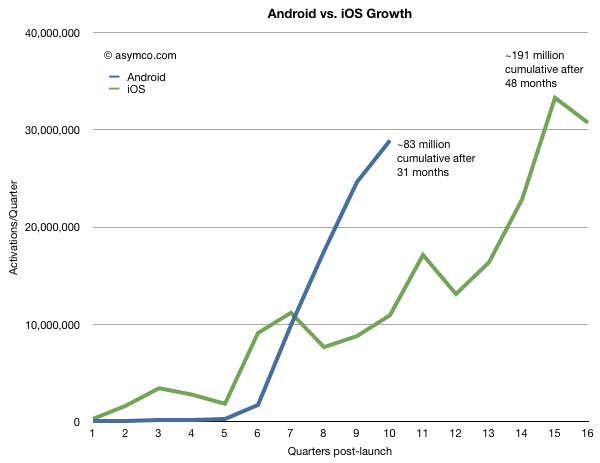
    To make the comparison more valuable, I chose to index the starting point at the launch of each respective platform and plot quarterly units (or activations). This way we can observe how the platforms ramped in growth and where they were at similar points in their lifetimes.

    The following graph results.

    There is likely to be more seasonality in Android data than is shown, but the impressive thing is that Android is running at three times the equivalent adoption rate for iOS at similar points in time. In fact Android is being "sold" as rapidly as iOS today even though iOS has been in the market about 15 months longer.

    Overall, cumulative units sold for iOS are still about twice as many but if Android will continue to grow as rapidly as it does now, it will likely overtake iOS in installed base in less than a year.

    One should be careful about drawing conclusions that this implies effective competition. Both platforms are growing very quickly. iOS is growing at at least 100%/yr and Android's second year was 65x bigger than its first. iOS growth is limited by the ramp rates of a limited portfolio of products. Android growth is limited by how quickly vendors can bring out products. Neither platform is demand constrained and hence they are competing for share of growth not for share of a fixed pie.

    Extrapolation is a dangerous game, but the chart above shows some predictability in Apple's curve whereas Android has a "step function" or discontinuous feel to it and that's a curious thing.

    Not so much for its lack of predictability but because it's so asymmetric to iOS.

    A dictum of classical physics states that in nature everything is continuous. However, in quantum physics everything is discontinuous. Both models of the physical universe have their uses.

    It should be noted that both business models represented above can also co-exist, at least for the foreseeable future.

  10. Revisiting Estimates for Apple’s second quarter earnings (ended March)

    Research · 29 comments

    Estimates for Apple’s second quarter earnings ending March | asymco.

    Since making the original estimates In January,

    • Revenue: $24.5 billion
    • EPS: 5.89
    • iPhone unit sales: 18.4m
    • iPod unit sales: 10m
    • Mac unit sales: 3.6m
    • iPad unit sales: 7.3m
    • Gross margin percentage: 38.8%

    I revised them at the end of March to the following:

    • Revenue: $25 billion
    • EPS: 6.21
    • iPhone unit sales: 17.5m
    • iPod unit sales: 10m
    • Mac unit sales: 3.6m
    • iPad unit sales: 7.3m
    • Gross margin percentage: 39.6%

    In the past I was comfortable keeping untouched estimates made three months in advance. This quarter however there have been several developments during the quarter which were unforeseen and cause me to revisit my estimates.

    1. The Verizon iPhone launch. Observations of the event focused on line lengths and buying activity. However, Apple reports shipments not sell-through. I believe the deal structure was such that Apple obtained a very large order as condition to the relationship. The January and March update analysis did not consider this order size. We have also more data on sales from HTC and RIM and there is no letup in the market's growth. As a result I am revising the growth for the iPhone back up to 110% y/y and 18.4 million units.
    2. Crucially, I'm increasing iPhone ASP to $625 on the basis of this new demand and the likely delay of iPhone 5 launch.
    3. The iPad 2 launch. This product is still too young to see production and sales patterns. However, demand for the second version seems higher than for the first. Distribution is broader too. The unknown is production. I am keeping the unit number at 7.3 million which is the same as the level of CQ4.
    4. China is booming. The Chinese New Year occurred in the quarter and since last year that has meant a sequential increase in device sales for Apple. But it's a double edged-sword. Almost all production activity is shut down during the holiday period. Apple depends on China exclusively for manufacturing so they will certainly be affected. So whereas it's likely that we'll see increased demand from China this year due to even better distribution, macroeconomics and brand value I'm unsure if supply rose to match. Overall, I'm not changing unit growth due to his increased demand but I'm cautioning that there could be downside bias in my estimates.
    5. The tsunami disaster in Japan will affect some demand in Japan and some of the supply chain will be disrupted. However, the effect will be felt more by weaker competitors. It's possible that the event will amplify the shortages that Apple's pre-purchase agreements already created. The consequences are bad news for Apple's competitors but I rate it as neutral for Apple.

    Given these new facts coming to light, I would update my estimates as follows:

    • Revenue: $25.5 billion
    • EPS: 6.43
    • iPhone unit sales: 18.4m
    • iPod unit sales: 10m
    • Mac unit sales: 3.6m
    • iPad unit sales: 7.3m
    • Gross margin percentage: 39.9%

    Resulting EPS growth would thus be 93%.

    For the record, I value my January estimates since they are based on long-term pattern recognition rather than transient events and thus are more useful in forming a market theory.

    However, these transient events cannot be ignored and analysis needs to be informed by both theory and events. I will be watching to see which set of predictions (early, mid or late) will be more accurate.

  11. Predicting iPhone sales for dummies

    Research · 36 comments

    Apple's second fiscal quarter has just ended. Time for analysts to put forward their predictions for the quarter's report (due in about 3 weeks.) If history is a guide, the estimates will range quite widely and accuracy will be determined mostly by the ability of an analyst to predict iOS device sales (and iPhone most of all).

    How hard can it be?

    It depends on what you choose to prioritize as the proxy for sales. In competitive markets there is usually a constraint on demand and rivalry among suppliers. If that's your assumption you might want to use samples from the sales channel as a proxy. That means sampling distribution channels and sales through to end users at retail. You might even watch competitors and index them to each other using historic market shares.

    In markets where demand outstrips supply, the best method would be to determine the constraints to production and measure those.

    In Apple's case we know from company statements that Apple faces more demand than it can supply. That makes things easier for the amateur because she can just figure out production. In other words, the logical way to forecast Apple's iPhone sales is to guess how many they can make.

    That is not trivial since production data is not public. However, we have historic sales data. We also can make assumptions about how much inventory is carried (some data is actually available here as well.)

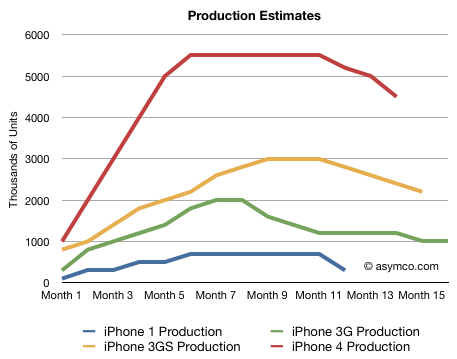
    Combining these public data sets we can build up a model of production ramps and look for patterns of growth.

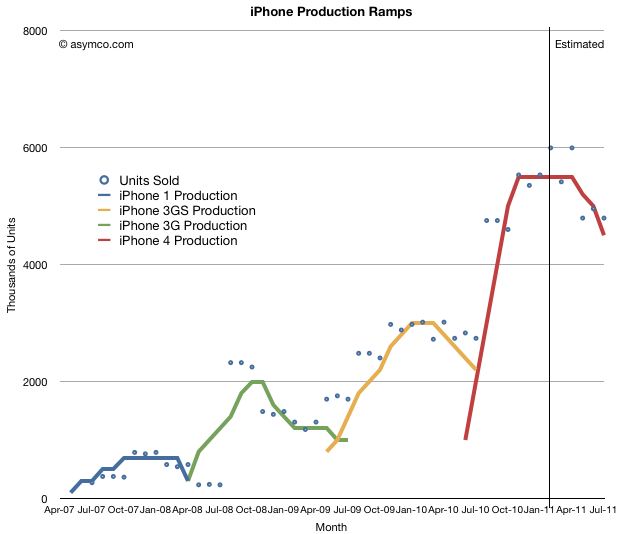
    So here are the patterns of sales for the four versions of iPhone sold to date with some production ramps overlaid. The monthly sales are approximations based on actual quarterly sales divided over the months according to the number of days available.

    The assumptions are:

    1. Inventory during any one month has to be greater than zero.
    2. Inventory must be minimized. Ideally it should not exceed 2 million units and preferably should be around 1 million units at any given time.
    3. There is a limited amount of overlap between production of various generations. I.e. once a new version is launched, the older product should end production. Continuing sales of older model should be made available from inventory.

    The following chart shows the ramps for the various versions of iPhone that satisfy these assumptions and are shown relative to the same time frame (each line shows the number of units produced per month for each generation of iPhone):

    I need to stress that this is just my estimate. It's an approximation and not reality. What it does is give reasonably accurate predictions for units sold.

    What I've always assumed is that each new version of the iPhone sells twice as many units as the last. This is roughly translated into: each ramp is roughly double the previous ramp (at least on average). The data bears this out. Apple has been very considerate in keeping products on similar cycle times so that we can see this pattern emerge.

    Once you build these models, forecasts are not that hard to make:

    • The current generation will probably sell around 60 to 65 million units.
    • The product will still sell for at least one more quarter (CQ2, FQ3)
    • We know how many have been sold so far, so we can be pretty sure what will happen in the quarter just ended and the one just starting.
    • Looking at the pattern between generations, we can guess what the iPhone 5 curve will look like and build up the units forecast by month and quarter.

    You can sanity-check the forecast by looking at overall market shares for Apple and overall market growth. If share moves too far up or down it might makes sense to revisit the data.