In the iPhone cost structure analysis I showed how revenues and costs for iPhone are probably allocated. The revenue per iPhone was shown to include $29 for revenue items "above" the price of the phone to the channel. This total includes Apple's own iPhone accessory sales plus revenue from licensing the "Made for iPhone" trademark to third party accessory makers. Apple also receives some revenues from cloud services. But, pertinent to our recent discussions on the Android business model, Apple also receives revenues from Google.
Wouldn't it be nice to know how much? Here's a way we can estimate it.
I've read an estimate that 50% to 60% of ad revenues from Google search initiated via iOS are paid to Apple. This is believable because the TAC for Google overall is about 40% and Apple probably drove a hard bargain to get a premium for its, presumably, premium traffic.
So if we knew the revenue run rate for Android search on a per device basis we could perhaps guess how much of each phone's revenue comes from Google. What we've heard last year in Congressional testimony is that two thirds of its mobile revenues come from iOS devices. This would imply that the run rate for iOS would be 2x the run rate for Android.
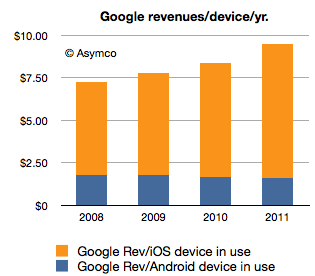
Having a model of Android revenues helps at this point. Assuming Google obtains $4.4 from Android (excluding AdMob and App sales) and assuming negligible other mobile revenues from other platforms gives a possible Google revenue per iOS device per year of nearly $9.
Taking the lower bound of the revenue share estimate above means that half of Google's revenue goes to Apple or $4.4/iOS device/year or $9 over the two year life of the device.
That would put revenue from Google at about 1.4% of iPhone revenues (see average revenue per iPhone here). And that revenue comes without any costs and so flows straight to the bottom line. That, in turn, would imply that 3% of Apple's operating margin is provided by Google. Not a bad deal considering that some phone vendors can't get that for their entire product line.
The interesting factors at work here are that this contribution by Google to Apple is higher than the contribution by Android to Google. In yesterday's post, I calculated that in 2011 Android contributed about $590 million to Google's operating margin (5% of total).
If we consider that Google pays Apple $9[1] for every iOS device and since Apple sold 156 million iOS devices in 2011 then Apple received $1.4 billion from Google, all of which went to the bottom line.
$1.4 billion from Google to Apple vs. $600 million from Android to Google. Three percent contribution of Google to iPhone profits vs. 5% contribution of Android to Google's profits.
This sets up all kinds of game theorizing which will undoubtedly entertain and enrich us all.
---
Notes:
Perhaps this $9 value is not valid for all devices. Perhaps iPod touch does not get a lot of traffic and is less valuable. Perhaps iPads get more traffic and are worth more. On average, this may be plausible.
Yesterday I presented the estimated Android income statement vis-à-vis Apple's income statement. In this post I'll compare Android as a part of Google's overall business.
Recall that Google has already been compared in terms of overall revenue, growth and profitability to Apple and Microsoft here. The argument can be made that mobility has not yet had a measurable impact on Google (certainly not noteworthy enough to be reported by management).
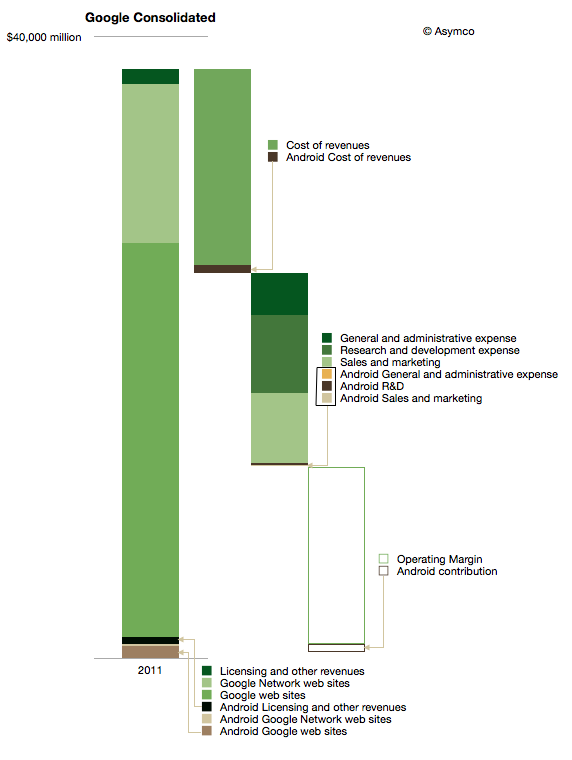
The impact on Google of Android can be shown in the following diagram:
I used color coding to identify non-Android (Green) and Android (Brown) segments of the business. Overall, Android could amount to about 3.5% of total Google revenues and about 5% of operating earnings.
It's important to note that this is not all the revenue that Google obtains from mobility. This diagram represents Android only and there are revenues also coming from alternative platforms and operator deals.
iOS contributes between 3 and 5 times more ad revenue to Google than Android.[1] The contribution to earnings is even more difficult to assess. We don't know the terms between Google and Apple for search revenue sharing and placement. One analyst suggests that the cost of sales (TAC) for mobile Safari search could be as high as 60%, far above what Android traffic costs.
The other observation is that Android cost structure is quite small (see third bar from the left above.) My estimate is that Android R&D is only about 3% of total Google R&D. I'm projecting $200 million for 2012. That implies between 700 and 900 headcount. It's interesting to compare that total to the 20,000 or more that came with the Motorola acquisition.
Having these estimates allows one to calculate many ratios and potential valuations. I'll refrain from putting a value on Android using multiples or sales or earnings, but would come out well below what was paid for Motorola's $12.5 billion.
Which again compels one to ask what is the strategy at work here.
---
Notes:
There are various reports of the ratio including congressional testimony and reports to courts. BlackBerry, Docomo and KDDI were listed as significant other sources of ad revenue by Google in 2010.
Data is useful only when put in perspective. Yesterday's post on the Android Income Statement showed how sales and revenues are captured and how costs are paid for that revenue. The data was shown for the entire calendar year 2011 and the maximum value in the vertical axis was $1.5 billion.
Google has also reported that their revenue "run rate" is now in excess of $2.5 billion so there is significant growth, as would be expected from an exponentially increasing user base.
However, it's important to place this growth in perspective, both in absolute and in relative terms.
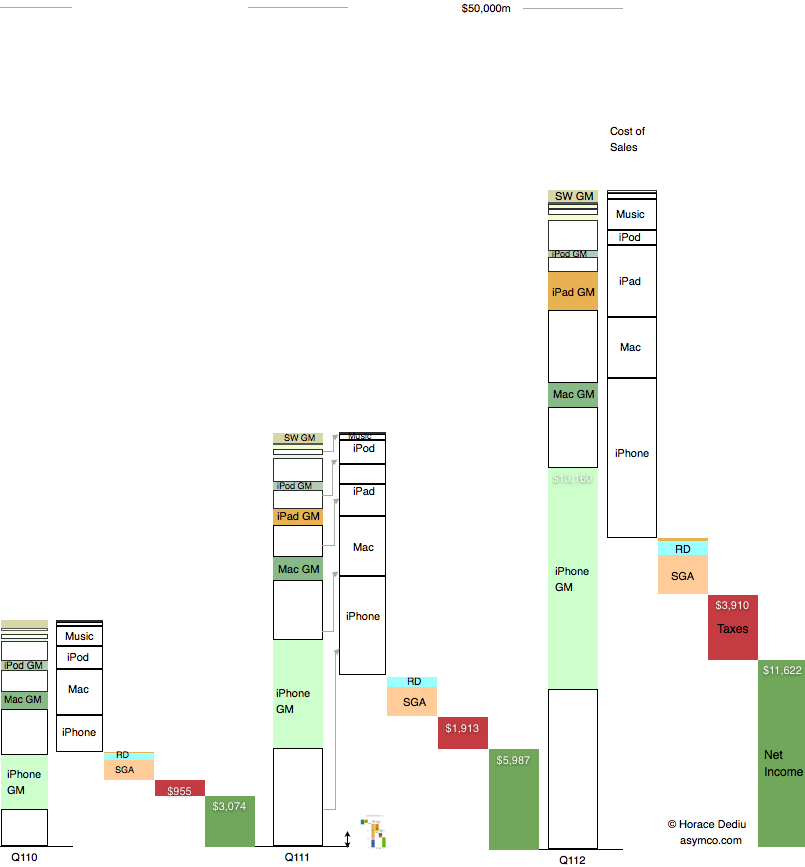
Below is a diagram showing Apple's revenues for the first calendar quarters of 2010, 2011 and 2012. Each product group (iPhone, Mac, iPad and iPod) is shown separately with estimated gross margins (GM). Operational costs, taxes and net income are also shown.
Consistent with previous versions of this data are the color schemes where white areas represent costs of goods sold.
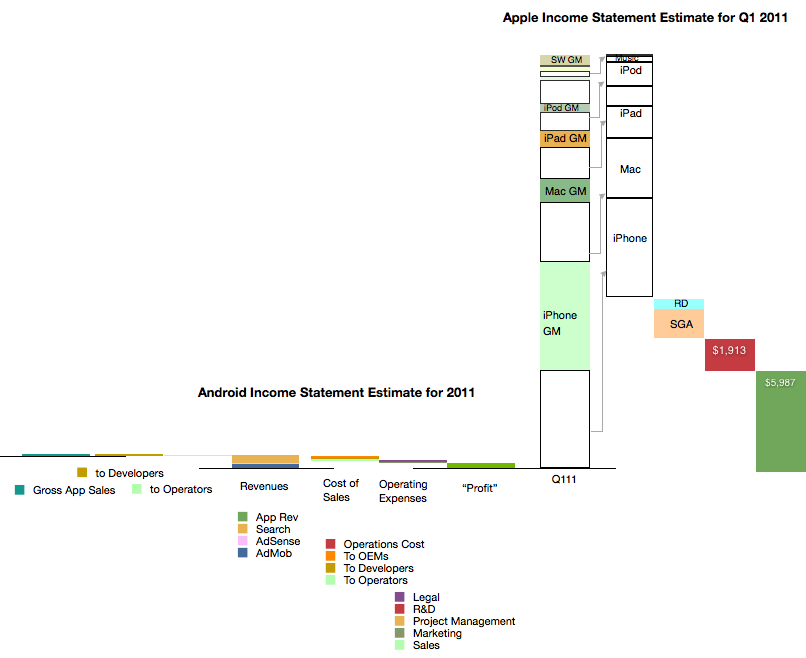
I also placed a scaled version of the Android Income statement next to the first quarter 2011 revenue bar for Apple. The scale is maintained where $1 billion is represented by the double-ended arrow line.[1]
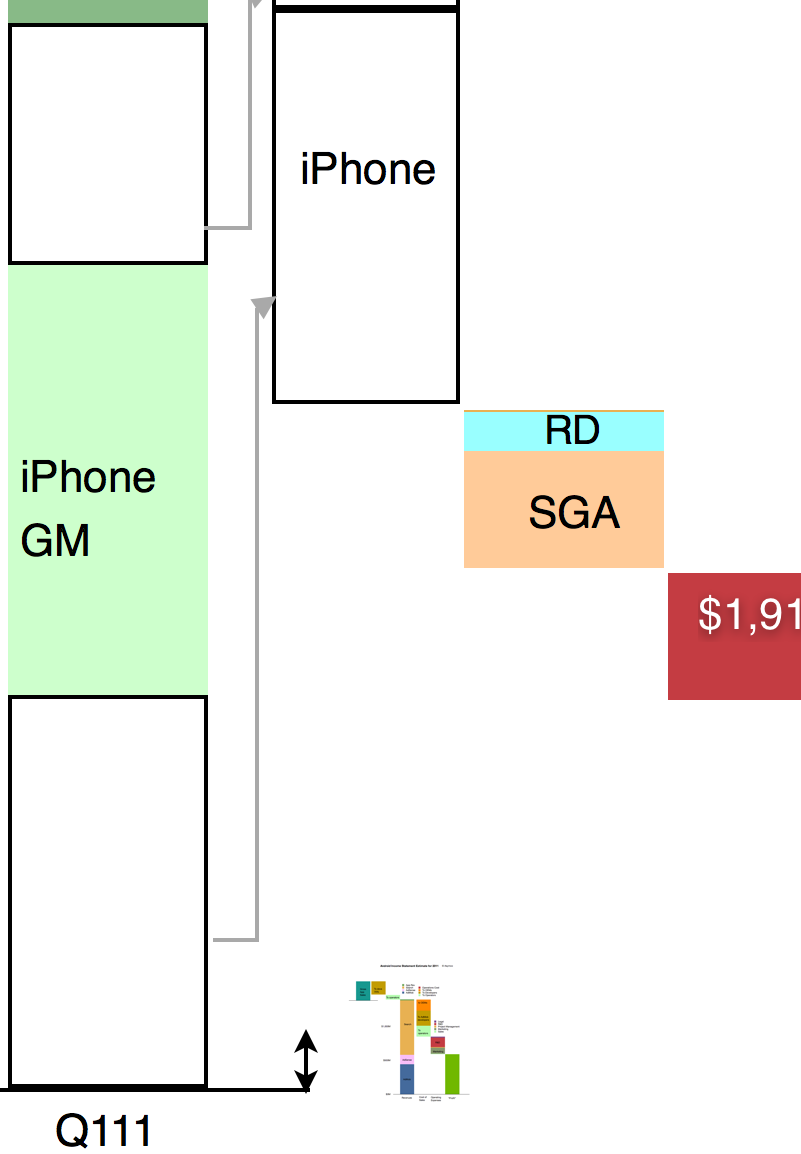
It might be hard to see the Android section of the chart so I expanded it below at 400% the original:
It is still difficult to resolve the data at this resolution but the picture should become clear nevertheless. Keep in mind that the iPhone data is for one quarter while the Android data is for one year. Comparing revenue "run rates", on a yearly basis Android is 2.5% of iPhone or 1.6% of iOS.
As various members of the Android ecosystem are rewarded from the 40% revenue share of Android, it would be important to consider the scales involved in these illustrations when considering the influence Google exerts. It could be argued that Google's spreading of wealth from search creates strong incentives for participation in its ecosystem.
However, there is little wealth created. 40% of a little is a lot less.
---
Note:
The scaling of the image in both X and Y dimensions can be deceptive. I provide the following view where only the vertical dimension (value) is reduced for Android
This is a continuation of the "Android Economics" series of posts. It deals with how revenues and costs are categorized for Android.
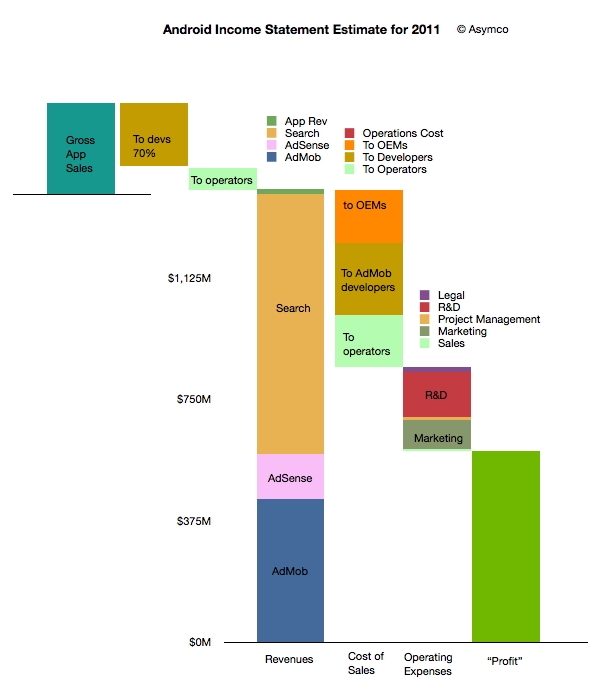
The following diagram shows an approximate representation of what Android's "Income Statement"[1] would look like.
I'll discuss the assumptions that are built into the model as I go along. I'll begin at the upper left and move toward the lower right in the discussion.
The first thing to note is that sales from Google's (formerly known as Android Marketplace) Play are not registered as revenues. This is because Google, like Apple, treats itself as an agent. Agency means that the revenues don't "belong" to the agent but get passed on through to the primary beneficiaries. In the case of Play, Google passes 70% to developers (or content owners) and then distributes on average 25% to network operators (or carriers).
I emphasize on average because there are many cases where Play transactions are not handled by or don't pass through operator billing systems. In those cases where operators are involved, it's possible that they capture more than 25%. It's not uncommon for operator billing to capture 45% of a transaction's value. The reason for this is that there is significant collection risk on billing--far more risk than on credit cards. It would also imply that on some transactions Google may be paying out more than it receives.
This means that on average about 5% of Play content sales to be booked as revenues for Android.
This 5% ends up a quite a small amount if overall app sales are small. We don't know the exact amount but anecdotal evidence from developers seems to indicate that they receive far more revenues from ad sales than from direct app income. Hence the size of the Android app sales is overall, modest. My estimate is that in 2011 there were about $330 million in gross app sales through the Android market. (Google estimated its sales to be 76 million for 2010 half way through that year.)
The bulk of revenues are therefore from other sources: Search, AdSense and AdMob. I'm modeling that overall revenues are based on a "revenue per device in use" multiplied by the number of devices in use. Google has publicly stated that they are targeting $10/device/yr. in revenues. This is probably ambitious as the amount was nearly that much in early 2010 but the number of devices bought by emerging market consumers exploded. As they are not actively targeted by Google's primary customers (especially in China), the average revenue per phone is likely to be much lower. I estimated $6.5 on average for 2011.
However, even if we use $6.5 per phone per year, the total revenues are quite strong since there were likely more than 215 million users at year end[2]. That results in a total revenue base of $1.4 billion for 2011. Removing the app revenues results in about $1.38 billion from Search and AdSense and AdMob.
How to allocate revenues to these three businesses is mostly guesswork. I used a split of about one third to AdMob, 10% to AdSense and the rest to Search. If we assume this split then the next step is to consider how to allocate costs to these sources of revenue.
As discussed in the introduction to this series, the primary costs of sales for Search and AdSense are network operators and OEMs or phone vendors. They are the primary "channel" which ensure the flow of search terms to Google. As Google also explains, the channel receives revenue share--so-called traffic acquisition costs (TAC).
I used an overall allocation of 39% for TAC. Crucially, this includes the payments to developers for AdMob traffic. The rule of thumb I used was:
Network operators get 20% of Search
Developers get 50% of AdMob
OEMs get the rest (of the TAC)
The resulting split is shown in the column above with the "Cost of Sales" at the bottom. There are also additional operations costs which are negligible.
After this 39% TAC (revenue sharing), Google needs to pay its operating expenses. This includes R&D, Marketing, Sales and Legal costs for the Android division (including AdMob). You can see the approximate values in the column labeled "Operating Expenses". This operating cost amounts to about 27% of sales, with R&D at 14% and Marketing at 9%. These rather high fixed costs make sense as there is a significant development work underway for Android.
Finally, after these costs are allocated, the remainder is the contribution of the division. This comes to about 34% of revenues which is called the operating margin. Google has to attach depreciation from data centers and other costs as well as taxes before placing this into earnings.
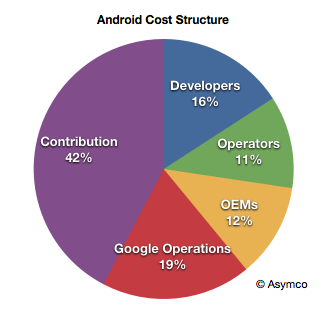
Considering the agency structure, the overall cost structure of Android looks like this:
When playing with the assumptions, it becomes clear that the model is most sensitive to the revenue per device and total devices in use. The profitability is entirely dependent on those figures as variable costs are a percent of sales and fixed costs are limited by talent constraints.
For example, if revenues per device drop to $4.5/yr then the operating margin drops to 38%.
Now we can calculate some of the more interesting figures. For example:
Android OEMs receive $0.76 on average per device per year
Android Operators receive $1.07 on average per device per year (including Play)
Android Developers, as a group, receive $1.94 per device per year (including Play and AdMob)
Google receives a contribution of $2.75 per device per year from Android
Again, these figures are very sensitive to the revenue per device (currently assumed to be $6.5).
Because of the number of devices involved, these cash flows are an important part of the value network of mobile computing. The next step will be to assess how they affect the incentives, alignments and competitive stance of various platforms vying for a seat at the table of the future of information.
--
Notes:
An income statement shows the sources of revenues and the costs associated with those revenues. It also shows the fixed costs (or costs which are independent of revenues so they don't go up or down if revenues change). Finally it shows the operating income which is called contribution if it's a division within a company. This contribution is still subject to taxes and depreciation before it's recorded as earnings.
I'm using Android installed base estimated based on daily activation rates as published by Google. I've discussed these estimates here. I'm using year-end estimates but subtracting retirements based on a two year device life.
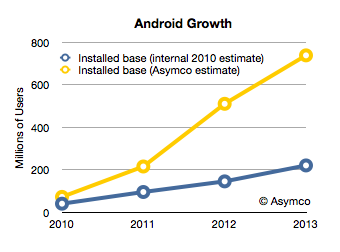
Android has had unprecedented growth. Based on activation announcements, it's possible to estimate that thus far, about 370 million Android devices have been activated. The total number of devices in use is a lower figure which depends on replacement rate and retirement rate. This total number of devices in use at year end is estimated in the following chart.
I added the blue line which represents what Google had as an internal estimate in mid-2010.[1] The difference between the two lines shows that Android's growth is far higher than what the company expected. If the company itself did not expect this growth, it's unlikely anybody else did either.
Unexpected, exponential user growth is usually accompanied by a dramatic positive improvement in the finances of a company and a higher return to shareholders. The curious aspect of Android's success is that it has not had an impact on either. The market has not "discounted" the half-billion anticipated Android users into a price for Google shares that reflects this growth. It can only imply that those users are not very valuable.
But why would there be such a disconnect between the number of users and their value?
In order to answer this question we have to come to grips with what I call "Android economics". We need to understand how Google uses Android to make money and whether it is succeeding and if it's not, why not.
In many ways, the Android business model is straight forward. It's an extension of the existing Google business model: Revenue is obtained from Search, AdSense and the applications that enable these two. In the case of Android there is also revenue from app sales (Google Play a.k.a. Android Market) and from AdMob. Of course, all these revenue sources (except for Play) are sold through other mobile channels that include alternative, competing platforms. They are present on iOS, Symbian, BlackBerry and even embedded OS phones ranged directly by carriers. For each of these alternatives, Google pays for placement of their search as the default search in the browser.
To Google, total search revenue from iOS is far higher than it is from Android. That's because iOS users engage more with their devices and there are not yet a large multiple of installed Android users vs. iOS users.
But it would make sense that having your own platform would be more economical because there would be none of these placement fees. In this sense Android is another "channel" for distribution of Search and AdSense. But one which may be a lot cheaper.
However, it turns out that it does not work that way. Android has other costs.
In fact, Android's distribution costs might be higher than other channels. What we have to understand is that all of Google's channel revenues have a "cost". The revenue from a particular distributor of search results that Google generates is offset by the cost to acquire the terms. You can think of it as Google paying for the queries through a revenue sharing agreement. Google does not get search terms directly and depends on distribution. Overall, it pays about 50% of revenues back to distributors. In the case of its own web sites the rate might be lower, perhaps 40%.
Google even has a term for it: Traffic Acquisition Costs or TAC.
This revenue sharing in exchange for search terms extends to Android. Google pays about 40% TAC to Android distributors of those searches. But since Android is owned by Google, who does Google need to pay for traffic? Who is an Android distributor? Who gets the revenue share?
Google does not make a secret of it: network carriers and device vendors (OEMs) receive revenue share. From the latest earnings conference call:
Yes. I mean, again, I'm not going to talk about specific of the TAC on mobile. But as you know, we get people using our devices both organically as well as through our distribution partnerships with carriers and OEMs. And typically, the OEMs and carriers participate in some of the economics that are on the Android marketplace or Google Play and some of them participate in the economics around Google Search just the way we would do syndication on the Web platform, which you do with many partners around the world. We have similar deals on the mobile front.
Arora made another point in the quote above. Not only is there revenue sharing with carriers and OEMs for Search and AdSearch but also for Google Play (app and content sales.)
Device vendors and carriers get a cut. Google's model has always been one of giving a cut of revenue to their upstream distribution. It just might be surprising to hear that device vendors like Samsung and carriers get a piece of Search and apps.
This basic observation leads to a series of questions:
How much is paid out and to whom?
Is that revenue sharing sustaining the ecosystem? Do vendors create Android devices and do carriers push Android to consumers because they get this revenue share or is the amount insignificant vs. device margin? What about tablets? Why haven't Android tablets they taken off as Android phones have? Are the economics to blame?
Is this a competitive advantage vs. other platforms? Does Windows Phone compete with revenue share for Bing? Is Microsoft offering a bigger carrot (as well as a stick?)
How does this economic picture show up in Google's financial and stock price performance? Or, more precisely, why doesn't it?
And, finally, what conditions create a virtuous cycle of growth and what conditions could turn it into a vicious cycle of decline? Is there a lurking factor which would cause Google to benefit greatly from this user base or is there an inherent point of failure in the model?
I'll be answering these questions in a series of posts this week.
--
Notes:
Google's internal documents were leaked as part of the Oracle trial (Exhibit 1061). They can be found by using Google search with the following search term: "OC quarterly review".
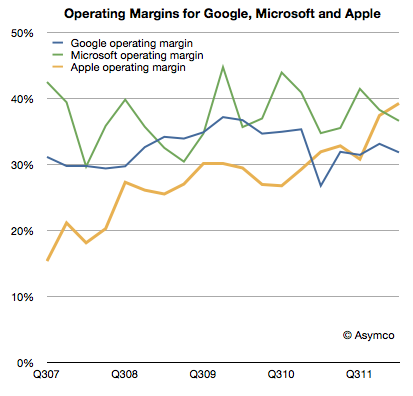
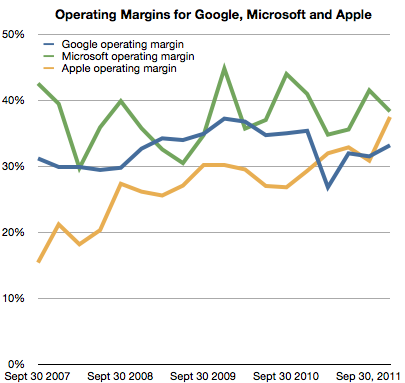
Apple's recent margins are nothing short of spectacular. It's hard to convey just how remarkable 47% gross margin and 39% operating margins are. For a company that sells hardware these are simply unheard-of numbers.
The best way I can illustrate this is by comparing Apple's operating margins with those of two other platform-based companies, Google and Microsoft.
Microsoft invented the software-as-a-business model and, as software is easily reproduced, their margins are phenomenal. The gross margins are typically in the 80% range for software. Overall, the company had higher R&D and SG&A expenses so their operating margins are a more modest 37% on average. However, Apple managed to exceed this value even though it has the disadvantage of actually having to build things made of atoms.
Google also has led a charmed life free of inventory and factories. Its operating margins have been however hurt by investments needed to sustain the infrastructure for indexing the internet. That means that their margins have hovered around 33%.
As the chart above shows, Apple has been creeping up on both these benchmark companies with exceptional operational leverage and, as of this last quarter, overtaken them.
The reason Apple is able to do this is that its iOS businesses are extremely profitable and, as those businesses grow in absolute terms and relative to its other businesses, the overall margins are reaching into the stratosphere.
The impact of iOS on Apple is shown in the right-most two charts below. The difference in growth relative to these other great companies makes Apple all the more impressive.
But the temptation is to compare the "core" business models and ask which is best: hardware, software or internet services. It would seem that hardware is winning, suddenly getting the best margin and best growth--a dramatic reversal with prior technology business dogma.
However, it would be a mis-reading of what allows Apple to succeed. Apple is the most valuable company in technology (and indeed in the world) because it integrates hardware, software and services. It's the first, and only, company to do all these three well in service of jobs that the vast majority of consumers want done.
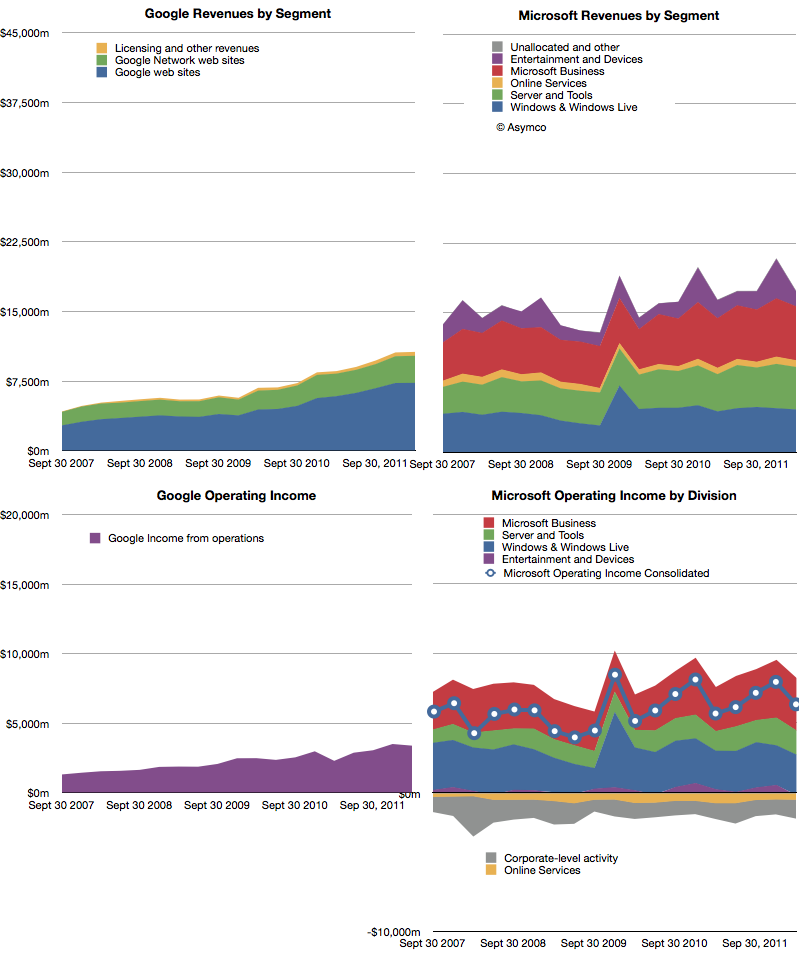
The following charts show Google and Microsoft revenues and operating income:
Both companies showed healthy growth. Revenues: Microsoft 6%, Google 24%. Operating Income: Microsoft 12%, Google 48%. Google had a particularly weak margin Q1 2011 so its income growth appears very strong.
The surprise in Microsoft's performance was the 4.8% increase in Windows revenue at a time when PC sales were expected to be declining or flat. Final PC numbers are not yet out so we'll have to check back on this figure to see whether Microsoft has been able to get higher pricing for Windows or whether the market did expand. (Average revenues per PC sold have been quite steady for years). Overall, Microsoft's business shows consistency. Of course, that should not be cause for comfort. Nokia had remarkable consistency until it jumped from a burning platform and RIM grew more rapidly until its platform imploded.
As Google still obtains 96% of its income from advertising, it's quite remarkable that it is now at 61% of Microsoft's revenues. Google is also growing more rapidly than Microsoft so the possibility exists that the top ad service will overtake the top software company in revenue, establishing a new benchmark for how software can be monetized.
The curious thing about both of these companies' financial performance is that mobility does not appear to have had any impact on either top or bottom lines[1]. There is no business division or income statement line that can be attached to mobile revenues. Microsoft placed Windows Phone under Entertainment and Devices but that division is dominated by Xbox and accessories. Google bundles everything under Advertising and has never broken out mobile, much less Android-derived income.
The surge in valuation for mobile-focused startups seems to leave investors in both these companies unaffected. The damnation for both companies lies in mobility being non-core businesses whose strategies center on reaction and defense.
---
Notes:
Google does not answer specific questions about the impact of mobile on their business but they do acknowledge that there are traffic acquisition costs (TAC) associated with OEMs and Carriers who deploy Android. This means that there are costs of mobile sales (i.e. Search) but not to any measure of specific value.
Charles Arthur, writing for The Guardian, has noted that court filings seem to be revealing Google's Android revenues. If this is the case, we have a significant breakthrough in understanding the economics of Android and the overall mobile platform strategy of Google.
The new data is a reference to a settlement offer Google made to Oracle of $2.8 million and 0.515% of Android revenues on an ongoing basis. The key assumption to make this data useful is that the $2.8 million offer represents 0.515% of revenues to date.
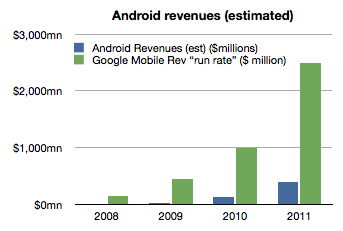
In other words, that revenues from 2008 to end of 2011 multiplied by 0.00515 results in $2.8 million. That implies that revenues from 2008 to 2011 were $544 million.
I think that's a fair assumption. I don't see why Google would offer a higher or lower royalty rate for years 2008 through 2011 than for years after 2011. The offer would seem to be 0.0515% in the future as well as retroactively in the past.
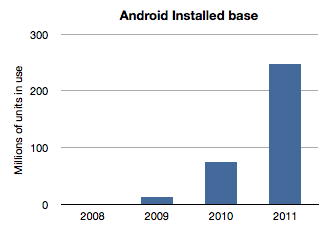
If we work with this assumption then the next question is how to distribute this $544 million over the four years 2008 through 2011? The installed base of Android has grown exponentially and it would seem logical to assume that revenues have followed in a similar pattern. Here is a chart of installed base given activation data supplied by Google.
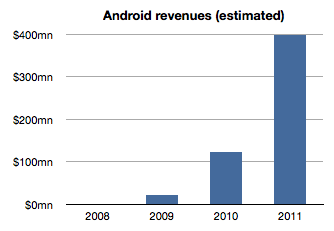
If we assume revenues were distributed the same way we would get something like this:
The sum of the bars in this chart equals $544 million and the ramp is approximately the same as the installed base. The relationship between the first graph and the second is a multiple equivalent to the revenue per device.
Therefore a second assumption is that revenue per device remained fairly constant. In this model the revenue comes out to be about $1.70 per device per year. It's possible that rev/dev/yr. is increasing as Google services are discovered by users. It's also possible that the rev/dev/yr. is decreasing as later adopters are less likely to engage as early users. I just don't know how to adjust this value so by leaving it at the average, I can avoid introducing more assumptions.
Now we can stop and look at this figure and do a test. Does $1.70 make sense as a device revenue for Android? Google had spoken about targeting $10/device/yr. but we have no indication that they are nearly at that level. If they did achieve that level, with an installed base of 300 million, Google could be collecting $3 billion a year in Android income. Are they getting it?
As of October, Google mentioned that it had a $2.5 billion "mobile run rate". But we know that this figure is not only from Android. Mobile includes all mobile devices and services including those running inside iOS, Symbian, BlackBerry, Windows Phone, etc. They could be counting ads on all mobile browsers as well as ads running inside all apps on all platforms. Furthermore, Google also testified that iOS accounts for two thirds of their mobile search revenues[1].
Adding run rate to the Android revenue chart results in the following:
So the step is to take the "run rate" figure of $2.5 billion and assume, as Charles Arthur did, that iOS income is what is left after taking out the Android part[2]. I also noted that Google previously mentioned a run rate of $1 billion and I will assign that run rate to 2010 and $2.5b to all of 2011. Since we know the number of iOS devices in use for years 2010 and 2011 we can calculate Google's revenues per iOS device in use.
If we thus combine all the data we know (revenues derived from settlement offer, units in use, run rate and iOS installed base) we get the following revenue profile:
This shows a positive trend for Google: revenues per smartphone per year is increasing. However, the growth is coming from non-Android devices which means mostly iOS. Revenues per device for Android is probably declining.
The story for iOS revenues however is not all rosy for Google. Google has to pay for that revenue. The mechanism is a payment that Google makes to Apple for the prominent and default placement of Google search on Safari.
We don't know the terms of the arrangement but if we assume $2/device Google needs to shave $2 from the top of the chart above with that money going to Apple (attached as iPhone/iPad service revenues.)[3]
That still leaves a healthy $8.33 in 2011 as operating income from mobile with $1.70 or so coming from Android.
However, to make this operating income into bottom line profit, we have to extract the R&D and SG&A associated with mobile at Google. This would be, therefore, Andy Rubin's yearly budget.
Andy Rubin has stated in the past that Android is profitable. That is certainly believable. The budget would have to be about $400 million/year in 2011.
Charles Arthur concluded that Google obtains four times more revenue from iOS than from Android. My estimates indicate that in 2011 the revenue ratio was closer to 5 but if we subtract the cost of those sales in the form of payments to Apple then the ratio could well be four to one.
Many of these figures begin to "hang together" as we balance assumptions about costs, revenues and statements made in public. There is a consistency within a comfortable margin of error. If that is the case, then the economics of Android begins to take shape.
My take is that it's not a bad business. But it's also not a great one. As long as there is exponential growth in units, Android will improve its position inside Google relative to iOS. But from Google's perspective, iOS is today a bigger business. And iOS is not standing still. It's growing not only in terms of units but in revenue per unit.
Strategically, and historically Android was never one thing. P&L considerations were not the only (or even at all) factors in investment for Google. Having a hedge against hegemony of potential rivals, having a means to learn and develop new business and having a role in defining the post-PC computing paradigm are all probably bigger considerations than profitability.
So in terms of returns, Android is sustainable. However, in relative terms the value created leaves much to be desired. Whereas Android generates $1.70/device/year and thus an Android device with a two year life generates about $3.5 to Google over its life, Apple obtained $576.3 for each iOS device it sold in 2011[4]. The economics of Android are nothing like the economics of iOS.
---
Notes:
This figure is also not conclusive as search is not the only form of revenue on a mobile device but it does imply that Android is not the majority of Google's mobile revenues.
Clearly this is overstating iOS as the non-Android income is broken up between several platforms. We can only say that iOS is the vast majority of non-Android income.
Assuming a $2/device payment model means Google paid $312 million to Apple in 2011 and $171 million in 2010. This would go toward boosting Apple's revenue per iOS device. Naturally, if this distribution cost is higher or would be subject to re-negotiation then it could vary widely.
The iOS figure includes accessories and licensing of trademarks but excludes income from App Store, iTunes music, movies, TV shows, iBooks, greeting cards or textbooks.
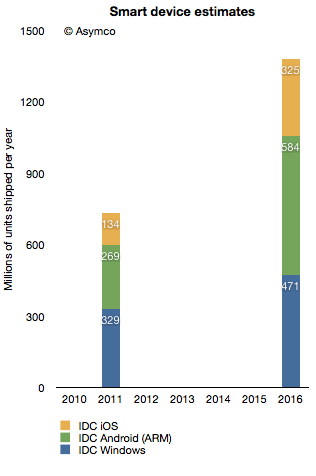
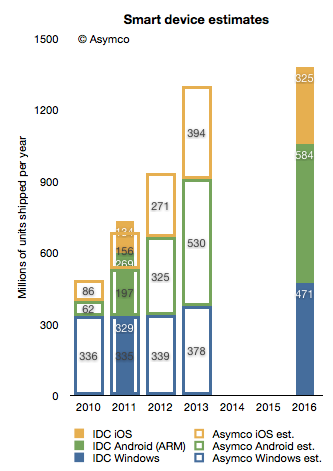
In terms of platforms, IDC expects a relatively dramatic shift between 2011 and 2016, with the once-dominant Windows on x86 platform, consisting of PCs running the Windows operating system on any x86-compatible CPU, slipping from a leading 35.9% share in 2011 down to 25.1% in 2016. The number of Android-based devices running on ARM CPUs, on the other hand, will grow modestly from 29.4% share in 2011 to a market-leading 31.1% share in 2016. Meanwhile, iOS-based devices will grow from 14.6% share in 2011 to 17.3% in 2016.
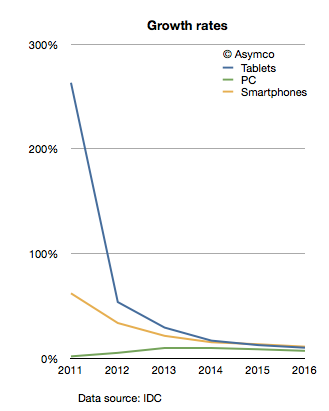
The company provides a stacked bar chart (follow link above) to illustrate their view of the market. I took the data they included and measured the implied growth rates for the product categories:
IDC is implying that in four years the tablet market will be growing at 10%, the Smartphone market will grow at 11% and the PC category will grow at 11%. In other words, five years from now the PC market is expected to grow faster than the tablet market and just as fast as the smartphone market!
What's more remarkable is that this situation is not going to happen in four years. The slowdown in growth is actually expected much sooner. The growth rates two years from now are expected to be: Tablets 17%, Smartphones 15% and PC 10%. IDC is unequivocal: by 2014 the good times will come to an end to the post-PC challengers. These growth rates would be catastrophic for share prices and the value propositions of the new platforms to developers, partners and consumers.
What's more, these growth rates are striking not only because they predict a collapse in the value of most market challengers but that they also predict a strongly resilient PC market. How can we test this forecast?
I tried to reconcile this doomsday scenario with what is known about the components making up the data. I.e. what "bottom-up" data is IDC using? In the quote above, IDC offers some insight into this market participant data. Based on the category and share data they published it's possible to infer the following:
Bearing in mind that neither iOS nor Android existed five years ago, we can observe they are bigger together than the PC market. And yet, IDC predicts a compounded average yearly growth rate of 16.7% in Android, 19.4% in iOS and 7.5% in Windows between today and 2016.
In aggregate, IDC forecasts that in the next five years Android will not manage to double and that iOS will only increase by a factor of 2.4. Is this believable?
I try to stay away from long term forecasts, but I do maintain a short term forecast based on recent growth data. My forecasts for this year and next year are shown below.
I super-imposed my short-term forecast (outline bars) on IDC's long term forecast (solid bars) and a several differences become apparent.
First, my 2013 forecast is nearly the same as IDC's 2016 forecast. To see why we need to look at each platform separately.
Perhaps we might (with difficulty) agree on Microsoft's potential. I believe Windows 8 will have a catalyzing effect and that Microsoft will begin to see its platform grow again. However, my expectations are modest. To increase Windows sales rate by 100 million units/yr between 2013 and 2016 is possible but ambitious.
The real problem is that our Android and iOS forecasts are outside any zone of possible agreement. Maybe there is a difference in what we measure. For a hint, we seem to disagree on the number of Android devices shipped in 2011. I used Google's own reports of activations to work out the yearly shipment estimates. Perhaps IDC is including versions of Android that are not Google sanctioned.
We also disagree on the 2011 iOS figures. I obtained 156 from Apple's own reports. Again, perhaps the difference is the inclusion of the iPod in my case.
Nevertheless, the difference in the long term cannot be accounted for only through these categorization differences. I would put the cause of the difference down to the methods used in forecasting. As can be seen from the first chart above, IDC's growth rate reductions are extraordinarily steep. Perhaps the approach used by IDC was to forecast the overall market growth and then assignment of shares to participants. This can be called the "top-down" approach. In contrast, my approach is to forecast growth rates based on recent growth rates and moderating these rates gradually. This can be called the "bottom-up" approach.
My experience and all the data I've ever collected about historic disruptions tell me that the entrants tend to win these types of paradigm shifts. They win through a vast expansion of consumption and the recruitment of non-consumers. Markets tend to experience vast shifts in composition. If we believe this to be true then the bottom-up approach focused on entrants is likely to be more effective vis-a-vis the top-down approach of projecting steady state markets and the implicit assumption of incumbent share preservation.
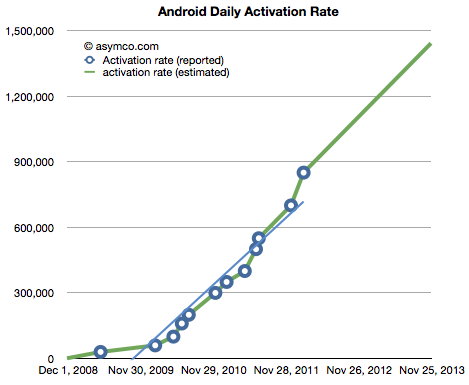
The latest data from Google shows that the Android activation rate is increasing at a relatively steady rate (i.e. acceleration is constant). The data provided so far is in the blue circles below. The green line is the interpolation and extrapolation of that data.
As the graph is projected forward we get an activation rate of one million per day by mid August of this year. If it continues then we could see 1.5 million per day by end of 2013.
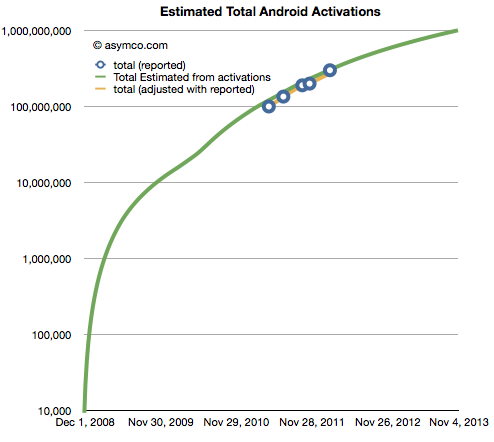
The corresponding number of cumulative activations is shown on the following log chart (with blue circles showing the actual data and the green estimates.)
The forecast is therefore that Android activations will cross one billion by November 2013.
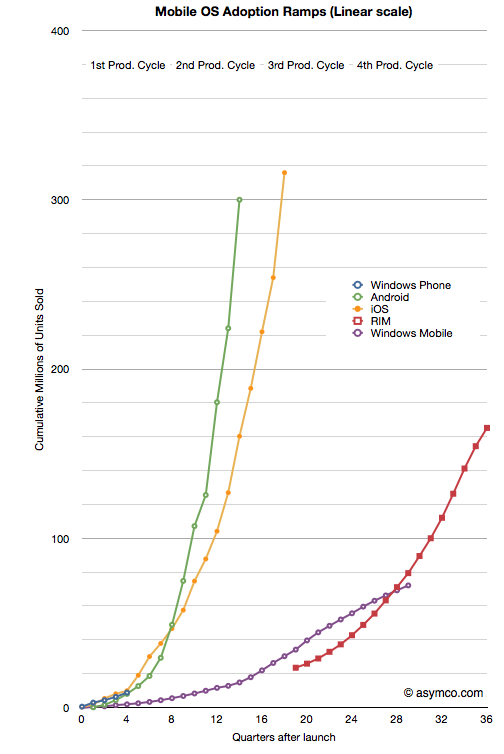
The following chart compares the growth ramps of the various mobile operating systems indexed from the same starting points (measured in quarters after launch).
If Android does keep accelerating at the same rate then it will reach a billion users in five years. Of course, this total will not be a unified ecosystem in that many versions of Android will be co-existing. There will also be additional variants of Android which will not include Google services (these are not included in the totals above) which will compete to some degree with this platform.
However, it's still an amazing story. The crucial question is whether the billion Android phones will have an effect on the opportunity for new entrants like Windows Phone and future BlackBerry variants as well as Bada and other Linux-based platforms.
The answer is that there will be well over 6 billion mobile "connections" by the end of 2013. ITU reports that "By the end of 2010, there will be an estimated 5.3 billion mobile cellular subscriptions worldwide, including 940 million subscriptions to 3G services." It follows then that if this forecast is correct then by the end of 2013, Android will have about 17% penetration of the connections market.
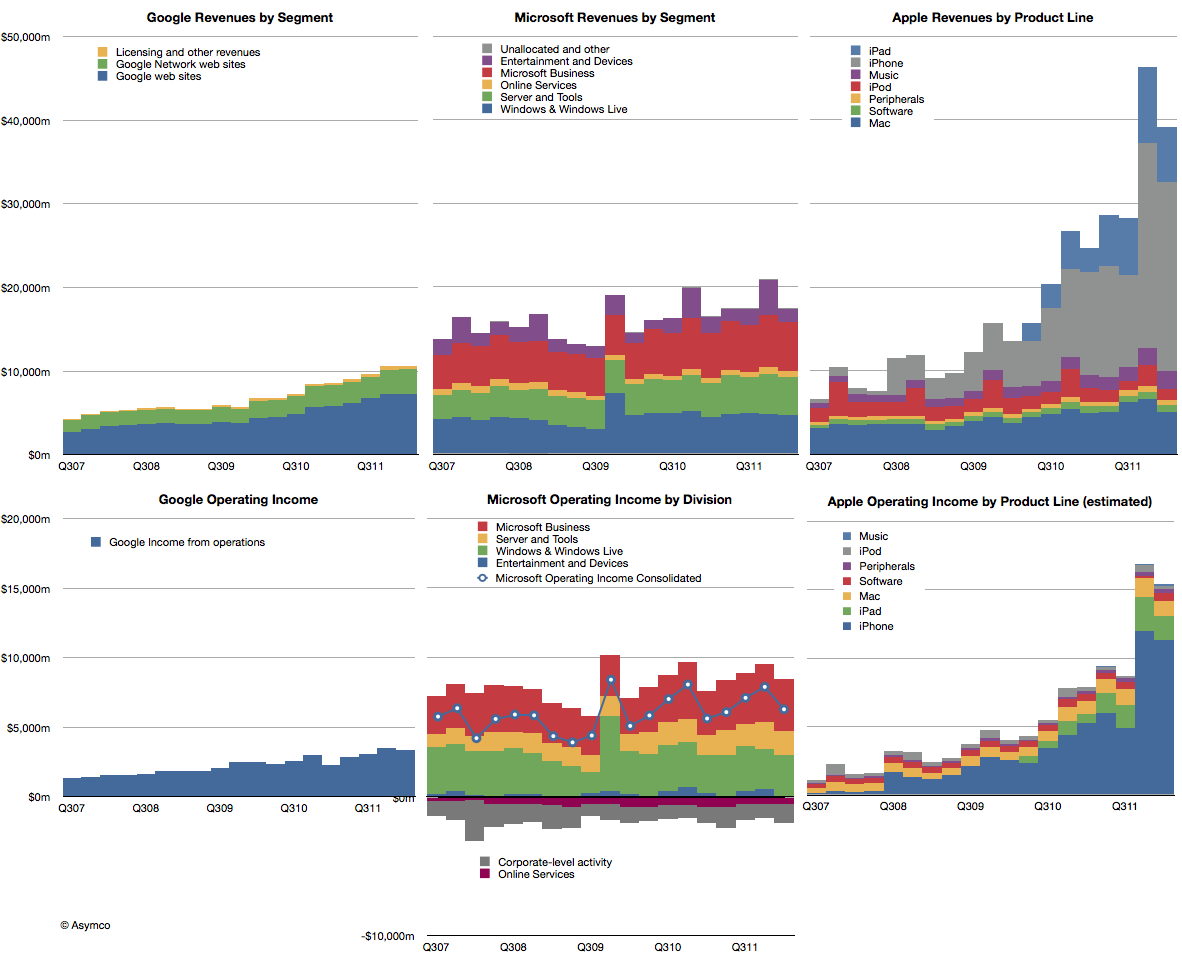
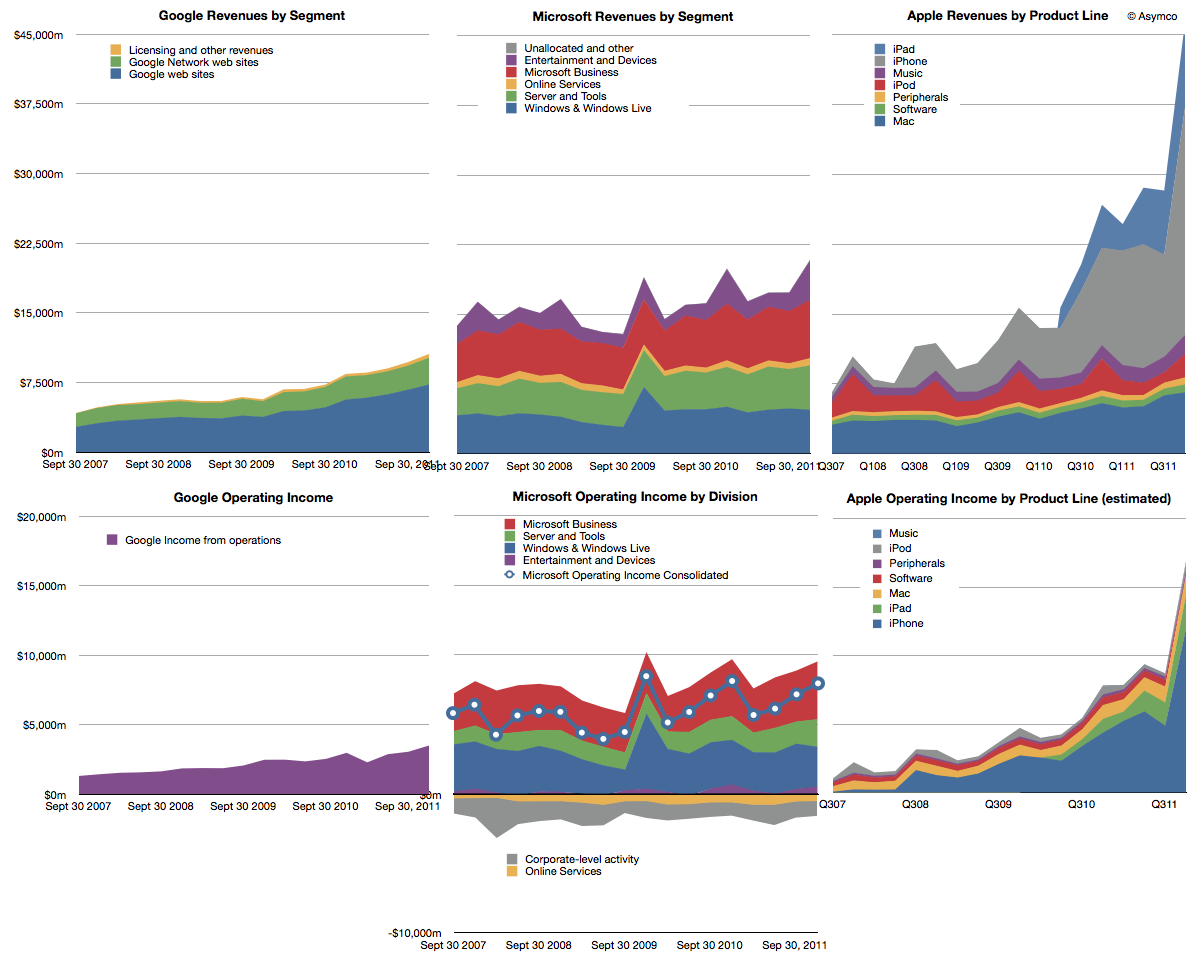
Last year we began offering revenue and operating income comparisons between Apple and Microsoft. It was becoming evident that the iOS franchise was beginning to overtake both in revenue and profitability the Windows franchise. To offer more dimensions of comparison this time I am adding Google's top and bottom lines for comparison (click image for detail):
Note that the graphs have the same scales when read horizontally. I've broken out the sub-divisions of revenues as the companies report them. Here are some observations:
The time spanned is 4.5 years (September 2007 to December 2011)
If we compare the fourth quarter 2007 to fourth quarter 2011 the ratio of Google : Microsoft : Apple went from 1: 3.39:2:16 to 1:1.97: 4.38. In other words, Microsoft was 3.4 times bigger than Google but today it's only about twice. Apple was twice and is now about 4.4 times bigger.
In terms of operating income (i.e. before R&D, SG&A and OI&E) the ratios were 1:4.48:1.53 and are now 1:2.28:4.82. Microsoft's income gap to Google halved while Apple's more than tripled.
Google and Microsoft have grown but not by adding new sources of revenue. Apple grew its base but, more importantly, added new businesses for spectacularly more growth.
Compared to Microsoft and Apple, Google's revenue is distinctly single-source: advertising. Though divided between own sites and those of affiliates, advertising is today 96.1% of revenue and was 98.6% four years earlier.
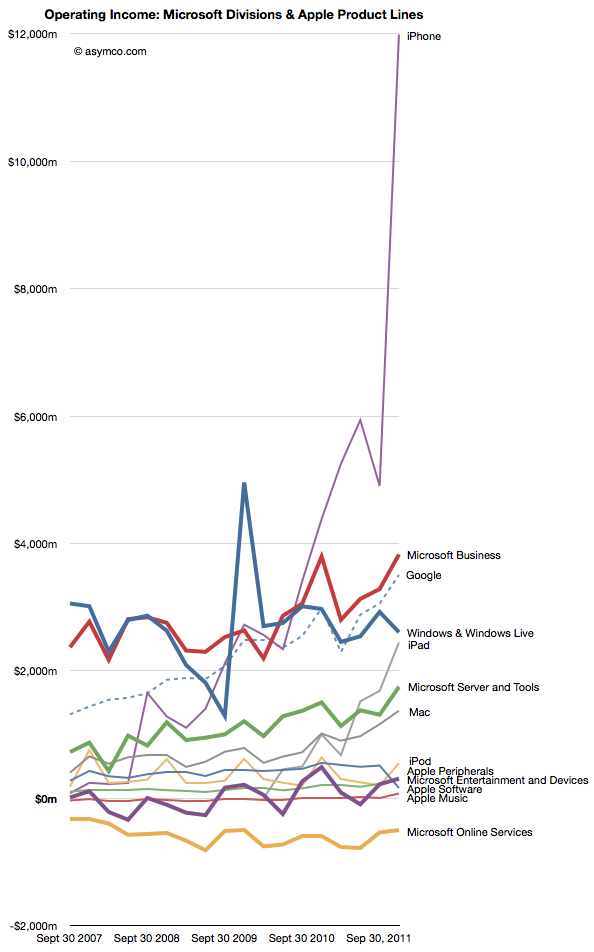
If we compare the individual product/business operating incomes individually we see some interesting patterns:
Google's advertising profits have overtaken Windows as has the iPhone and the iPad may do so quite soon.
Microsoft's Business (Office) and Server businesses are growing more quickly than Windows
The hardware oriented Apple' operating margin is now 37% and exceeds Google's 33% while being nearly equal to Microsoft's 38% (see chart below)
I presented a subset of this material January 30th at a TechMeetups event titled "Apple - world's biggest startup." A presentation by Adam Lashinsky focused on the cultural and procedural aspects which highlight Apple's "startup" nature. My presentation showed, using these graphs, Apple's growth characterizes it as a "startup". The growth did not come from a broadening of its core products markets. It came from the creation of new product categories. Google, a much younger company does not exhibit this non-secular growth any more than Microsoft which is about as old as Apple is.
The lesson is perhaps that rapid growth is not the right of small companies alone. Apple has used disruptive innovation to transform itself and offers a stunning contrast to two other companies which are also seen as innovative leaders.