Asymco

Asymmetric Intelligence

Huawei

  1. Asymco Bulletin 010 - Apr 26, 2026
    Bulletin

    Asymco Bulletin is a digest of all the work we have published for the week ending Apr 26, 2026.


    Office Hours
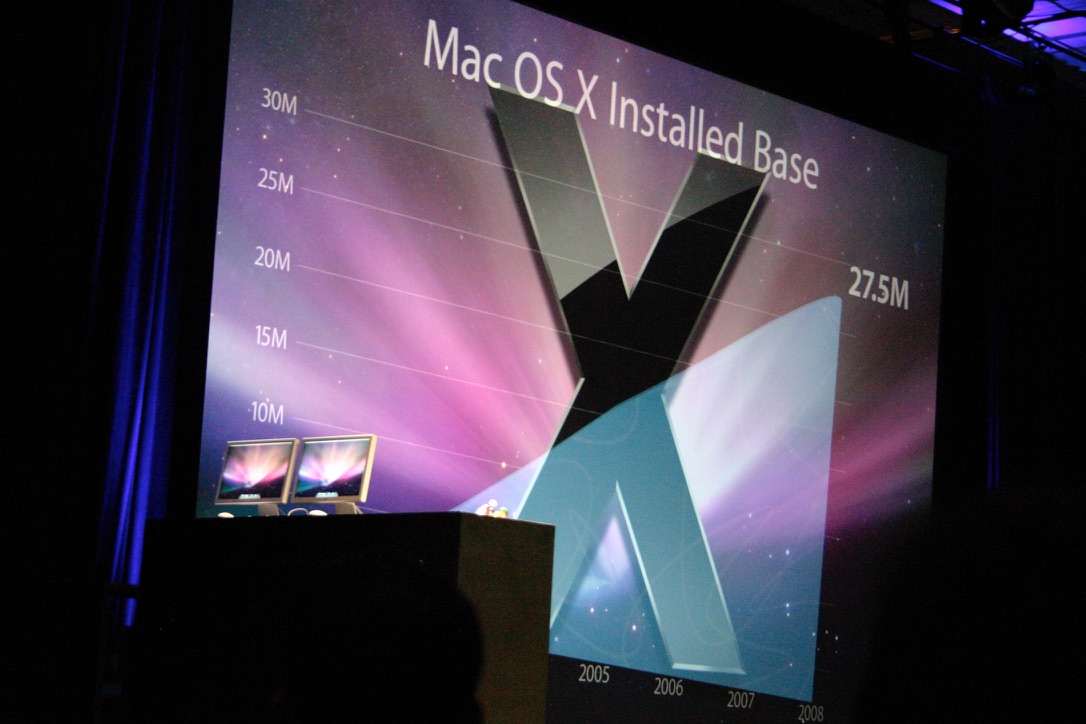
    WWDC June 9th, 2008, Photo by Author

    Office Hours Live Q&A with Horace Dediu: Friday May 1, 2026 → Join Asymco One for an exclusive Office Hours Live Q&A to delve into Apple's landmark quarter and ask your questions—register now and bring a guest!

    Listen to: Apple Earnings Call →
    Thu, April 30, 2026 5PM ET / 2 PM PT

    Join our Live Discussion →
    Fri, May 1, 2026, 12PM ET / 09AM PT


    Research

    Succession, study of the firm vs. study of the person

    A part of Horace's interview with Asahi Shimbun on the 50th Anniversary of Apple's founding. The portion here discusses management succession and occurred on April 1. Apple announced the succession of Tim Cook as CEO to John Ternus last week. This analysis of Apple leadership decisions focuses on culture and attributes of the firm rather than attributes of the persons leading it. It may prove a more reliable predictor in future leadership changes.

    …, the speculation is John Ternus is the next in line. I think that's a very plausible hypothesis. And one reason, by the way, is I always maintain if you study the company from a cultural point of view, you'll realize that there are people who cannot be CEO. You may not know who it's going to be, but I can tell you who won't be. Many people over the years suggested candidates, and I would say no, never. And here are examples. Johnny Ive would never be CEO. An external hire would never be CEO. Even a head of marketing would never be CEO. Many people think that Apple is a brilliant marketing company. No, it's an engineering company. It's a huge secret out there. →

    John Ternus has left big shoes to fill

    Writing the story of John Ternus' tenure as Apple CEO from April 21, 2040. What changed and what didn't.

    It’s been 15 years but John Ternus has finally stepped down as Apple CEO. Analysts described the transition as expected rather than disruptive, noting that investors had long anticipated Ternus’ eventual departure. Nevertheless, he leaves with many questions still unanswered about Apple’s long term strategy. Apple incoming CEO faces a defining challenge: Fixing the company’s Services dependence. It’s been a tumultuous tenure for Ternus but he is leaving with significant accomplishments: John grew Apple devices to 4.5 billion from 2.5 billion when he took over in 2026. Many have pointed out that he has been building on… →

    The Composition of Active Devices
    The Composition of Active Devices

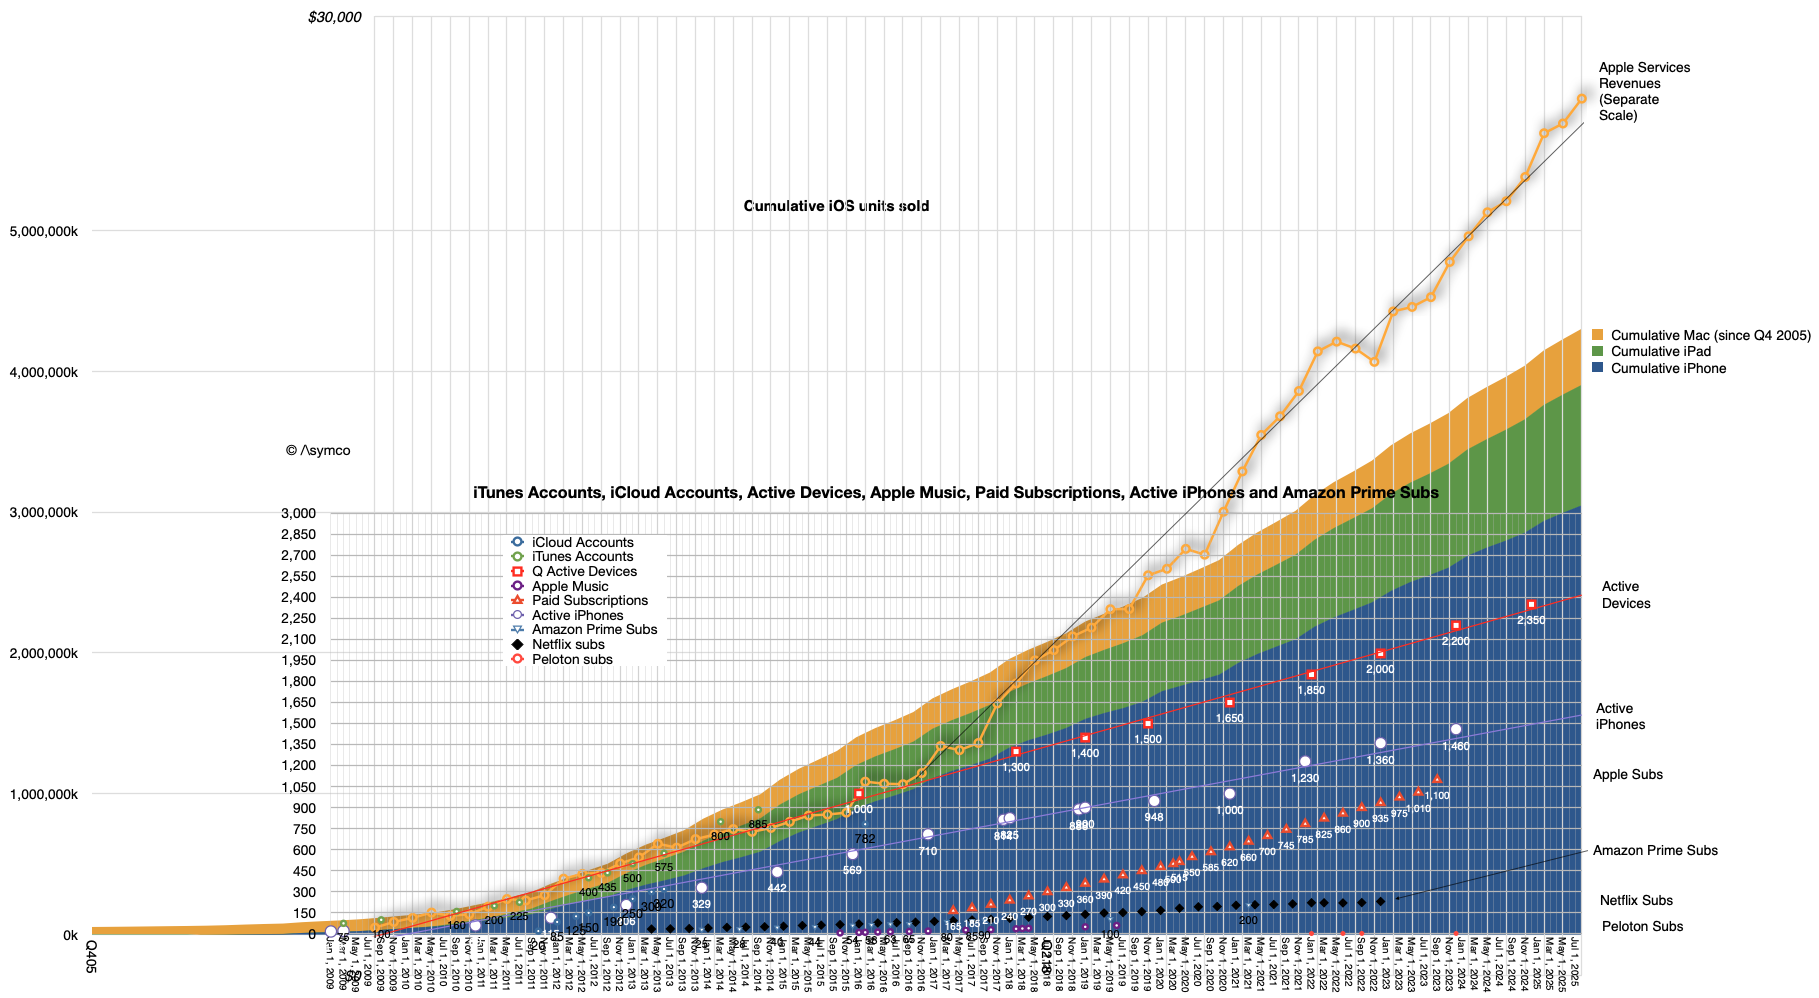
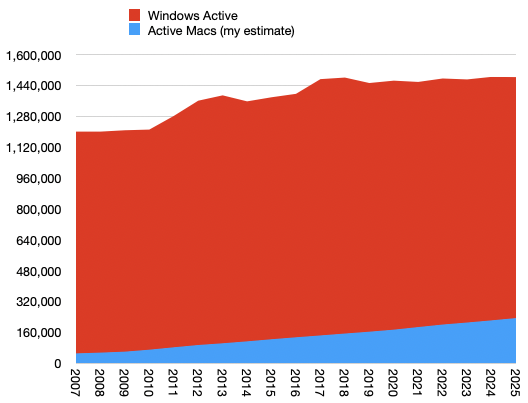
    In January this year Apple reported that there were 2.5 billion active Apple devices in use. This figure has been getting updated for years and I’ve been reporting its trajectory and other measures that are correlated to it. For instance the number of Apple subscriptions, Apple Services revenues and other historical indicators such as iCloud accounts and Apple Music.

    Simplifying, I published the “ACTIVE” model which makes some basic projections of this total device count and it’s shown below” One element of the analysis that has eluded me was the more precise composition of this total “devices”. →


    Nota Bene

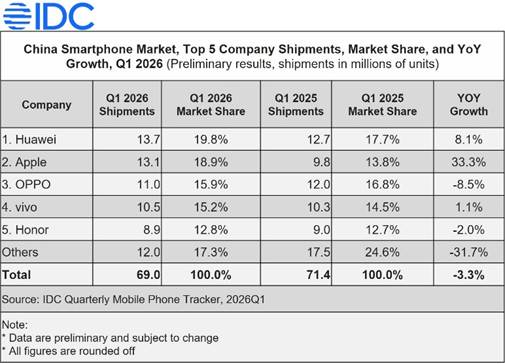
    IDC: Apple Grows 33.3% in China as Market Declines 3.3% in Q1 2026
    IDC: Apple Grows 33.3% in China as Market Declines 3.3% in Q1 2026

    IDC: Apple Grows 33.3% in China as Market Declines 3.3% in Q1 2026 → CounterPoint reports a 4% YoY decline in China's Q1 2026 smartphone shipments, with Huawei and Apple holding nearly equal shares around 20% each, as memory shortages impact the market.

    Both researchers say Apple share in China is about 19%, nearly tied with Huawei at 20%…

    Some analysts are increasing their targets finally realizing that the memory supply crisis might be beneficial to Apple. This should have been noted already three months ago when Apple provided extraordinary guidance for the March quarter. →


    MacBook Neo Sold Out Through April
    MacBook Neo Sold Out Through April

    MacBook Neo Sold Out Through April → Despite high demand and stockouts, Apple's strong brand and competitive pricing could turn challenges into opportunities for market expansion.

    Microsoft’s cheapest laptop is three times more ex…

    As I will argue in a further post perhaps this is one of those pivotal moments. →


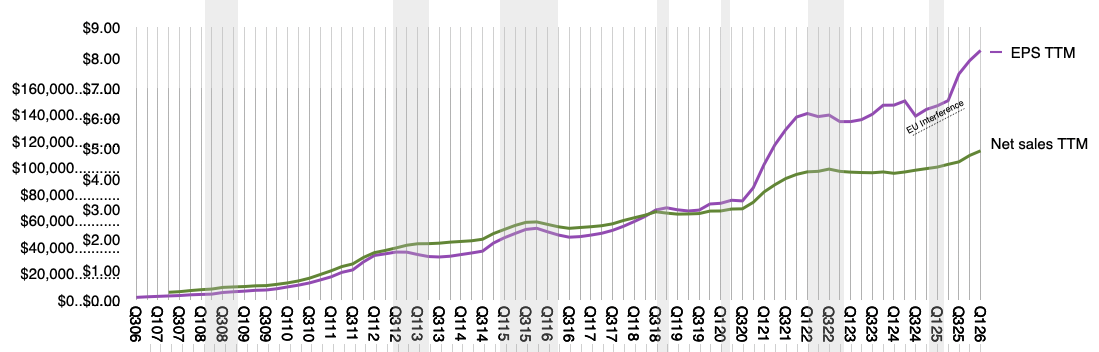
    Goldman forecasts fiscal second-quarter EPS of $2.00
    Goldman forecasts fiscal second-quarter EPS of $2.00

    Goldman forecasts fiscal second-quarter EPS of $2.00 → Goldman Sachs remains bullish on Apple, forecasting $2.00 EPS driven by strong iPhone and Services growth, dismissing overly pessimistic sentiment as the company consistently gains 100 million new customers annually.

    My target of $1.98 seems amiss.…

    What is always happening, the reaction that is always ongoing, is the creation of 100 million new customers every year. Accelerating this process is not a matter of just new products or change in sentiment with AI. Much of this rate is due to overall global economic and demographic change. →


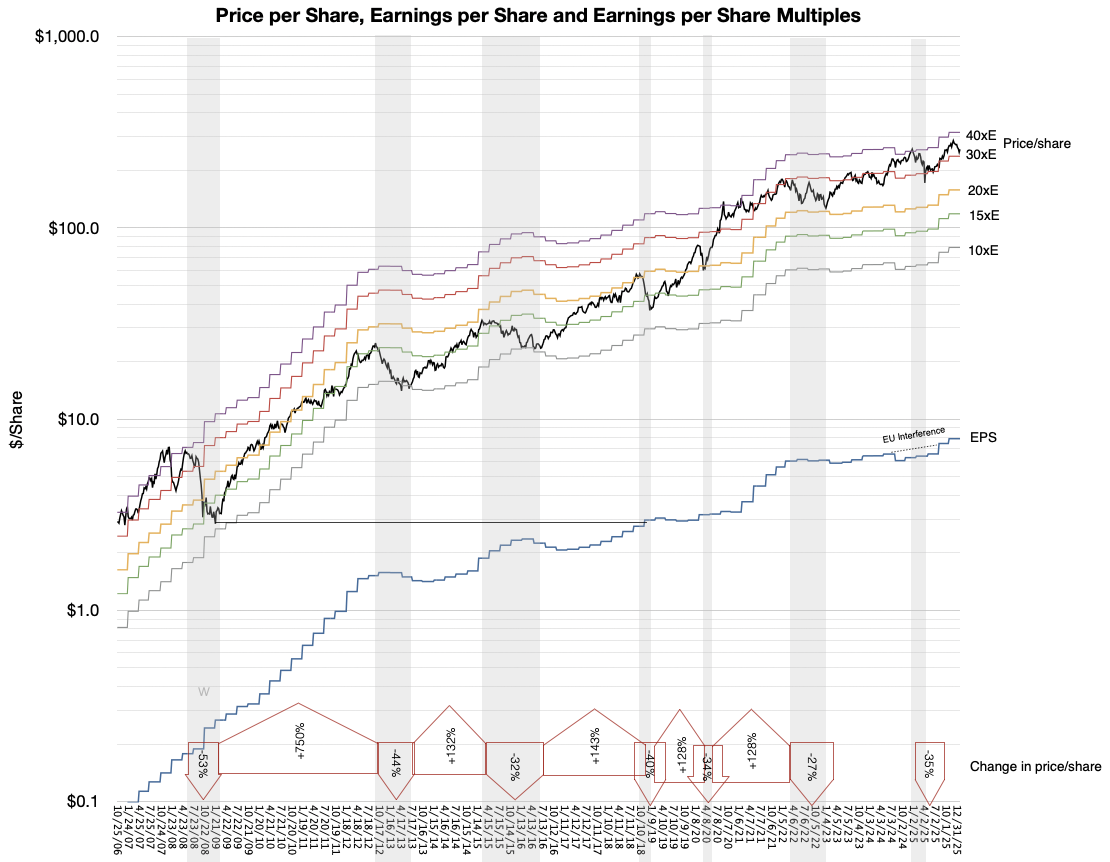
    What’s the consensus on $AAPL?
    What’s the consensus on $AAPL?

    What’s the consensus on $AAPL? → Apple's strong analyst backing with a 15:1 Buy:Sell ratio and $315 target contrasts its 39% year-to-date rise, overlooking potential future growth.

    The consensus is positive though share price target does not consider significant share gains and service growth acceleration into 2027.

    NB: The consensus is positive though share price target does not consider significant share gains and service growth acceleration into 2027. →


    Apple 3.0: JP Morgan expects that Apple will beat its own guidance next week

    Apple 3.0: JP Morgan expects that Apple will beat its own guidance next week

    Apple 3.0: JP Morgan expects that Apple will beat its own guidance next week → Analyst Samik Chatterjee projects Apple's EPS to rise to $2.05 from $1.96, driven by strong iPhone and Mac demand, with a revenue boost to $112.7 billion, while I estimate a slightly lower 20.2% EPS growth, anticipating guidance will be met.

    Read the original for a more detailed commentary from Chatterjee. He implies Apple will grow EPS 24%…

    …My own estimate is about 20.2%. I look forward to a lively quarterly update. The primary source of growth must be the iPhone and I have that growing at 19% revenue growth. Last quarter the growth was 23%. Perhaps Chatterjee is assuming a similar growth rate into March quarter. That is not impossible but I am assuming guidance will be met rather than exceeded. →


    Asymco One gives you full access to our research, analysis, and commentary. Subscribe with code BULLETIN for a discount.

    Feedback: Have questions or comments? Reach out to us at contact@asymco.com. We’d love to hear from you.
  2. IDC: Apple Grows 33.3% in China as Market Declines 3.3% in Q1 2026

    Nota Bene

    Counterpoint says 20% and -4%

    China smartphone shipments fell 3.3% in Q1 2026 to 69M units, with Huawei and Apple driving premium demand despite rising costs and supply constraints.

    Source: IDC

    Separately, CounterPoint research reports;

    China’s smartphone shipments declined 4% YoY in Q1 2026, as memory shortages disrupted supply and drove up costs across OEMs.

    Huawei led the market in Q1, supported by its domestic supply chain advantages and stable pricing. As a result, the brand recorded its highest-ever quarterly share in China since Q4 2020.

    Apple delivered the strongest growth among the top six brands, and it is widely seen as best positioned to navigate the memory crunch.

    NB: Both researchers say Apple share in China is about 19%, nearly tied with Huawei at 20%…

  3. iPhone only Smartphone to Grow in China this January

    Nota Bene

    Market that was down 23% overall

    Every major Chinese mobile maker, from Huawei Technologies to Xiaomi, saw major declines in a market that was down 23% overall, largely due to reduced subsidies and a shift in the timing of the Lunar New Year, Bloomberg News reported, citing Counterpoint researchers.

    The iPhone 17 lineup, however, helped Apple to 8% growth, raising its share of the market to roughly a fifth, sharing the lead with Huawei. Cupertino, California-based Apple has seen its flagship product stage a major comeback since the September introduction of new models.

    “Apple stood out as the only major brand to achieve year-on-year growth, and its market share reached the highest January level in the past five years,” according to the researchers. “The iPhone 17 base version now qualifies for government subsidies, boosting its value-for-money appeal and driving a 9% month-on-month sales increase.” 

    Source: Seeking Alpha via Apple News

    NB: Still wondering if it's the new orange color that's the reason for the iPhone's success in China?

  4. Faster Followed

    Research · 76 comments

    Samsung's smartphone ascent was breathtaking. From having essentially zero market share in the category in late 2010 to becoming the largest vendor took less than two years. In doing so it grew to become the largest phone vendor, smart or not--a goal which eluded them during the previous decade of effort. Samsung went on to capture not only the lion's share of unit volumes, they also took almost all the profits in the Android mobile phone market.

    And in a market filled with competitors. Literally hundreds of vendors and thousands of products were available at every conceivable price point. Samsung did away with HTC, LG, and Motorola. HTC, the first Android vendor (and first to market with Windows Mobile), Motorola, Google's launch partner in the US and "Droid" brand partner (and future owner).  Google's own Nexus products. Samsung Galaxy ruled them all.

    Galaxy swamped the Chinese market and the Indian market, the largest in the world. They were so powerful that they were singled out both by Microsoft and Apple for IP royalties.

    All within two years or the average life-span of one smartphone.

    But something went wrong in 2014. Growth in shipments suddenly stopped. This was not a problem with the overall market, which kept growing. The slowdown did not affect other vendors, especially the up-and-coming Lenovo and Xiaomi and the second and third tier vendors whose names are  known only in the local markets they serve.

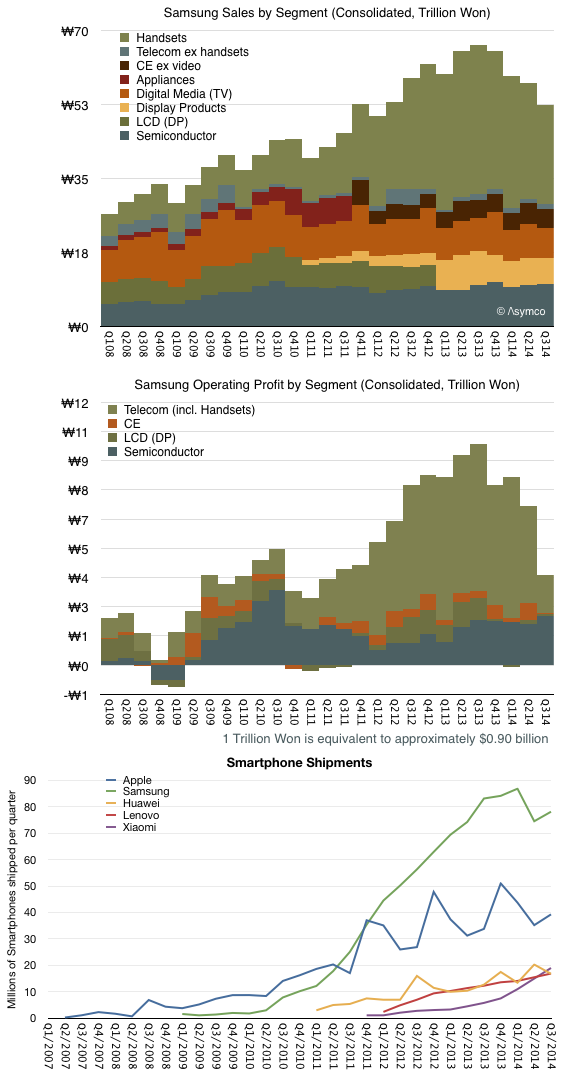
    The result of this slowdown is shown in the following graphs:

    <>

    Screen Shot 2014-10-30 at 10-30-4.11.19 PM

    Note how the wobble in units shipped was foretold by slowing revenues and an even more profound effect in profits. Peak revenues and profit occurred in Q3 2013 while volumes continued to grow until Q1 2014. Even in the last quarter, shipments are at near year-ago levels. Profits however have dropped to 2011 levels.

    At the same time, Apple shipments continue to grow as do those of Lenovo, Huawei and Xiaomi. Xiaomi in fact is growing in a trajectory eerily parallel to that of Samsung from 2010. It just hit the same level of volume that Samsung had in Q2 2011. And Samsung had been making phones for decades while Xiaomi is barely two years old.

    Having seen a boom/bust rise/fall pattern with other vendors (e.g. Nokia and Blackberry) it should behoove us to ask what are the causes of success and failure in this business. Samsung management suggests that they perceive speed of action, product mix/portfolio choices and hardware experimentation are the keys to their success.

    However, competitors which are rising rapidly (at the expense of Samsung) are not acting in the same way. Xiaomi is patterned as a Chinese Apple, offering design, brand, attention to detail and software as differentiation. Lenovo is building on its computing roots and expanding with acquisition. Huawei and ZTE leverage networking business and operator relationships.

    The crisper answer to causality may be that the market is bifurcating into an "upper" market where new jobs-to-be-done are being explored with integrated offerings (Apple and Xiaomi) and a "lower" market which is in the throes of low-end disruption. Both are competing with non-consumption though the upper market is service non-consumption and the lower market is feature non-consumption.

    Samsung is stuck right in the middle ((Just like Nokia was.)) It defines itself on the basis of what exists. It competes only within a defined market and positions itself agains existing products. They claim to be "better" than the competition and make the point loudly with their advertising. However, being better is never a solid foundation. At some point you'll be either good enough or someone more agile will be faster than you.

    At some point the fast follower exposes themselves to being faster followed. Better to find new lands to conquer.

  5. The certainty of unforeseeable growth: The rise of ZTE and Huawei

    Research · 37 comments

    • According to rumors, Huawei shipped 30 million phones last year. The target for this year is 60 million of which 15 will be smartphones.
    • According to IDC ZTE is now the fourth largest mobile phone vendor with 51.8 million units in 2010. Assuming 70% for 2011, ZTE could ship 88 million units in 2011, 25 million of which would be smartphones.
    • These data imply that ZTE and Huawei will ship nearly 150 million phones in 2011 of which 40 million would be smartphones.
    • That would imply approximately 7% share of the global smartphone market for these two companies together.

    What is remarkable about this is that the market share of these vendors was zero in the previous year.  It's hard to get comfortable with this market entry. The challenge for forecasters and analysts is that there is little history to draw upon. How will the entrants affect the rivalry between firms? Will the distribution be overlapping with incumbents or will the entrants be competing with non-consumption?

    The only thing we can be certain of is that the adoption of smartphones is increasing at a faster rate than is foreseeable.

  6. 20% vs 33% for "Others": Why are Gartner and IDC so far apart on mobile phone market estimates

    Research · 39 comments

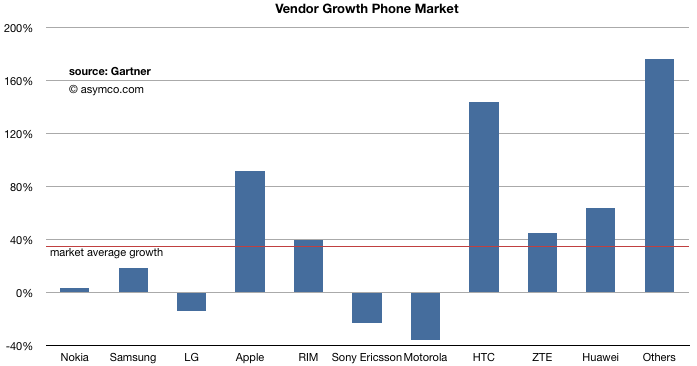
    The latest mobile phone estimates from Gartner made a startling claim that "Others" vendors increased share from 16% a year ago to 33%. Doubling share in a year is possible if you're at 1% share but to double from a base of 16% is sounding improbable. They allege that the "Others" now sell more phones than Nokia. And Others don't even include ZTE and Huawei, the prototypical low end challengers.

    They emphasize this point in their discussion and state that the incumbent vendors are being pressured by these low end entrants. They go on to explain that the same set of vendors will probably use Android to enter the smartphone space.

    To illustrate, the growth of individual companies is shown here (all phones).

    Also puzzling is that ZTE and Huawei did not share in this boom. They barely beat market growth and were growing at half of "Others". Until recently ZTE and Huawei were themselves Others, so the new vendors are truly unbranded "white box" vendors.

    To put it in perspective, their year-on-year growth is astronomical: 176%, selling 87 million more phones this third quarter than last year's. This is equivalent to saying that a new company was born in the last year and has already become the second largest in the world. The growth in volumes is higher than the total units Samsung sold!

    Mind the gap

    Extraordinary claims require extraordinary evidence. Can we check what other analysts estimated and do some form of validation of the claims?

    Yes we can.

    IDC reports the same data and they only reported 340.5 million phones sold (vs. Gartner's 417 million). Excluding ZTE and Huawei the total share for "Others" in IDC would be about 20%.

    20% share vs. 33% share is a big gap.

    IDC and Gartner both agree on smartphones, so the difference is even more glaring when you consider the "non-smart" comparisons:

    Non-smart phones:

    Total Market: millions of units sold____3Q2009______3Q2010
    Gartner268337
    IDC244260

    For added emphasis, I added a comparison of last year's quarter. Last year the Gartner total estimate was about 10% higher than IDC. This year they are 30% higher.

    How could the difference in the total phones sold be so big: 77 million phones?

    If Gartner is right, how could IDC miss 77 million phones. If IDC is right how did Gartner conjure up 77 million phones in one quarter? That number is nearly as big as all the smartphones sold (81 million). This is not within any margin of error for whatever sampling method they use.

    Perhaps they need to clarify this because until they do, neither is credible.

    --

    Note: My own models are built from individual company public reports. The only data I depend on from IDC and/or Gartner is this total market size which allows me to back out what the "Others" are doing. If the total market estimates disagree so much, I'll be forced to throw out the "Others" all together.