Asymco

Asymmetric Intelligence

IDC

  1. First quarter PC forecast: Windows down 2%, Mac+iPad up 250%

    Research · 100 comments

    Charles Arthur of The Guardian writes that PC sales "may have passed their peak".  That's a powerful, concise statement. It's backed up by a quote from Gartner's Mikako Kitagawa:

    "This was the third consecutive quarter of mobile PC shipment declines in the US"

    IDC even lays part of the blame to something called "media tablets"[1]:

    "While it's tempting to blame [PC] decline completely on the growth of media tablets we believe other factors [...] played equally significant roles."

    But there are several problems with both IDC and Gartner's analysis of the market. It's hard to make out causality from their data. There is separation by vendor but not by operating system and there is exclusion of devices hired to do the same jobs as PCs.

    For this reason, I need to do my own analysis. I retrieved Gartner's public statements on the overall market and layered actual Mac and iPad units sold. I also added my estimates for the Q1 2011 quarter just ended to complete the picture.

    We can now get an understanding of how the industry behaves with and without various platforms. The chart at the left gives the various growth rates of the market with platforms isolated from each other. I apologize for the shape of the chart but the scale does not permit a concise visual.

    Including the iPad, the total PC growth is shown by the blue line. It shows that the market peaked during the recovery but is now slowing considerably.

    The green line shows the PC industry excluding both the Mac and the iPad. Although it might include Linux or computers sold without an OS, the label "Windows PC" is a fairly close approximation. It shows that the market excluding Apple entered contraction this quarter and is out of sync with overall economic recovery and growth.

    The red line shows the behavior of the Mac franchise. It's well ahead of the overall market with 2x to 3x the growth. This has been a pattern for over 18 quarters.  I had some thoughts on this in a November 2010 hypothesis.

    But the most telling line is the orange line which includes both the Mac and the iPad. In an industry where growth is usually measured in single digits, the iPad business brings growth in three digits.

    This near tripling of unit sales is symptomatic of fundamental change that cannot be ignored. Although some analysts contend that the iPad is not causal to the decline in other PC sales, teasing out platforms data seems to show a divergent view.

    The bottom line is that Windows-only computer units are down 2.0% while OSX-based computer units are up 272% (this excludes both the iPhone and iPod touch).

    Correlation is not causation but tests or surveys where substitution can be proven do exist. For example, a recent survey shows that 77% of users reported that their PC usage decreased after getting a tablet. It also showed that 28% considered their iPad as their primary computer.

    So coupling the sales data with the usage data does point an accusatory finger for the decline on the iPad.

    In addition, some vendors are being hit harder than others which also hints at where substitution is happening. For example, IDC reports that Acer US unit shipments fell 42% in the first quarter and 16% globally (Gartner's numbers are less dramatic but in the same direction). Since Acer is known for its netbook computers it's another telling sign of possible substitution (Acer's own management has indicated as much.)

    So the weight of evidence is beginning to be conclusive: the iPad is the new PC. It should be clear by now that the iPad moves computing into new contexts so it does not yet substitute the PC market but extends it and increases consumption. Substitution is happening in low-end grazing type of usage, a place where the PC was ill-fitting anyway. Incumbent vendors might actually be relieved that the lower margin netbook is finally being supplanted and they can concentrate on the higher end.

    --

    Notes:

    1. Analysts like to call the iPad a "media tablet" but the same AdMob survey shows media consumption to be one of its least popular uses.
  2. The controversy of playing it safe: What's IDC's Smartphone Market Message?

    Research · 53 comments

    IDC released a new forecast for the worldwide smartphone market which included a long range forecast--all the way to 2015.

    Most people fixated on the share data in 2015. Not hard to do since whoever wrote the press release highlighted this flashy headline. Putting aside the three significant digits of accuracy on every data point and the hard to swallow declaration that a painfully underperforming (in more ways than one) Windows Phone will overtake iOS and BlackBerry to become the second largest platform by units/year in 2015, there is much more to the report.

    Using only the public data from the press release we can put together a pretty good picture of the transition being forecast and determine some of the (unstated) assumptions being made. It's these assumptions about the underlying market dynamics which illuminate far more than the falsely precise share data.

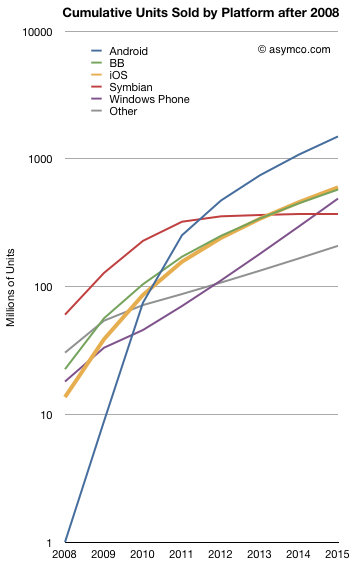
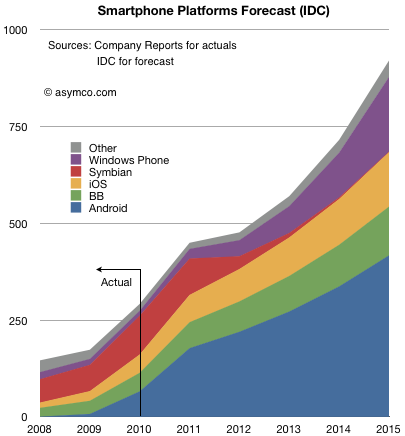
    The following chart shows both historic platform performance (which is detailed in the Asymco Interactive data sets on a quarterly basis) and the forecast based on the given compound growth rate published.[1]

    I see three main assumptions being made:

    1. Nokia (or more precisely Symbian) share will be swapped for Windows Phone. The transition period 2011 to 2015 shows approximately 150 million Symbian devices will be sold which is the stated goal for Nokia. IDC is making an assumption that the hardware vendors will roughly maintain their respective shares irrespective of platform dynamics and that Nokia will switch its share of users from one platform to another in a predictable way.
    2. iOS and BlackBerry will maintain share. Presumably this is also driven by hardware channel dynamics and relationships with carriers.
    3. Android will grow share slightly but the vast bulk of growth will come from market growth.
    4. Market growth is strong but undramatic.

    Overall this is not a controversial set of assumptions.

    Except perhaps that it assumes that the basis of competition in the market is unchanging. Of course it's well understood that the basis has shifted during the tumultuous 2007 to 2010 and forecasts made before the iPhone was launched sound absurd today.

    But IDC says that the unpleasantness won't happen again. From listening to the conversations going on today on this blog and elsewhere, their assumption that things will not change (again) is fairly deeply ingrained, indeed conventional wisdom. In that sense IDC is not taking any liberties with the future. The projections of current realities onto the future leads to this type of forecast and status quo defenders should be satisfied, if not rejoice.[2]

    However, there are a few more consequences of even this uncontroversial forecast which should make keen observers sit up and notice.

    If we look at more than the before and after snapshots and comfortable pie-splitting sound-bites there are some profound seismic things being implied.

    For example the entire market will be nearly 1 billion smartphones a year (in four years!). Even more startling, considering the "race to a billion" discussion we've been having, some of the platforms seem to be reaching that threshold rather quickly. The following chart shows the cumulative unit sales for the candidate platforms on a log scale:


    Android is considered likely to break one billion units in five years post-launch. Windows Phone will sell nearly half a billion units and Blackberry will be well over that number.

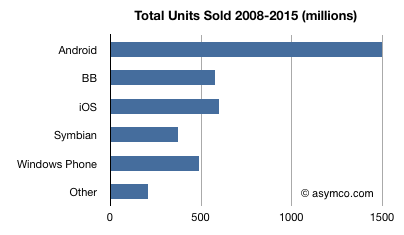
    I tallied the cumulative platform unit totals below:

    No less than four platforms will have sold half-billion units by 2015. The suggestion that Android will "win" by having the most units sold seems as hollow as the suggestion that Symbian "won" by having the most users in 2008. Not so much because it will go on to lose them, but because there were plenty of viable alternatives for users to buy and developers to build for. Half a billion users cannot be easily ignored.

    So even "safe" assumptions can lead to astonishing results in this market. Namely, IDC is saying that the smartphone market will not have any platform losers.

    There is one more thing the report implies. If you look at the ranking of leading platforms (by units/year) in 2008,  2015 and, with a little extrapolation, 2016/2017 you get:

    Rank in 2008Rank in 2015Rank in 2016/2017
    SymbianAndroidAndroid
    OtheriOSWindows Mobile
    RIMRIMiOS
    Windows MobileWindows MobileRIM
    iOSSymbianOther
    AndroidOtherSymbian


    In other words, there is a complete reversal being projected. An almost perfect flip: those on top end up at the bottom and those on the bottom end up on top. That's about as controversial as it gets. Pretty impressive for a set of safe assumptions.

    --

    Notes:

    1. You should ignore the shape of the curve between 2011 and 2015 as it assumes the CAGR is applied to every year. Although the press release shows a CAGR, the actual report may include various fluctuation in yearly growth. The starting point of 2011 and the end result in 2015 however should be the same.
    2. If, on the other hand, you believe that exponential growth, rapid gains in communications speed, new breakthroughs in interaction with devices, and entrants winning with new business models are causes for a disruption, then perhaps extrapolation may not be the way to forecast this market.
  3. G'Five overtakes Samsung in India: What does this mean for your favorite mobile OS?

    Research · 63 comments

    With a market share of 31.5 percent, Nokia is still the largest vendor of handsets in the Indian market, followed by Chinese brand G'Five with about 10 percent share, IDC said on Wednesday.

    via PCWorld.

    No, I haven't heard of G'Five either. The article goes on to say that there are 68 new vendors in the market accounting for 41% of total shipments. There were only five new vendors with a share of 1% in the first quarter of 2008.

    It was not long ago that Nokia held over 70% of the Indian market. That market is now larger but the share for Nokia has dropped by half at least. The share was not lost to Samsung but to 63 new entrants. They managed to capture 40% of the market, roughly equal to what Nokia lost.

    These new vendors will launch Android phones next year or the year after that. According to IDC, Android obtained 9.4% in the third quarter up from 2.9% y/y. The number of Android models went from 2 to 19 in the same time frame.

    What does this mean for Your favorite mobile OS?

    I'm sure many will use the Indian example as evidence of the inevitable ubiquity of Android. However, I would note that data networks are still very sparse in India and 3G has not reached a level of penetration that makes mobile broadband a common experience [citation needed].

    The funny thing is that this lack of connectivity is not likely to be an obstacle to Android as it wasn't an obstacle to Symbian in the pre-3G era in Europe. More than half of Nokia's smartphones were selling without data plans in Europe well into 2009. Nearly all were selling without data in Africa, Middle East and India. Smartphones without data plans are just high end feature phones. They can be used for picture/video taking, listening to music/video, FM radio and, if they have a keyboard, for more productive text messaging. In emerging markets dual SIMs, FM radio and removable storage are killer features. Mobile browsing isn't.

    A lack of broadband is however an obstacle to the iPhone. Here's why:

    With the exception of those seeking "luxury" phones (a very small minority), the iPhone is too expensive in markets without subsidy. That's because the price Apple sets is very high (€630 or well over $800 at retail). This is not entirely because the product is inherently more expensive. Much of that extra cost is margin for Apple. What makes it popular is that much of that extra cost is paid by the operator who accounts for it as a subsidy. Don't pity the operator though. That subsidy is there for a reason: because the product entices users to data-oriented consumption at a higher monthly service fee.

    The entire business model for the iPhone is to wrap a high-ARPU mobile broadband service plan with shiny metal and glass.

    Put another way, an iPhone without a broadband connection is just a voice phone with an integrated iPod touch. You're better off getting a cheap phone and an iPod, or maybe an Android or Nokia phone.

    When the iPhone 3G launched in India in 2008 with a price near $1000 it flopped. Many were quick to note that Apple did not understand the market. However few pointed out that the "3G" in the product's name was not just a marketing ploy. It was its Raison d'être.

    To study the impact of iPhone in emerging markets you need to first plot out the penetration of mobile broadband.

  4. 20% vs 33% for "Others": Why are Gartner and IDC so far apart on mobile phone market estimates

    Research · 39 comments

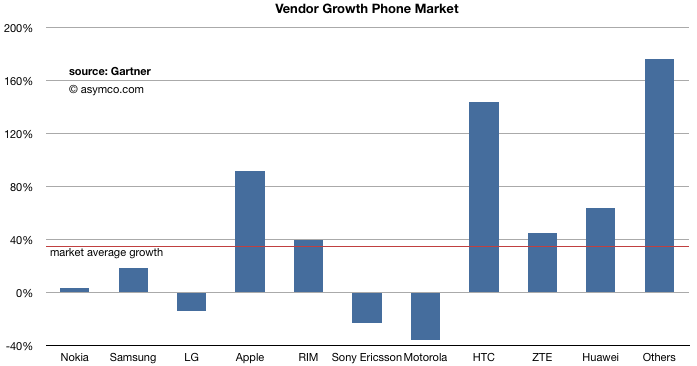
    The latest mobile phone estimates from Gartner made a startling claim that "Others" vendors increased share from 16% a year ago to 33%. Doubling share in a year is possible if you're at 1% share but to double from a base of 16% is sounding improbable. They allege that the "Others" now sell more phones than Nokia. And Others don't even include ZTE and Huawei, the prototypical low end challengers.

    They emphasize this point in their discussion and state that the incumbent vendors are being pressured by these low end entrants. They go on to explain that the same set of vendors will probably use Android to enter the smartphone space.

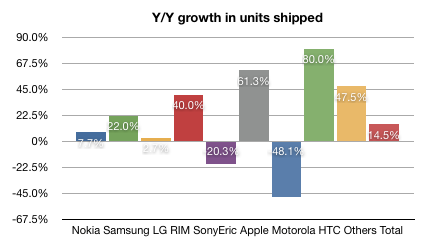
    To illustrate, the growth of individual companies is shown here (all phones).

    Also puzzling is that ZTE and Huawei did not share in this boom. They barely beat market growth and were growing at half of "Others". Until recently ZTE and Huawei were themselves Others, so the new vendors are truly unbranded "white box" vendors.

    To put it in perspective, their year-on-year growth is astronomical: 176%, selling 87 million more phones this third quarter than last year's. This is equivalent to saying that a new company was born in the last year and has already become the second largest in the world. The growth in volumes is higher than the total units Samsung sold!

    Mind the gap

    Extraordinary claims require extraordinary evidence. Can we check what other analysts estimated and do some form of validation of the claims?

    Yes we can.

    IDC reports the same data and they only reported 340.5 million phones sold (vs. Gartner's 417 million). Excluding ZTE and Huawei the total share for "Others" in IDC would be about 20%.

    20% share vs. 33% share is a big gap.

    IDC and Gartner both agree on smartphones, so the difference is even more glaring when you consider the "non-smart" comparisons:

    Non-smart phones:

    Total Market: millions of units sold____3Q2009______3Q2010
    Gartner268337
    IDC244260

    For added emphasis, I added a comparison of last year's quarter. Last year the Gartner total estimate was about 10% higher than IDC. This year they are 30% higher.

    How could the difference in the total phones sold be so big: 77 million phones?

    If Gartner is right, how could IDC miss 77 million phones. If IDC is right how did Gartner conjure up 77 million phones in one quarter? That number is nearly as big as all the smartphones sold (81 million). This is not within any margin of error for whatever sampling method they use.

    Perhaps they need to clarify this because until they do, neither is credible.

    --

    Note: My own models are built from individual company public reports. The only data I depend on from IDC and/or Gartner is this total market size which allows me to back out what the "Others" are doing. If the total market estimates disagree so much, I'll be forced to throw out the "Others" all together.

  5. Smartphone market growing faster than expected

    Research · 9 comments

    IDC raised its 2010 smartphone sales growth forecast to 55 percent from 44 percent earlier. Citing booming smartphone demand it also lifted its forecast for overall cellphone market growth to 14.1 percent from 12.6 percent.

    via Cellphone market growing faster than expected -IDC | Reuters.

    Keep in mind the 55% growth figure when reviewing analyst forecasts for iPhone growth. If their forecast is less than that then it implies market share loss. When I suggested 50% compounded annual growth rate (CAGR) for iPhone going forward 3 years, there was a lot of skepticism but this market is growing faster than most people expected.

    I still believe that Apple can grow the iPhone at least as fast as the market.

    Here are the quarterly y/y growth rates for iPhone units since sales began:

    159% 516% 88% 90% 644% 7% 100% 131% 61%

    On a yearly basis:

    2007: 3.7 million

    2008: 13.7

    2009: 25.1

    2010 first half: 17.15

    2010 (my estimate): 44.4

  6. Global mobile phone sales, the full picture

    Research

    After piecing together the global smartphone shares, it's time to take a look at global mobile phone shares. That's all phones from all vendors that matter.

    Unfortunately, just like there are only fragments available from Canalys about smartphones, there are only partial lists from IDC (IDC - Press Release - prUS22441510).  Missing are numbers from Apple, Motorola and HTC.  But fear not, those can be obtained from company earnings reports.

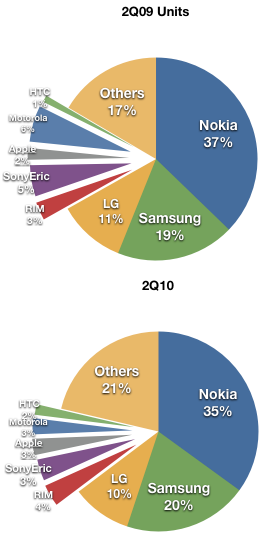
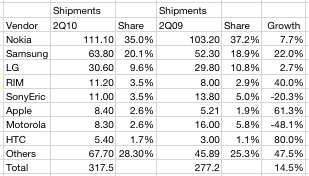
    So here is the full picture for 2Q10 vs. 2Q09

    The year-on-year growth for the vendors above is:

    The source data is:

    Observations:

    • The pure play smartphone vendors (HTC, Apple and RIM) are growing rapidly and capturing most of the profits.
    • LG and Samsung are taking share from Nokia but losing margins.
    • "others" are doing well at the low end.
    • Sony Ericsson and Motorola are transitioning from mass market vendors of commodity voice products to niche vendors of Android commodity data products.
  7. WWDC Context: A quarter million apps approved

    Research

    Six months ago IDC predicted 300k apps before end of 2010.

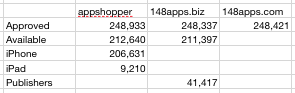
    Here is a quick mid-year check: As of today there are around 215k available, with 250k likely approved by the end of WWDC.

    These are the stats from three app store tracking spiders:

    Apple's WWDC banners proclaim 200k apps which was the last public count stated at the April iPhone OS 4.0 launch event.

    Looks like IDC's forecast will not be a stretch especially as the new iPhone will create a new wave of apps.

    Also noteworthy is the nearly 10k iPad apps available in less than 3 months.  The original iPhone reached 10k apps in about six months.

  8. IDC: I Dream of Claim Chowder

    Research · 3 comments

    A few eyebrows were raised when Microsoft presented a slide at a French event where they made the claim that 30 Million Windows Phone devices would be sold by the end of 2011.  Given that the first Windows Phone won't ship until October 2010 at the earliest, or, according to Mr. Ballmer, "by Christmas," count me among the skeptics.

    However, the claim was later retracted by Microsoft stating that they mis-quoted IDC, the original source for the forecast.  The correction was perhaps meant to put an end to the credibility crisis.

    However, the actual forecast from IDC was even more preposterous. Apparently IDC makes the forecast that 32 million "Windows Mobile" devices will sell during all of 2011--a combination of both Windows Mobile and Windows Phone devices.

    Instead, the research company forecast 2011 sales of 32 million devices running all Windows Mobile operating systems. This includes expected sales of devices with Windows Mobile 6.5, which is already on the market. IDC has not given any sales estimate for Windows Phone 7, which Microsoft has said will be available in the fourth quarter.

    Their report showed about 16 million Windows Mobile devices shipped in 2009, with a forecast of 22 million this year and 32 million next year.

    Windows Mobile shipped a total of 3.7 million phones in 1Q10, so in order to reach 22 million this year they need to ship 18.3 million for the rest of the year or, on average, 6.1 million phones a quarter.  That's a higher number than what Android shipped in Q1 with BOGO promotions (5.2m units). That's almost as high as the launch quarter for the iPhone 3G.  And all this (mostly) with WinMo 6.5!

    Alternatively perhaps IDC foresees a huge launch for Windows Phone. Assuming an erosion of the WM6.5 to 2.7 m this quarter, 2 million in Q3 and 2 million in Q4, then Windows Phone would somehow need to ship 12 million units during the last quarter.  This number is higher than what iPhone sold in its highest ever quarter.

    This sounds sillier than 30 million Windows Phones in 2011.  By claiming that Microsoft's combination of deprecated Windows Mobile (6.5) and unreleased Windows Phone 7 will continue to sell at a growth of 38% this year, they are actually suggesting an acceleration in sales going into the second half at a rate higher than what the market is likely to grow at.

    In other words, they are suggesting that Microsoft will gain share during the rest of this year. Share gains for a platform that has declined in share in Q1 from 10.2% to 6.8% with 3.7 million units sold on the back of further share losses the quarter prior. Share gains against Android that competes with a free license. Share gains with a new platform that has no clear differentiation vs. the iPhone.

  9. Will Apple rule the iPad market?

    Research · 1 comment

    This question sounds like a tautology. It's like asking "Will Apple rule the iPod market?" But redundancy has not stopped WSJ journalist Benjamin Pimentel from asking. His answer to the question is below:

    But while Apple apparently has the edge in the emerging tablet war, it is unclear if the company will end up dominating the market the way it has come to rule the digital music player market with the iPod.

    Gartner's Fiering said the iPad has "raised the bar and suppliers are now scrambling to make sure they get it right."

    IDC now projects 6 million tablet devices to ship this year, including 4 million iPads, Shim said. But while Apple has taken the lead, he added, the company faces the "burden of lifting or defining this entire new market," because there are no other competitive devices available.

    "In the iPhone market, they learned from everybody else," he added in a video interview. "In this new space, there's nobody else to kind of bounce ideas of so to speak."

    But Apple may not have to feel so alone for long.

    Fiering specifically pointed to H-P's as the best positioned challenger, given its scale, reach and its upcoming merger with Palm.

    "There are not too many suppliers that can pull all those pieces together," she said. "H-P could if they integrate the Palm acquisition properly."

    Another IDC analyst, Crawford Del Prete, agreed saying, while the "buzz" from H-P had generally been defensive in relation to the iPad, "the longer term story is far more interesting."

    "Given H-P's massive scale, I think they have the ability to drive new price points for this kind of product," he said. "With a lower price point, the category becomes far more interesting."

    via PC Makers Look To Challenge Apple's IPad - WSJ.com.

    Before diving into the statements above it's worth noting where the journalist went to get opinions to fill his column. He called Gartner and IDC. Quoting industry analysts is a standard operating procedure to fill column-inches with material that does not offend. But how good are they?

    In my years of watching those who watch markets I formed a ranking of analyst types and their likely accuracy with respect to prognosticating a market shift. In order from most accurate to least accurate:

    1. The most accurate are rank amateurs (deagol, Muller, et. al).  Independent bloggers who do some fact checking tend to make the boldest but most accurate forecasts.
    2. The next most accurate are sell-side analysts (purveyors of analyst reports from established brokerages).  They follow financials for individual companies.  You might think their record is quite poor, but in fact they are much better than..
    3. Industry analysts (like Gartner, IDC).  Their forecasts and sensitivity to disruption are often off by an order of magnitude.  This is partly because they forecast a bit further out than Wall St. but also because they are closer to their industry clients-- the source of their ideas.  They spend a lot of time talking to the least accurate forecasters...
    4. The corporate analysts.  They are typically hired to advise management in the incumbent companies. These are people who have the most information about the way the industry is performing on a daily basis.

    You might notice a pattern here: the closer you are to the market, the less likely you are to observe how that market is crumbling around you. You cannot see the forest for the trees.

    How could this be? How can having more access give you a poorer picture? The answer lies in the asymmetry of a disruptive attack. The more you know about how things are the less you know about how things could be.

    In practice, the analyst information value chain works like this:

    Corporate analysts feed information to management that management is comfortable digesting. Those managers then hire industry analysts to validate their opinions. Industry analysts are keen to maintain a relationship with those firms and so they listen carefully to the prejudices of their clients. They then hold up a mirror to those myths and consolidate those opinions for wider distribution and quotation by journalists at respectable publications.

    Stock analysts listen with one ear to the chatter but with the other to the way the wind blows with the stock market. Sometimes they actually sample the data in the value chain directly by calling acquaintances in the market and hire interns to watch what's happening in the shops. They then build an opinion that has some level of surprise but that they hope will not stray too far into controversy so that they can keep their jobs in case they are wrong. The safe bet is always to say that things will stay mostly the way they are, but to say it in clever ways.

    So that just leaves only one group of analysts with independence from a paycheck who can make an opinion on the basis of facts alone.

    This post has become longer than I planned, so I'll dive into the exact answer to the article claims in part II.