One of the arguments made for the cause of the increase in Apple's share price of late has been that dividends would attract more institutional investors and provide more liquidity to Apple's shares. Can we test this argument?
We're not dealing with speculation. The decision to start paying dividends was made three weeks ago. It makes sense to assume that this new information has been absorbed by the markets and market participants have adjusted their positions. Funds that were previously restricted in their investment in Apple due to its lack of dividend policy, could now go ahead.
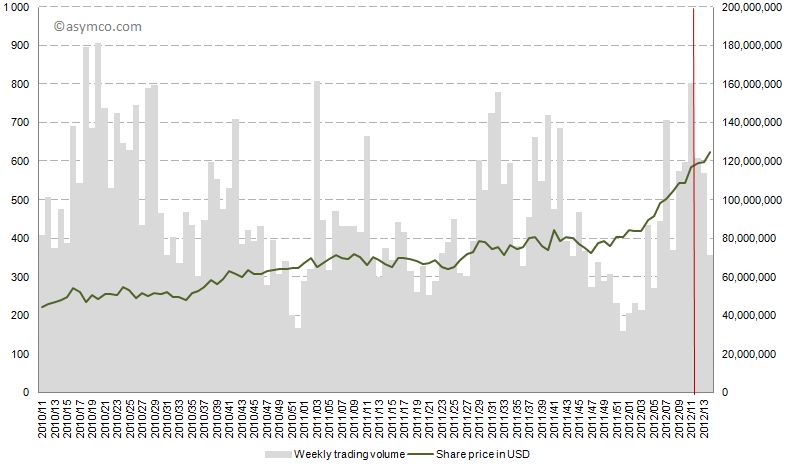
However, as the following chart shows, the share price climbed continuously before and after the dividend declaration of March 19th (shown in red). Trading patterns did not show unusual highs or lows. In fact, after March 19th the trading volume decreased on a weekly basis.
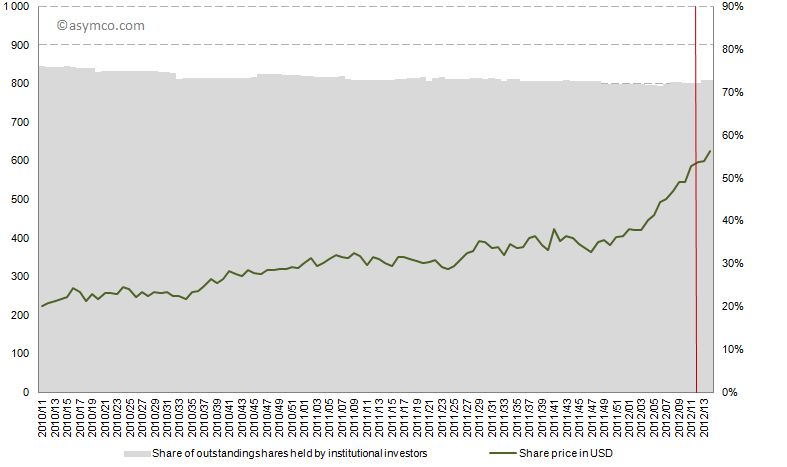
The other indicator is institutional holdings. The share of institutional investors as percentage of all outstanding shares did not increase significantly, and has been in an overall decline since late 2010.
But this lack of visible response to the decision should not be surprising.
Dividends are a tool to adjust capital structure based on optimal investment decisions. Dividends do not add value. The value of a company reflects the perceived net present value of all free, future cash flows. Whether the cash is in or out of the company is immaterial to its value. In either case the cash belongs to shareholders.
What the market is reflecting is fundamentals, not any change in liquidity due to "more buyers" available. For a long time the fundamentals were not accepted as sustainable. The best explanation for the rise in the share price is therefore that the company's future is now becoming clearer and a cloud of doubt is being lifted.
I began thinking carefully about Apple in 2005 when the stock was priced at around $55/share. I remember that the events which made me consider Apple in a different light were the launch of the iPod shuffle and the launch of the Mac mini. Both moves signaled to me that the company was serious about competing with non-consumption. At that point I thought that the company was a potential opportunity as an investment.
But I also remember that many people at the time thought that the stock price was too expensive. At $50, the company was much more expensive than the year before. The stock started 2004 at about $11/share. The reason it had climbed so much was that the iPod began to be a real world-wide growth phenomenon. Buying Apple was buying into the iPod and many said the price was unsustainable given such a strong dependency on fickle consumer tastes. It was a much riskier proposition than that of competitors like Dell and HP which made product for reliable buyers like enterprises.
Indeed, by 2006, the shine was off. In the first half of 2006 the stock collapsed from $85 a share to $50, a fall of 40%. It was becoming clear that with mobile phones taking on more music playing features, the iPod was not going to be a big story for long. What's more, Apple had just announced that they were switching to Intel for the Mac product line. Investors saw just how vulnerable the company still was and considered that the Mac brand was in jeopardy as it transitioned to becoming a Windows-friendly machine.
However, in 2007 the company's value recovered with the introduction of the iPhone. Suddenly there was a new product to drive sales. Nobody knew by how much or how but there was a sense that the iPhone was enough to keep Apple from oblivion.
Yet, again, in early 2008 the company lost 40% of its valuation. In a rather inexplicable period following the launch of the MacBook Air, the company's shares went into free fall. Inexplicable because the company continued to deliver solid growth with 2008 calendar quarters showing between 32% and 155% EPS growth.
Then the recession came. It caused another 40% share price collapse. Growth slowed to a range of 11% to 61% during 2009. As the marco "headwinds" blew over, by the end of 2009, with the help of a lukewarm response to the iPad, the company's value recovered to its 2007 level. In the mean-time its earnings more than doubled.
It may not appear to be the case, but throughout this volatile period, the investment thesis remained fairly constant: Apple is a rather small collection of product bets. Owning Apple meant riding the iPod or the iPhone or the iPad as waves of growth. As soon as one growth wave was seen to start to fade, investors would say the same thing: Apple is done.
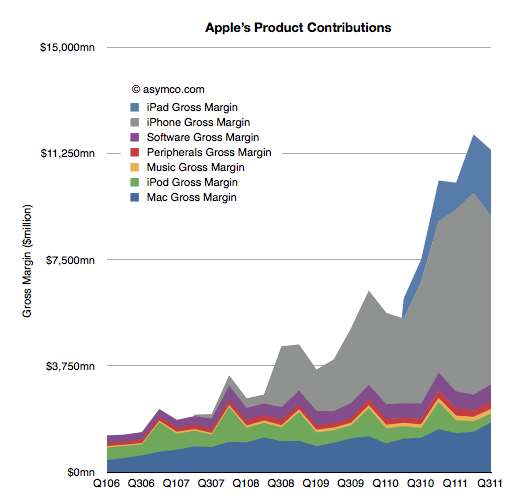
The chart below shows just what that looks like in terms of product contribution to gross margin.
The investment thesis is the same today. I've had dozens of conversations with fund managers and if anything, it's even more about betting on products. The iPhone and the iPad make up such a large part of profits that the company seems to be nothing but those two things. So if there is any hint that those products might slow down, the stock is sold off.
What intrigues me about this investment thesis is not whether the signals of growth are interpreted correctly or not, but rather that an investor in Apple in 2006 was considered perfectly rational valuing Apple as an iPod company as much as an investor today is perfectly rational valuing Apple as an iPhone company. Why would anyone buy Apple for any other reason? There is no evidence that Apple can be anything more. Any fund manager positing a different point of view would surely be limiting her credibility.
The consensus is that the value of future, unknown products is zero. Not only that but the probability that there will be any products at all is equally zero. Not only that but whatever Apple does to create new products is not perceptibly valuable. The company is simply the sum-of-the-product-parts and nothing more. Cash flows from current products can easily be shown to be more than the current valuation so even these products are deeply discounted. If and when a new product shows up, it will be considered and maybe if it shows promise, the stock will reflect that, briefly.
A corollary to this investment thesis therefore is that the process of product development at Apple is worth nothing. It does not matter if the company has shown an ability to disrupt and to create new categories. The past is not a predictor. The value of the company is a discounted cash flow of current products--discounted for the odds of commoditization, which are seen to be quite high. A new hit product is a windfall, a winning lottery ticket. Something that you cannot count on.
Think about that in a different context. That's like valuing Pixar on the box office revenues of its current movie. If Cars 2 is not beating records, Pixar is suddenly nearly worthless. The fact that Pixar repeatably creates blockbusters would be seen as meaningless. The way they built a reliable pipeline with predictable cost structures for movie-making is not interesting.
However, the fact is that Pixar did not get acquired on the basis of the last hit it made. It was acquired for its system of production. This can be confirmed not only by the price paid but by the fact that the organization was not folded into the Disney machine. It stands alone and is given autonomy. So at least in the movie making industry, predictability is seen as valuable.
So why is Apple not valued as a process company?
I think the answer lies in the lack of understanding or belief in a theory that predictable success in product development is possible. Until and unless an explanation is available that persuades a majority that Apple is as much a hit factory as Pixar then Apple without the products will intrinsically be valued at zero.
The premise of the stock market today is therefore that being innovative in technology is meaningless. Innovations are valuable but there is no such thing as an innovation process. If there was such a thing then we could measure it and put a number of its value. Until then innovation is nothing more than a spin of the roulette wheel.
Apple's valuation has been discussedseveraltimes on Asymco. Apple’s relative valuation in terms of P/E ratio has not improved since the recession despite an acceleration in financial performance. As Apple seems to be getting punished for growth, we have to also ask if it is the only one.
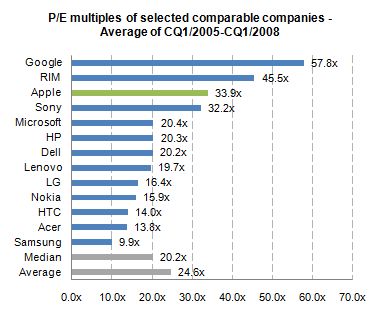
When looking at valuation from an institutional investor or financial analyst point of view, the most common methodologies are discounted cash flow (DCF) as well as comparable company multiples. Most often, a DCF valuation is performed and cross-checked with comparable multiples. The justification for using comparable companies is the exposure to the same market dynamics including, for instance, market growth and profitability. So to understand this perspective, let us focus on a peer group valuation by looking at the average P/E multiples[1] for the calendar quarters 1/2005 to 1/2008[2].
We can see that before the financial crisis Apple has been valued above the peer group average with a P/E ratio of 33.9x.
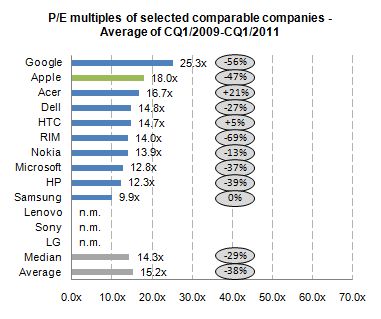
During the financial crisis stock prices declined across industries. For the selected companies share prices declined on average more than 80%. One would assume that with the improved industry outlook and worldwide recovery since 2009, peer group multiples should return to pre-crisis levels. By looking at the average P/E multiples for the calendar quarters 1/2009 to 1/2011, we can derive the change in relative valuation levels.
The data shows that, on average, all companies are continuously trading almost 40% lower for a two year period after the financial crisis. Despite Apple’s higher-than-average discount of 47% to pre-crisis valuation level, Apple is valued above the peer group average and on top of the mobile phone and PC vendor group.
By using the comparable company valuation approach, we are able to see how institutional investors analyze and value Apple. The analysis points to a valuation paradigm shift affecting not only Apple, but many comparable companies post financial crisis. In addition, there was a premium on Apple’s valuation before crisis and there is a premium after the crisis.
The notion that Apple has been single-handedly punished by the market does not hold in the context of comparable companies.
The next step will be to determine if the P/E premium for Apple is consistent with its growth premium.
---
Notes:
Share prices as of end of quarter, earnings include last twelve months
Charts excluding negative multiples and outliers (turn-around multiples)
In a recent but recurring lament I asked why Apple shareholders are not being rewarded for the company's growth. I pointed out that there is no fundamental reason why the company should receive such a low P/E multiple (about 18 ex-cash trailing and 10x forward while maintaining 70% earnings growth for over a year).
There were many objections in the comments. Most of them dealt with recent reasons why doubts might have arisen among investors: Android hegemony or some perceived lack of competitiveness leading to margin compression or some macro hangover from the recession.
In this article I argue that none of these objections hold water. My argument hinges on the fact that there is a precise date when Apple ceased being seen as an exceptionally valuable company and that date precedes any of the causes being suggested.
The day of disillusionment was almost exactly three years ago: January 14th, 2008.
How to pin down the date of disillusionment
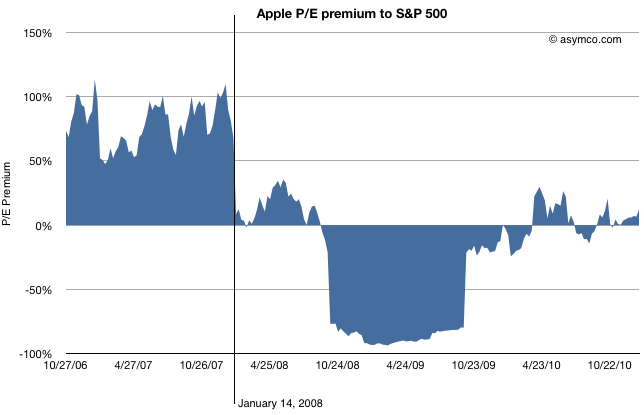
Consider the following chart.
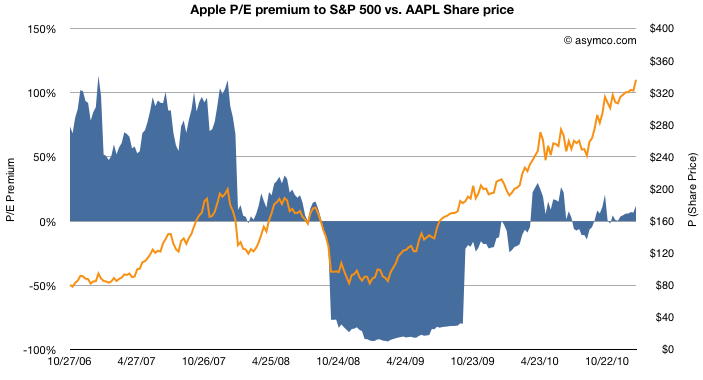
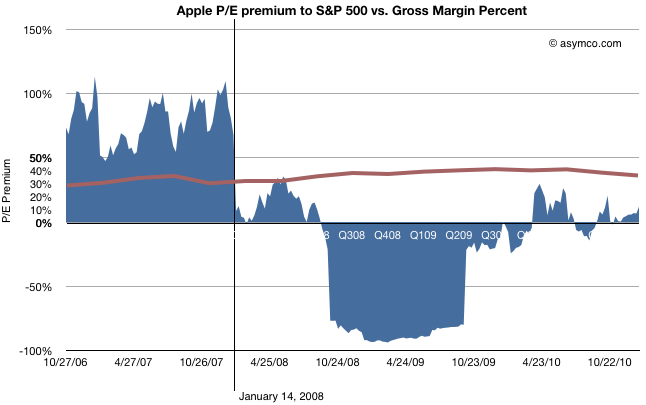
The blue area represents either a premium (above 0) or a deficit (below 0) of Apple's P/E (ex-cash) relative to the S&P 500 P/E. This is a re-imaging of a chart, first introduced in June 2010 when I first pointed out that Apple was being discounted relative to the S&P 500.
By measuring P/E I am focusing not on the stock price, which has grown nicely, but the ratio of the price relative to earnings, which hasn't (see the next chart below). P/E is a fundamental measure of potential (its reciprocal is the stock's earnings yield.) It is usually highly correlated to the company's growth. If that P/E is uncorrelated to past growth, there is some significant discounting of future growth. It's the most significant (and simplest) measure of "faith" in a company.
By measuring the company's P/E relative to an index of other large companies (S&P 500 P/E) we can assess whether the company's potential is being valued as extraordinary or whether it's being valued as ordinary. In other words we are measuring whether a company is "special".
The chart shows that until January 14th, 2008 the company was valued at a significant earnings premium--a P/E consistently 50% higher than the norm.[1]
Following the collapse (about 40% drop in share price but 100% drop in P/E premium), there was a small recovery followed by a huge trough in valuation. During the recession quarters Q308 to Q309 S&P earnings fell to zero or below. As a result of S&P earnings collapse the S&P P/E shot up astronomically (as E approaches zero, P/E approaches infinity). Apple's earnings dropped as well but remained positive throughout that period bottoming at 37% growth(!) in Q408. As a consequence Apple's P/E fell as low as 11 while the market's went well above 100 (122.41 peak). The P/E deficit for Apple went 80%: Apple was valued as basically worthless (3x cash).
After the earnings recession, the S&P P/E recovered close to historic levels but Apple's P/E did not. It's in-line with the S&P but does not obtain the 50% premium preceding the recession.
So we can establish that the day that Apple's potential was discounted was nearly six months before the onset of recession.
What other discounting factors can we discard?
How about earnings growth itself? Did the collapse foretell an earnings collapse?
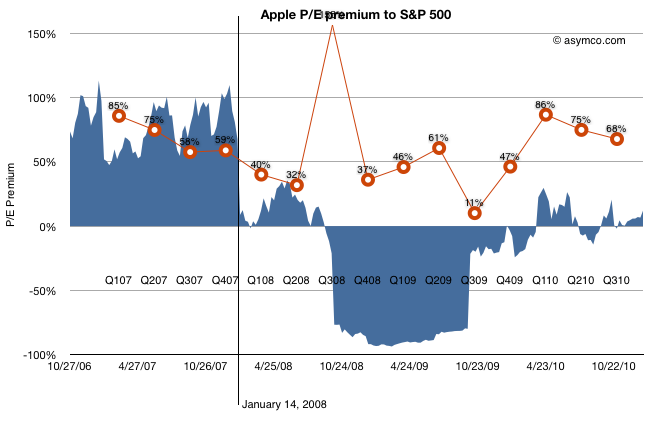
The chart above shows the P/E premium vs. earnings growth (in red). Although earnings growth began to slow soon after the 14th (earnings for CQ407 were not yet announced at that point), growth recovered six months later after the launch of the iPhone 3G[2]. Growth continued throughout 2009 and 2010 reaching new heights last year of 86%.
Still, the company received no premium to the S&P 500 P/E. Companies in the index averaged, at best, a quarter of Apple's growth in earnings.
What about Android? The first Android device did not ship until October 2008 (HTC Dream or T-Mobile G1). There were no appreciable Android volumes until 2009, one year after the drop in relative value and no talk of a threat until 18 months later.
The last objection to be put aside is that of margin compression.
This last chart shows how margins (in brown) behaved during the same time period. They went up. The only slight decline took place during the last few quarters, after the launch of the iPad, long after the collapse.
Regardless of the adjustments with product launches, Apple's GM is the envy of the world and is not at all correlated with the loss of faith in the company.
So What happened on January 14, 2008?
Having led you this far in the story, I'm afraid I'm going to let you down at the end: The cause for the loss of faith is a mystery to me.
There is only one noteworthy event that took place on that date: Macworld 2008 (January 14-18). During the keynote, Steve Jobs introduced the Macbook Air (and Time Capsule and Leopard and pre-announced the iPhone SDK which, six months later led to the app supernova). I remember that day and I remember that the stock began selling off exactly at the point when the Air was mentioned. It has never been the same since.
Obviously, correlation is not causation. The Macbook Air need not be the cause for the loss of faith in Apple as an investment. Or can it? I'm hoping someone can explain this because to me it makes no sense. The product was not a home run but it did not do badly either and its current incarnation seems to be a hit. Whatever sins the original Air may have had have surely been expurgated by now.
Regardless the cause, the bottom line is that, in the eyes of investors, Apple stopped being "special" that day. Its valuation dropped to in-line the S&P and, given its growth, well below what a large growth company should be worth. The company's shares went into the bargain bin and are still there today.
---
[1] I should point out that the P/E ratio is based on post 2009 re-stated earnings. The restatement changed the P/E as the "E" changed. This was based on the abolition of subscription accounting for the iPhone. Although it may seem unfair to hold the market to this standard, restatement did not actually change cash flows which were transparent and visible to all, even to amateurs such as myself and the other unaffiliated analysts that published throughout this period. Earnings may be an opinion but cash flow is a fact. Valuation on the basis of cash flow should have yielded the same results as shown above.
[2] That quarter showed a y/y growth of 150% while the stock was in freefall. In fact, it was during that earnings day that Steve Jobs came on the conference call and pointed out the astronomic iPhone cash flow to an audience of analysts more concerned about their own jobs.
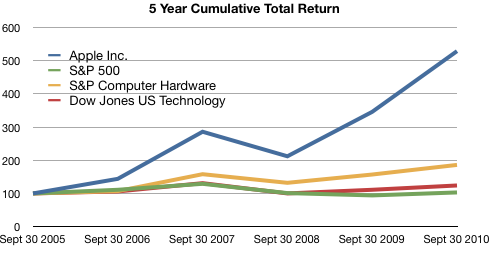
The following graph shows a five−year comparison of cumulative total shareholder return, calculated on a dividend reinvested basis, for the Company, the S&P 500 Composite Index, the S&P Computer Hardware Index, and the Dow Jones U.S. Technology Index. The graph assumes $100 was invested in each of the [securities].
In other words, if you had invested $100 in the S&P 500 in September 2005, you would have $103 now. If you invested $100 in Apple in September 2005, you would have $529 now.
Apple investors should rejoice!
However, in terms of reward for earnings, consider the following graph:
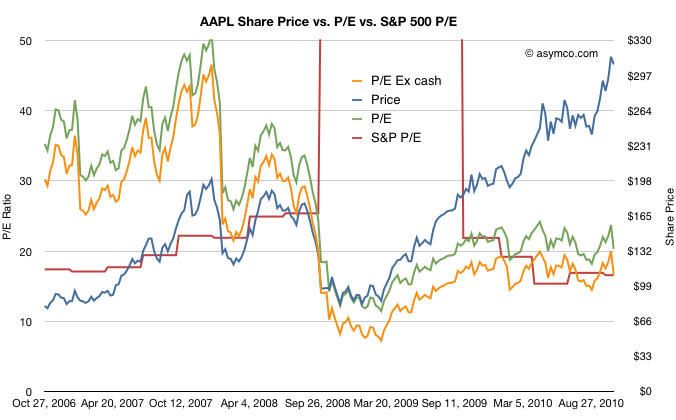
The red line represents the S&P 500 P/E ratio and the green and orange lines represent Apple's P/E ratios depending on whether you include cash in the price.
The reward to investors Apple does not seem so appealing anymore.
Although Apple received a premium valuation to the S&P prior to October 2008, it has traded at a discount or in-line with the S&P since then.
Another way of putting it is that the P/E ratio for large companies has returned to pre-recession levels. The P/E ratio for Apple has not.
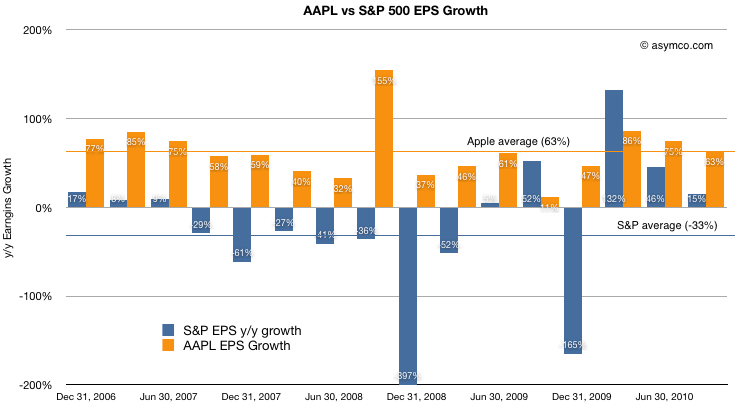
For a final point, a comparison of earnings growth (which should correlate to the P/Es) above shows that while the S&P is given a similar valuation to Apple, growth has been decidedly less spectacular.
Apple's average growth over the period shown was 63% (shown as the orange line) while the S&P has grown at an average of -33%. Nevertheless the market has chosen to reward the two assets with the same multiples valuing their future growth in earnings roughly the same.
At least they are equivalent. For much of 2009 and early 2010, Apple was considered to have a far less promising future than the average large American company.
“The N8 is certainly a step in the right direction, it’s much more multimedia,” Per Lindberg, an independent technology analyst at MF Global in London, told Marayam Nemazee on Bloomberg Television’s “Countdown.” “But whether it will move Nokia’s market share upwards is more debatable,” he said adding that Android phones are becoming an “formidable force.”
This is the same Per Lindberg who, in January of this year, reiterated his February 2009 Sell rating on Apple and the entire smartphone industry:
"There is no doubt, in my mind, that the whole sector is hugely overstretched," says the London-based physics PhD and MBA graduate who joined MF Global Ltd. in 2008 after 10 years at investment bank Dresdner Kleinwort.
"The whole sector is priced as if the average player would sustain 25 per cent margin in eternity," he adds.
"It's bordering on absurdity. This will end in tears."
He is willing to use the b-word: "Many stock bubbles are generated by sell-side analysts generating enthusiasm for the companies they cover."
To date however, it's Mr. Lindberg's call that's been the costly one for investors. He has maintained his sell rating on Apple since early February of last year, causing investors who followed his advice to miss out on a more than 110-per-cent surge in the share price.
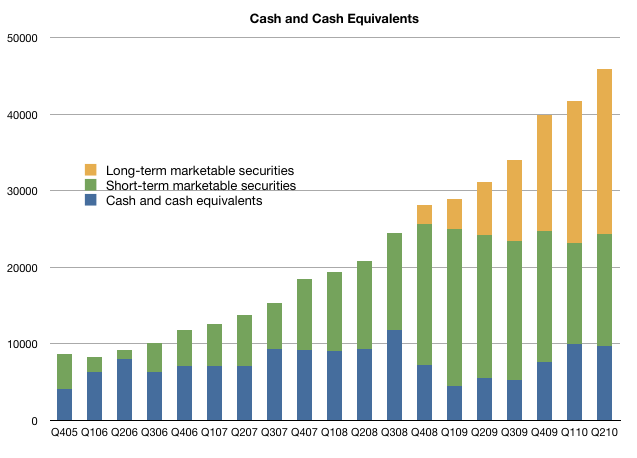
During the last quarter, the company added $4.1 billion in cash to reach a total of $45.839 billion or $49.43 per fully diluted share. This is divided into three types of holdings (long- and short-term marketable securities and cash equivalents).
Some (most?) financial reporting services do not include long-term marketable securities in their databases. This is a tragic error which mis-states most of the balance sheet ratios that investors may depend on. Offending sources include Capital IQ (which feeds finance.yahoo.com.)
To illustrate, the following chart shows the total cash equivalents for the company. The orange colored bars represent long-term securities. If they are excluded, an investor may conclude that Apple's cash has been *declining* since 2008 when the opposite is true. The company is shifting an increasingly larger proportion of its holdings to long-term (but fully liquid) securities.
The company devotes 9 pages in its 10-Q to describe and value the cash positions it holds. It's a pity that most aggregators of the company data don't bother to note $21 billion in assets.
Nokia reported 21.5 million converged devices sold in Q1. The units, share, ASP, Revenues and Operating Profits are compared in the following table.
It's once again evident that Apple captured more profits from the iPhone than Nokia did from all its devices and services operations.
With respect to converged devices, Apple also generated more sales and had nearly triple the ASP. Unit shares remained almost the same sequentially. Nokia did suffer more from ASP erosion sequentially as the converged ASP dropped by 24% vs. a 2.5% drop for Apple.
What is interesting from a growth perspective is that Apple's #1 position in the share of profits from mobile phones was acquired with such a low market share. Analyst Brian Marshall said the most interesting part of Apple's story is the international growth of the iPhone. He believes that Apple has only acquired about 1.5 percent of its international carrier partners' total postpaid subscription base of 525 million. For comparison, its penetration in the U.S. peaked in Sept. 2009 on AT&T with 5 percent.
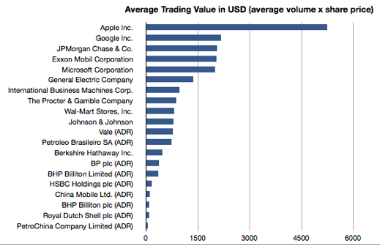
Of the top 20 largest companies, all of which are above $150 billion in market cap (listed in graph above), Apple has the highest volume of trading as measured by dollar value (average volume multiplied by last share price is $5.2 billion per day--see graph). In fact, it’s more than twice as popular as a traded equity than the next highest, Google and 2.6 times as popular among traders as Microsoft.
This trading volume might also be reflected in its beta (the correlation of price with the market with 1 meaning perfect correlation). Apple’s Beta is 1.59, nearly the highest of the super-large caps and the highest by far of the tech large caps.
Surely, this confirms that Apple is not only huge but hugely popular and highly visible among investors. Suggestions that its currentdiscountedvalue is due to obscurity among IT buyers translating to obscurity among investors does not wash.