Asymco

Asymmetric Intelligence

iOS

  1. The platform as a promise

    Research · 39 comments

    In a recent answer on quora, I wrote that I did not believe developers are tempted primarily by economic incentives when choosing which platforms to work on. I suggested that they hire platforms because of their star-making potential and that star-making value is not a something that money can buy. Using Hollywood as an example I suggested that subsidies decrease the perceived value of a talent-oriented platform.

    The notion that a platform signals meaning to developers led me to think about how mobile platforms signal meaning to consumers. I have a hypothesis that platforms can and should be treated as brands. This point of view allows platform orchestrators to develop a comprehensive market-driven strategy for platforms that transcends technical debate.

    First a word about what a brand is.

    Brands are vaguely defined. They are identities, names, symbols or attitudes or all of the above. Marketers struggle to define brand value because they are trying to encapsulate what they sell into a single symbolism. The problem is that there are vast varieties of things being sold. Every product or service has different meaning to buyers and it cannot be captured the same way. Because I cannot rely on a single definition I have to create a specific definition of brand to the context of mobile platforms.

    I choose to define brand in this context of platforms as the "promise of the platform". A platform is a promise that the products will function in ways beyond what's "written on the box"; that the product is extensible and has value provided by an ecosystem bigger than the original vendor.

    For example, although the iPhone is based on iOS platform, iOS is not the brand. "iPhone" encompasses the platform brand and it's a promise to users that they can expect apps and content and an extended flow of innovation to continue well beyond the initial purchase of the device. This brand value is attached to iPod touch and iPad even though it's not communicated as a unified platform. In other words, consumers don't look for "iOS inside" but the implicit value of "there's an app for that" covers all the products.

    When looking at platforms as promises or brands, we can observe how some are more powerful than others.

    Symbian or Series 60 was never marketed as a brand and Nokia users are generally unaware of what OS or platform their phone runs. Does Symbian make a promise of an "extended flow of innovation to the device" after the time of purchase? It's hard to make that promise when you can't communicate clearly anything but device specs.[1]

    Conversely, Android has become a strong brand. The Android label (and mascot) is frequently used by device vendors to signal platform brand value.

    How did Google achieve in a year this value with Android while Nokia continued to squander any brand goodwill around Symbian for a decade? The answer lies in marketing decisions. Nokia wanted to focus on the hardware as value (and the Nokia brand as the way that value is encapsulated). Google and Android OEMs wanted to lift their own device brands into becoming smartphone brands and attached the value of Android branding to them.

    Which brings me to the question of how to design platforms as powerful brands. Creating awareness of extensible value is the way to signal to developers and all members of an ecosystem that a platform is valuable. Apple did this very well with their iPhone ads which focused on the app value of the product. They showed the product in use and did not rely on metaphors. Developers saw other specific apps being advertised by Apple and it engendered huge star value in the platform. Every developer wanted a shot at being featured in an iPhone ad. The iPhone could and did make stars.

    But you can't make the great promise of the platform without the ensuring consistency, reliability and longevity. Fragmentation, malware, copyright infringement and arbitrary termination amount to the confiscation of platform value by the orchestrator. Poor custodianship results in the destruction of both ecosystem and end user value.

    --

    Notes:

    1. The lack of platform promise for Symbian may also explain why Nokia believes they can sell 150 million Symbian devices which have a deprecated platform. Those devices could be sold as feature phones, not platform products. The challenge for them will be to get a smartphone price for a feature phone product.
  2. Calling the end of innovation in mobile computers

    Research · 72 comments

    People are lining up to call the market for mobile phones. Analysts and amateurs alike are connecting points on charts and predicting with confidence the future of mobile platforms. Consensus is forming that there is no future but a quiescent state. By the acclamation of pundits, the survivors are declared to be iOS and Android. They are also predictably arranged in a way similar to OS X and Windows. End of story.

    Except for one thing.

    3.5 years ago neither of these platforms existed.  In fact, it was only two and a half years ago, in mid 2008, that one of the finalists even became a platform with the launch of an app store. The other "winner" only launched in a handset later that year and had no significant volumes until a year ago. In other words, these suddenly predictable platforms have been in existence for less than the life span of one device that runs them.

    To point out how extraordinary this claim is, if we look back to the history of computing, could we have declared the PC industry future cut and dried in 1978, two years after the founding of Apple? What about 1983, two years after the emergence of the IBM PC? What about 1986, two years after the Mac? Or maybe 1990, after Windows was born? Maybe the writing was on the wall in 1997, two years after Windows 95 caught up with the Mac's UX. That would be 21 years after Apple's founding. Some would argue that even today the story of desktop or portable computing is far from over.

    Sure, times have changed. Things move much faster now. But markets are also much bigger and take a long time to penetrate. Mobile channels are bounded by provincialism and parochialism.

    What's more, it's not like there haven't been platforms before these two upstarts came along. I've seen 9 mobile platforms in 9 years (PalmOS, Windows Mobile, Symbian, Java, WebOS, Windows Phone, iOS, Android, RIM Blackberry). New platforms are still emerging and evolving (e.g. MeeGo, Bada, LiMo, QNX and Tapas).

    So the existential question is this: If you were to draw a time line, would a mark in early 2011 signify the end of mobile platform history? The point in time when unforeseeable change will cease to happen?

    Let me offer a hint as to why not: every major platform battle has been sparked by an innovation built around a new input method. The keyboard integrated into a personal computer in the 1970s, the mouse in the 1980s, the stylus in the 1990s and the fingertip in the 2000s. Each of these input methods created new platforms (DOS/Apple ][, MacOS/Windows, PalmOS/Windows CE, iOS/Android), new ecosystems, new industries, new competitors and new platform battles designed to enrich forecasting pundits. I won't even try to go back to the changed in the half century of computing prior to the PC.

    So here's my challenge to the prognosticators: If you are willing to draw a line in the calendar now and say that no input methods will ever emerge in mobile computing after this point in time I'll buy the thesis that it's over and we can count our chips.

    If you think that out of the hundreds of user experience patents being filed, and hundreds of prototypes being slaved over in labs throughout the world, not a single new product will emerge with a new way of interacting with a computing device, then it's time to move on to something other than what can be declared a commodity market.

    But if you believe that, as happened four years ago, a new input method, previously only in the realm of mockups and movie magic, suddenly was shown, in a working product, on stage, then this business still has a chance of staying interesting.

  3. Summary view of Apple's income statement [Updated]

    Research · 22 comments

    Since reporting on the 18th, I've mostly finished going over the the fourth quarter Apple data. Here is a quick summary of the articles that covered the financial and product performance:

    SubjectArticle
    CashHaving added $20 billion last year, Apple’s cash growth suggests total could top $100 billion next year
    GrowthApple’s Growth Scorecard: 63% average earnings growth over 16 quarters
    iPhone pricingThe end of exclusivity doesn’t change the price operators pay for the iPhone
    Sales by product65% of Apple’s sales came from iOS powered devices
    Next quarter’s estimatesEstimates for Apple’s second quarter earnings (ending March)
    Share price/valuationIs Apple a candidate for acquisition?
    Margins and platform mix of profitiOS enables 71% of Apple’s profits. Platform products power 93% of gross margin
    CannibalizationiPhone and iPad: Fine Young Cannibals?
    Operational Expenses$76 billion a year from a tableful of products

    That leaves one more: Summary view of cash flows.

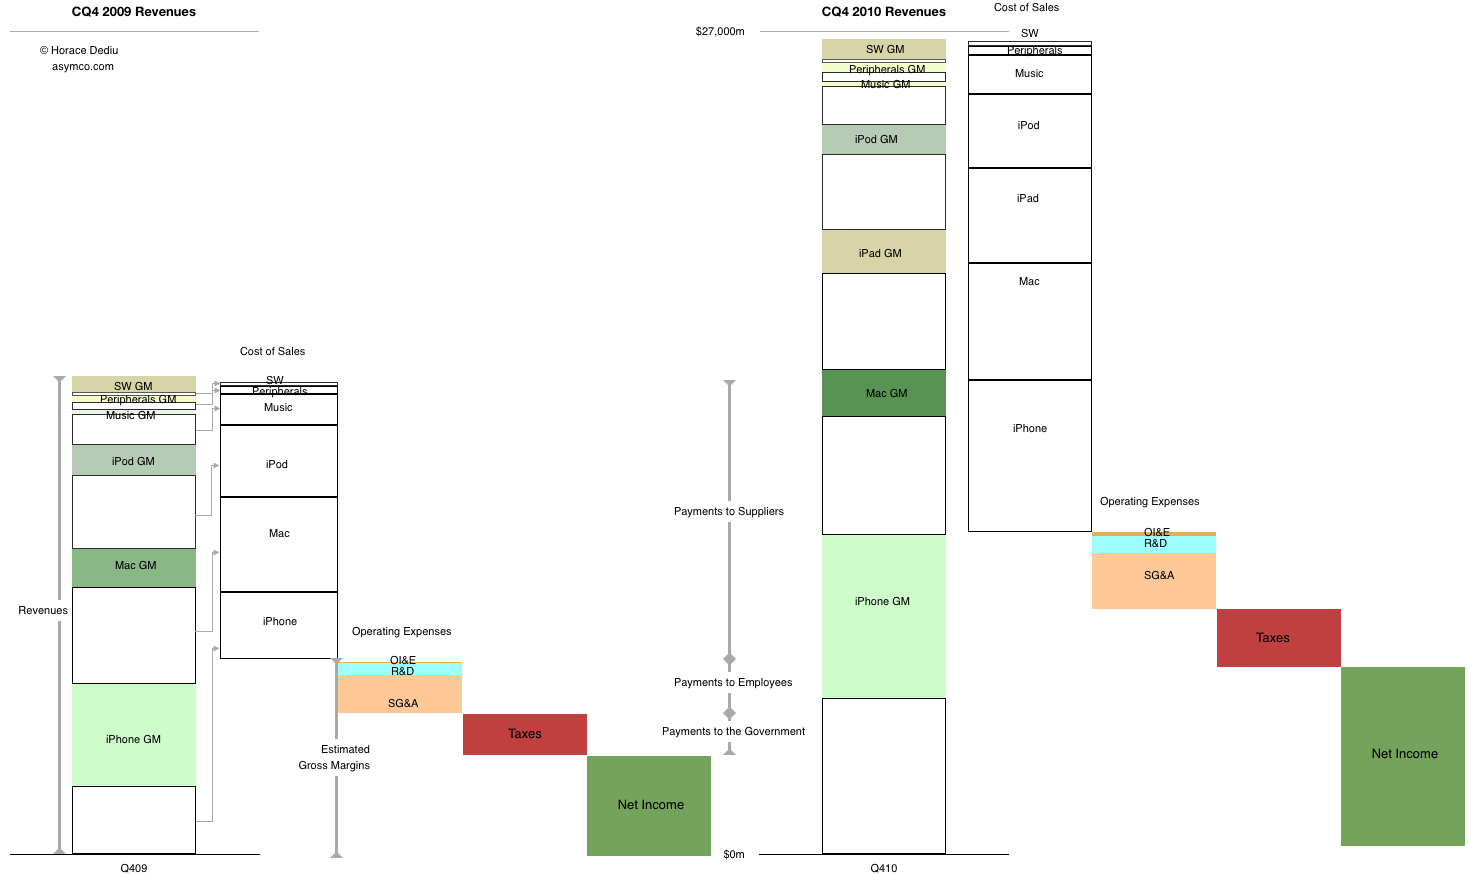
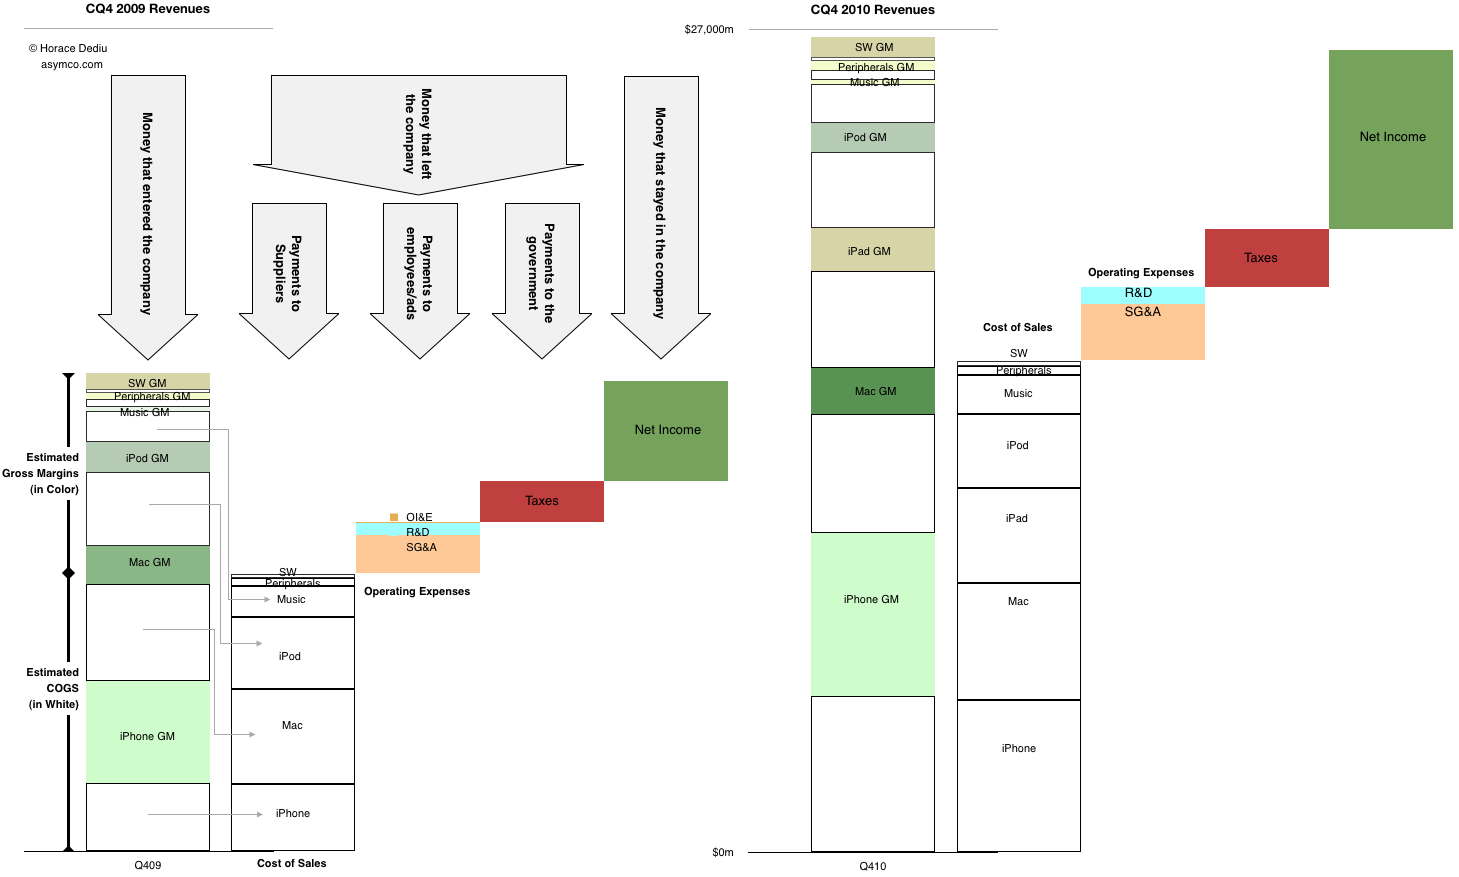
    After introducing it last quarter, this is a chart that I'm trying to improve and use as a single snapshot of growth, product mix, profitability, cost structure and overall sales. The purist in me likes to see the chart clean but it can be a puzzle to some.  So for the sake of explanation, this time I've added some annotations to the year-ago quarter.

    The left half shows flows in the same quarter a year ago and the right side shows the flows in the fourth quarter just ended December 2010. You can see where sales came from, how much of each product's sales went to suppliers and how much was available to pay employees (and who got what). You can also see how much was paid in taxes and what was retained.

    Please click on the figure (requires no scrolling when viewed on screens wider than 1464 pixels).

    [Update] Alternate view using "waterfall".

  4. iOS enables 71% of Apple's profits. Platform products power 93% of gross margin

    Research · 17 comments

    As the highly profitable iPhone makes up an increasingly larger proportion of Apple's sales, the overall gross margin would be expected to grow.

    Sure enough that's what's been happening.

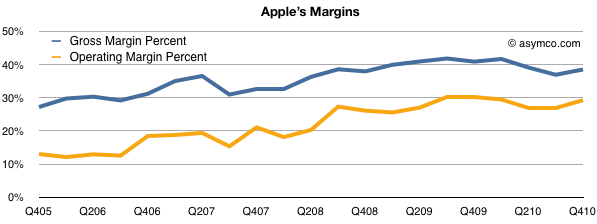
    The gross margin percent, which measures the direct or variable costs of production vs. price, shows a healthy rise in the last five years from slightly below 30% to around 40%. The Operating Margin, which also includes the overhead or fixed costs like R&D and SG&A, shows a similar rise, reaching about 30%.

    Margin expansion while sales quadruple is a good indicator that a company is producing real value not just trading sales volume for profit.

    Focusing attention on individual product lines, it's clear that the iPhone is the largest component of sales and of profits. We don't have specific product line-item gross margins from management, but we can estimate a figure for the iPhone by several means.

    First, we can work out roughly what every other product line's margin is due to their longer histories. (Mac and iPod have reliable profitability estimates). What's left can be deduced to make up the iPhone's margin.

    Alternatively, we can get estimates of the bill of materials and add in some of the other direct expenses like manufacturing, warranties, shipping and incidentals to get an estimate of the cost of production.

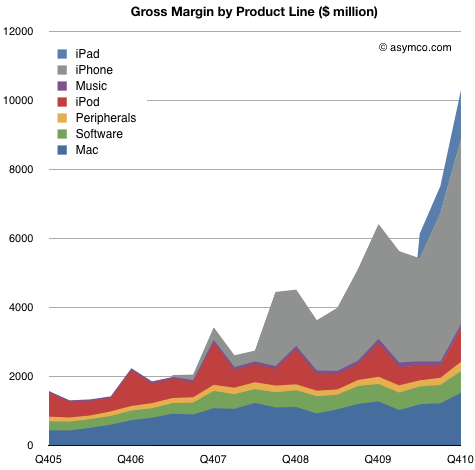
    These methods allow me to guess at a margin for the iPhone of about 50% for the last quarter. Based on these inputs we can plot the gross margins for the entire company's product lines:

    Overall, gross margins have reached over $10.3 billion in the quarter, increasing 543% from five years ago and 61% from a year ago.

    That's great, but by knowing product line profitability we can get a better feel how the company changed strategically.

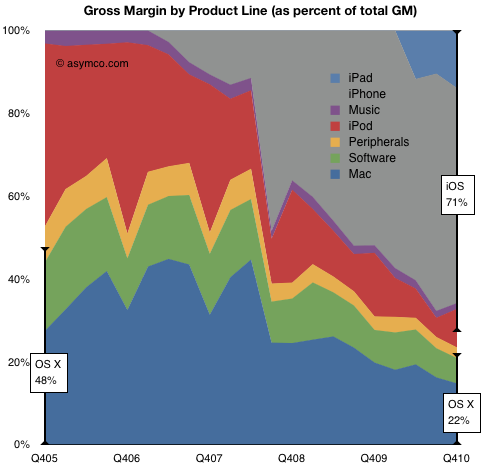
    In the following chart I show the percent of gross profit captured by each product line.

    What we can observe is that at the end of 2005, OS X based products made up nearly half the profits. The rest was mostly the iPod, which was not a software platform product.

    A short five years later, OS X products which, although having grown in volume, made up only 22% of total margin. The rest was mostly iPhone but with significant contributions from iPad and iPod. What's most important to note is that the non-OS X profits are almost all powered by iOS.

    iOS powers about 70% of Apple's current gross profits. Combined with OS X, 93% of profits are from platform products.

    So again the question about Apple being a software, hardware or media company comes back. Perhaps, those categories are not relevant. Perhaps Apple is a platform company.

  5. 65% of Apple's sales came from iOS powered devices

    Research · 46 comments

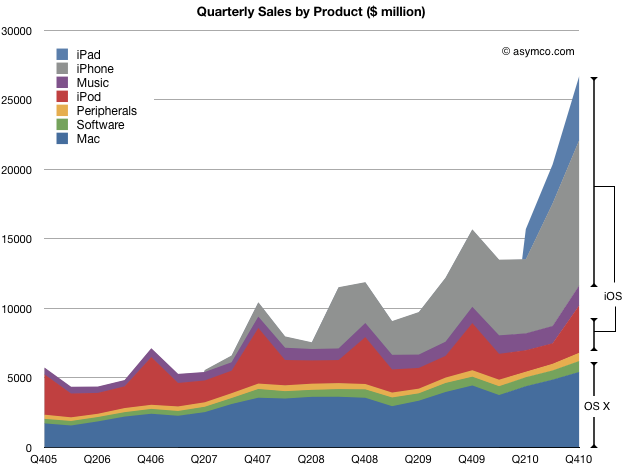
    The iPhone and iPad generated $15 billion of revenue last quarter. In addition, iPod touch generated about $2.3 billion, implying that iOS based devices were responsible for sales of $17.3 billion.

    To put that in perspective I drew this chart which shows not only the sales by products but a rough representation of share of the two OS variants Apple uses to power its products.

    iOS powered products (which did not exist three and a half years ago) generated 65% of all sales in the last quarter. OS X powered products generated 20% of sales. That's a noteworthy combined total of 85%.

    But software is even more important for Apple.

    The sale of OSX software (both the operating system and applications for it) accounted for another $786 million or 3% of total. In addition, I've put forward some evidence to suggest that the proportion of sales due to Apps in the Music store is nearly half, or another $600 million (a bit more than 2%).

    Therefore only 10% of Apple's sales were for products not directly powered by its vengeful operating system. That speaks volumes not only for the importance of software to Apple but for the cohesion of an extensible, flexible architecture that allows it to inhabit a portfolio spanning from a music player and an enterprise server.

    I recently answered a question on Quora on whether Apple is a Software, Hardware or Media company by saying it's all three.

    With 90% of sales dependent on a unique, proprietary operating system[1], perhaps the answer should have been different.

    ---

    1. I know that OS X has a large amount of open source. Proprietary, like Open is a partial definition.
  6. iOS users download about 5 apps every month

    Research · 9 comments

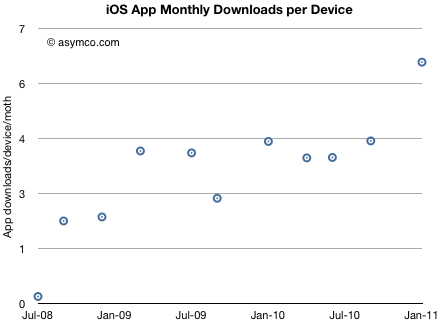
    Thanks to a reader for asking this question: "Wouldn’t it be more telling to look at the monthly rate of downloads / device at any given time?"

    Yes it would.

    Here's what can be derived based on download rates and installed base of devices.

    Please note that I am assuming that the number of devices put out of use is negligible. In defense of this, I would argue that the vast majority of iOS devices sold are still serviceable and are re-sold. However, the estimate should be rounded down.

    The data shows that there's been a slight trend upward in download rate/user but it's been fairly steady.

    The implications are interesting: if you know the number of iOS devices in use, you can determine the app economy turnover with reasonable accuracy. If you also know app ASP, you know sales, and even margin.

    Conversely, if you know the app download rate you can derive the device installed base.

    So in September I looked forward to an iOS user base of 500 million. It could be reached by 2013. Assuming each user downloads 5 apps per month that would mean 2.5 billion downloads per month.

    That's two years away.

  7. Is Android more efficient than iOS at generating search revenue?

    Research · 63 comments

    Thanks to David Chu for forwarding the data that made this possible and reader Narajanan for spotting the divergence in platform efficiency.

    iOS and Android are both growing rapidly. According to Gartner, during the first three quarters of 2010, about 44 million iOS devices and 36 million Android devices were put into use. That's 80 million devices. An amazing achievement for two platforms that did not exist 3 years earlier.

    But obviously not all devices are used the same way. Devices which have unused capabilities limit network effects for a platform and for the category of product in general. Question is: how can we measure the "smartness" of a device; how much more likely is a device to be used as a mobile computer vs. being a regular phone?

    The best proxy I can think of is a measurement of browsing use. The smarter the device, the more browsing is a joy and the more it is actually done. Browsing leads to more data load on the network and creates a virtuous circle of revenues for the mobile computing value chain.

    If we could measure the increase in browsing generated by each additional phone, we could compare whether one platform is better (specifically, more efficient) at generating value asymmetric to voice.

    Fortunately we have data from Netmarketshare.com (see sources below) which attempts to track browser consumption and hence allows us to measure this variable. What we need to pair that with is the incremental increase in the installed base of devices.

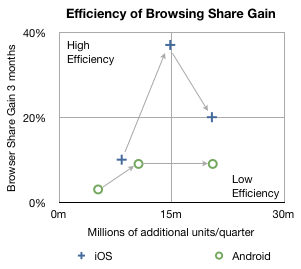
    In the chart below I plotted how much browsing share increased for every phone sold by platform over the first three quarters of 2010.

    The arrows indicate the sequence in time from Q1 to Q3. The vertical axis shows gain in share three months after the corresponding number of units shipped in the previous quarter on the horizontal axis. So, for example, the second circle means that in the second quarter approximately 10 million new Android devices created a gain of about 9% in browsing share. In the same quarter, 14.8 million iOS devices created about 37% gain in browsing share.

    In the third quarter approximately the same number of iOS and Android devices shipped (iOS  including iPads and iPod touch) but the browser gain was 20% for iOS vs. 9% for Android.

    A line drawn diagonally from lower left to upper right (0,0 to 30m,40%) could represent the average gain in share per units sold--the sort of measure we're looking for.

    Measuring that slope tells us that, on average, every million devices sold should generate a gain of 0.75% share[1]. I took the additional step of labeling two quadrants which are orthogonal to the expected trend. If browsing increases dramatically faster than 0.75%/million units then I call those devices sold as creating "highly efficient" browsing gain. If browsing increase lags dramatically below 0.75%/million units then those devices added share with "low efficiency".

    So four data points follow the trendline down the middle of the chart, however, there are two notable outliers. Finding the causes for these outliers gives clues to what's happening with the platforms.

    I believe the explanation for iOS's second quarter's extraordinary efficiency is that was the quarter when the iPad launched. It seems to have yielded a very strong spike and the trajectory of iOS improved even into the next quarter as those iPads continued to be in use. iPad seems to be a very effective way to gain browser share.

    I also believe that the cause for Android's fall in efficiency in the third quarter was that it began to be sold in large quantities in the developing world. The third quarter saw a rapid acceleration of sales without a proportional increase in what was measured as sales in the US (and Europe).

    Interpretation

    If this trend continues, and there is no guarantee that it will, then a question could be raised about Android's value to, of all people, Google.

    The core value of Android to Google is the increased use of browsing and hence search. All the other Google services and in-app ads are tiny opportunities in comparison to the potential of search on mobiles. One could argue that the raison d'être for Android since day one was to create browsing consumption. In that regard it's not as good at doing that as iOS is.

    Perhaps Google can justify the under-performance of consumption of browsing (and hence search) on Android devices as benign since there is no marginal cost added to supplying Android to non-consuming devices.

    But I wonder. There is the problem of opportunity cost: Those iOS devices that create more browsing activity are going to take more share. The more they do that the more Google will have to pay Apple for placement as the default search in mobile Safari.

    It may be a stretch, and perhaps the data is wrong, but that's what this exercise is all about: how much can we learn from fragmentary data? Without a hypothesis there is no discovery.

    -----

    Notes:

    1. Since these platforms have very low shares (less than 2% for iOS and 0.3% for Android by November) almost all the gains can be assumed to be against other browsers (e.g. Internet Explorer) and not against each other.
    2. Update: the original Unit estimates excluded iPad and iPod touch which have since been added.

    Sources:

  8. Verizon back at bat: Revisiting the last inning

    Research · 69 comments

    A month ago I wrote an exposé on the problems I felt Verizon was facing with their smartphone strategy: Verizon Strikes Out in Smartphones [Updated]

    Given new information on subscriber growth and the relationship between Verizon and Apple, it's time to look back and assess how the conclusions are standing up.

    The conclusions I drew were that Verizon had three strikes against them:

    1. The iPhone has stolen their growth
    2. They are facing the prospect of a single OS platform supplier
    3. Android is not competitive vs. iOS

    Did iPhone really hurt Verizon?

    I pointed out that based on retail sampling data from ITG and what we know from AT&T own sales data, that iPhone at AT&T was outselling Android at Verizon by a ratio of 2.5 to 1.

    The latest comScore data closely matches the assumed units of Android shipped by Verizon. Here's why: The comScore data shows the number of active users of each platform. So, for example, as the number of Android users at Verizon grew, it follows that the new users had to buy new Android phones. However, you can also sell more phones than just those for new users. Some phones are going to go to replace those of existing users.

    When it comes to Android however, all the Verizon Android devices are pretty new, having been purchased less than a year ago. Replacements would only be sold for damaged or lost devices not covered by warranty.

    So from comScore the change in subs at Verizon comes out to about 2.2 million and my original estimate was about 2 million. That's pretty close.

    On the other hand, if you look at the chart, you'll notice that the number of iPhone users at AT&T grew by a similar amount (about 2 million). However, AT&T activated over 5 million. That means that about 3 million devices were upgrades. This makes a lot of sense since we know that iPhone is the bulk of AT&T smartphone users.

    This is highly supportive evidence that iPhone at AT&T did indeed outsell Verizon Android by at least a factor of 2. Each of those phones came with a 2 year lock-in so indeed AT&T did manage to "steal" growth from Verizon.

    Another data point in support of this conclusion was provided by Turley Muller in a comment.  AT&T smartphones make up a significantly higher proportion of contract subs at 44% vs Verizon at 23%. Effectively, as a result of their sweetheart deal with Apple, AT&T got double the penetration of smartphones than Verizon since these devices are targeted only to contract subscribers. Those are high ARPU customers that either moved from regular voice plans or switched from other carriers.

    So far, the first conclusion seems to be holding up pretty well.

    Was Android a strategic constraint to Verizon?

    Verizon revealed that they had been negotiating with Apple at least since 2008 and that they were testing the phone for a year. This is not as big a surprise as it may seem. Deals of this kind easily gestate for years. The commitment may not be made until the last minute.

    Nevertheless, my point was about the fact that Android was making up to 75% of Verizon's smartphone volume in Q3. This might be a strategic constraint. But "so what?" you may say: AT&T's dependance on iPhone was even greater.

    That's precisely my point though. As we've seen with the shift by Apple to multi-carrier distribution, AT&T is now facing serious constraints on growth and the share price is suffering. Although Verizon did not deal with Google as a direct supplier, they were at risk of having much of the IP on their network at least orchestrated by a company that was not always aligned with their strategic goals. Much the same predicament AT&T is facing now.

    The tale of AT&T and iPhone does lend support to the premise that Verizon felt a bit too constrained by Android hegemony on its network.

    Is Android Competitive with iOS?

    This last point was supported by the data showing a widening higher sell-through rate for iOS vs. Android on comparable addressable markets. Although the data has been confirmed with survey data, there are issues with this interpretation. First, because the addressable base for iPhone is higher at AT&T with the post-paid contracts being more popular there, iPhone had an easier time getting sold. Second, because 3/5 of the phones were upgrades.

    The jury is still out but the apparent pent-up demand (admittedly anecdotal) for iPhone on Verizon does seem to show that given similar pricing, and a similar demographic/geographic addressable market, people do prefer the iPhone.

  9. For every AT&T Android user there are 15 iPhone users: What will be the ratio at Verizon?

    Research · 103 comments

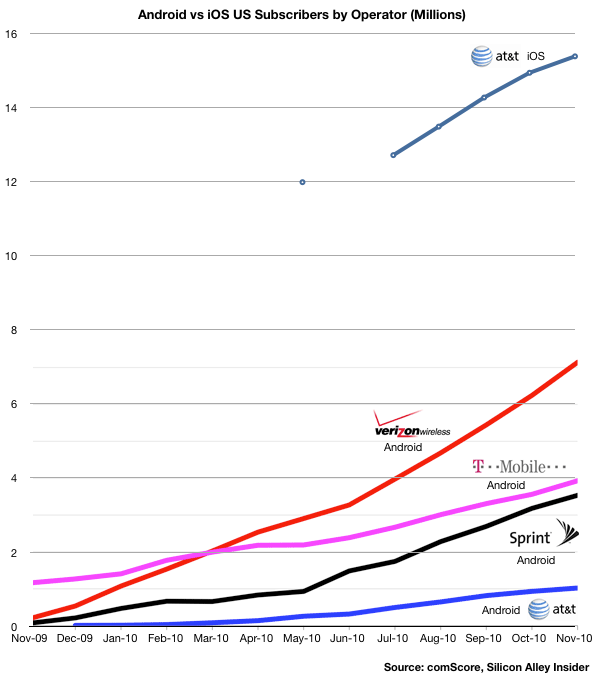
    The following chart uses comScore data to show the relative consumption of Android vs. iOS by the subscribers of the four major US operators. I modified an original chart published by Silicon Alley Insider.

    A few observations:

    • As of November, the ratio of iOS to Android users was more than 15 to 1 at AT&T.
    • iOS at AT&T has twice the users as Android at Verizon
    • Although T-Mobile had the Android franchise to itself for all of 2009, it was overtaken by Verizon within four months
    • T-Mobile Android consumption has also been nearly matched by Sprint within a year

    The rapid eclipse of T-Mobile smartphone penetration makes one wonder how effective Android is as a differentiator for carrier and device vendor alike. It also explains their new pricing model.

    The data also gives clues to how iOS at Verizon will grow.

    Since Verizon and AT&T have nearly the same number of subscribers, excluding RIM ,which is common to both, AT&T has a far larger penetration of smartphones (16.5 million vs. 7 million.) Is the cause iOS itself or the delay with the timing of Android launch at Verizon?

    Other data from comScore shows that much of the gains for Android at Verizon have been at the cost of RIM, so Android has not been entirely additive. Will there be a similar platform switching going on or will iOS be additive to the Android base?

    On one hand, the potential exists for a similar number of touch smartphone users at Verizon as at AT&T (15 million as of November). On the other, Verizon is "half-penetrated" with Android. How many will switch (as they did with RIM) and how many will be new users?

    I'm not going to make any predictions yet but I would not be surprised if Android at Verizon will flatline if not drop while iOS at Verizon will jump quickly to make the sum of both equal to AT&T iOS in about twelve months. That would imply about 10 million new Verizon iOS users by 2012.

    If Verizon users start to switch from Android to iOS, iOS could add as much as 15 million users. It seems that 10 to 13 is a reasonable estimate.

  10. How sticky is Android?

    Research · 204 comments

    There is an assumption floating around the debates in this and other forums that the "battle" between mobile platforms is a land grab. The unspoken implication of this assumption is that once a user is captured she is permanently locked into the chosen platform never to move to another again as long as she lives.

    For example @dutchtender remarked:

    many people's first smart phone will be android. android can take them "cradle to grave." android will be there with a higher end solutions when they can afford it

    This is a strong but untested claim. It may be true but we owe it a bit of thought.

    A long time ago I tried to model platform growth is by using a version of Metcalfe's law. I suggested that the value of a network is proportional to n log (n) where n is number of nodes in that network[1]. This was somewhat based on common sense as it measures the possible links between n nodes with degradation due to the limits of social graphs.

    The value the network creates is what developers as well as all the other participants in the ecosystem are able to tap into. The platform vendor gets to capture a share as well of course. As the value grows it tends to create network effects or a self-reinforcing cycle.

    What I'm saying then is that we can treat a platform as a network, where each node is linked to another node by the commonality of experience.

    The proxy of the model was Windows. Twenty years ago, having Windows meant that you could exchange files with other Windows users simulating a sort of network protocol. You could also ask your peer group for help and get software tips and new consumption ideas. So the more people used Windows the more likely it was that you also had to use it. Avoiding Windows limited your ability to be part of productive society (this is no longer true by the way, which is one reason Microsoft is in trouble).

    If we fast forward to the mobile post-PC world, when it comes to platforms the shared experience is that of apps. People can communicate their app experiences and their usage better if they have the same platform. They can also learn from each other how to better use the products and how to solve problems. The more people that use a mobile platform, them more value it generates for platform participants.

    The other factor determining value is that a platform also creates sunk costs. Usually called "investments" by users these are costs that are incurred and have a potential for future value. This means that the apps purchased and time spent learning and adjusting to the platform are sunk costs which users are reluctant to abandon. (Notwithstanding the fact that as sunk, these costs should be ignored when comparing the value of another platform,--psychology is what keeps users loyal even if it's not in their best interest.) This "sunk" factor of value is not as powerful as the sharing of experiences value since it does not scale with the number of users. That cost is a constant multiplier on top of the n log (n).

    So the overall "value" of a platform is K n log(n). Where K is the stickiness of sunk costs.

    Can this be stated plainly without the math?

    When you compare two platforms you have to ask how contiguous users (n) grows and how stickiness (K) grows. The issue with fragmentation is that it actually cuts n. Many people won't be able to share experiences if their devices don't work the same way. Same with geographic density of a platform. If, as was the case with Symbian, there are few segments that became saturated with the platform then n is reduced.

    The issue with a lack of paid or compelling apps is that it cuts stickiness, so that you don't have any sunk costs. Similarly the presence of ported or common apps means that K is reduced for any single platform. Nokia's Symbian has a serious problem with both consistency and with commonality of experience. RIMM depends too much on the commonality of messaging which is quickly becoming a commodity due to portability of the experience.

    So in the end it's not just about how big the user base n is (which is the only thing that is measurable). It's how contiguous n is and how compelling the content.

    This is too sketchy a model to be practically applied but it offers a thought experiment: does any given platform have

    • A large, contiguous user base with strong concentrations of users in the same demographic or psychographic segments?
    • A significant set of unique content (apps) which require costs from the user (in terms of data, time or cash)

    It's not a clear cut case in my mind that Android benefits from these as much as iOS does. If that's the case, users are more likely to be moving on a one-way street between these two: from Android to iOS and not vice versa. The same thought experiment can be engaged in between any two platform contenders.

    ---

    [1] Metcalfe's law is actually an n*n growth curve but recent research indicates that social networks scale in value as n log (n).