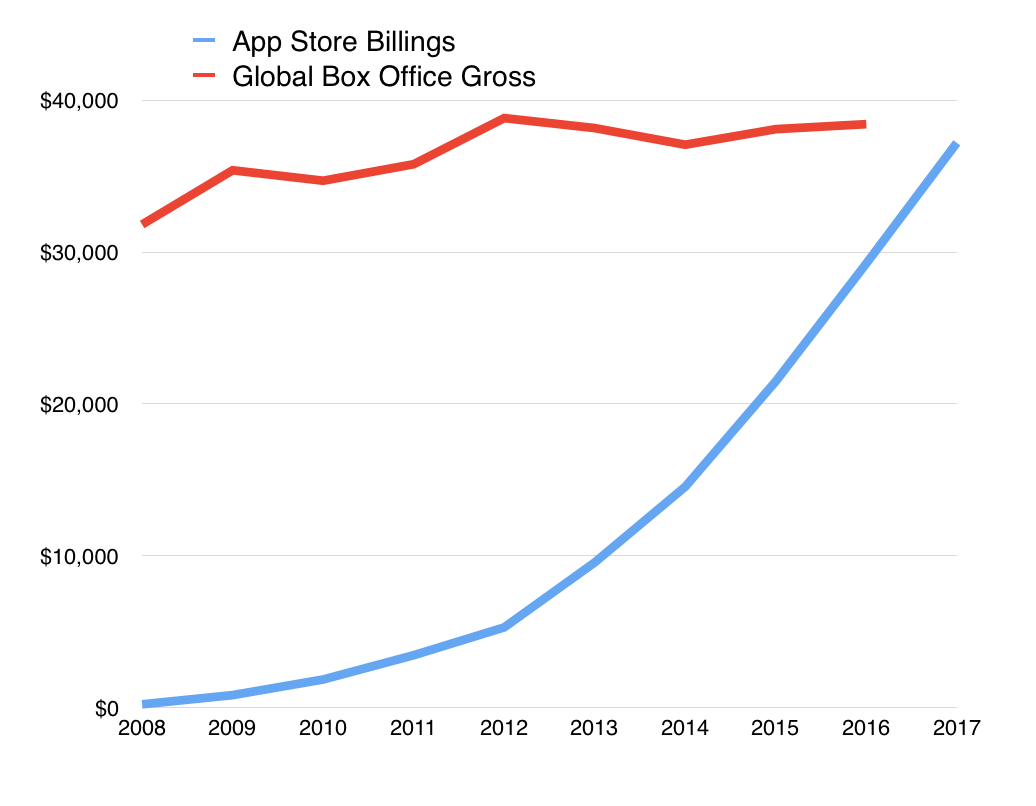
Apple’s relationship with China has always been a point of worry for investors. Nine years ago Carl Icahn sold his entire stake in Apple due to China fears. In April 2016 Reuters reported that "Icahn had been a huge cheerleader of Apple, acquiring a stake in the company almost three years ago, repeatedly calling the investment a `no brainer.'" In an open letter to Apple Chief Executive Officer Tim Cook in May 2015, Icahn had argued that shares of the iPhone maker were worth $240 ($60 split adjusted), about 90 percent more than they had been trading. At $240 a share, Apple's market cap would be $1.4 trillion, Icahn asserted. But Icahn, who owned 45.8 million Apple shares at the end of 2015, said China's economic slowdown and worries about how China could become more prohibitive in doing business triggered his decision to exit his position entirely.
Icahn’s stake when he acquired the shares was worth nearly $3 billion and he sold it for about $5 billion. A $2 billion profit. But China worries kept him from holding until today when his shares would have been worth $36.6 billion, thus foregoing $31.6 billion in profit.
Leaving $31 billion on the table (not including dividends) seems a high price to pay for a misidentified anxiety on China.
The public reasoning was: "But you worry a little bit, maybe more than a little, about China's attitude."The Chinese government could `come in and make it very difficult for Apple to sell there … [They] can do pretty much what [they] want there,' Icahn said. Earlier [that] month, China shut down Apple’s iTunes movies and iBooks stores within the country, following Beijing's introduction of regulations in March 2016 imposing strict curbs on online publishing, particularly for foreign firms."
That was 2016. Today the concerns appear to be:
Slowing sales due to rising competition from Chinese brands
Slowing sales due to Chinese economic slowdown
Tariffs and other barriers to trade affecting pricing in the US
Geopolitical threats to supply chain, including processor manufacturing in Taiwan
Should today's investor worry about China more or less than Icahn did in 2016?
In the case of competition in China, we have to understand that China does not have a free market or "laissez-faire" economy. The clue would be the middle “C” in CCP which, importantly, has a monopoly on political power in China. In spite of an ideology hostile to private property and market economics, the fact that Apple not only is allowed to operate in China but also is the market leader in urban (read: wealthy) areas and indirectly employs millions of workers and empowers millions more developers should be seen as something of a miracle. It continues to operate only insofar as the CCP allows it to continue and the CCP is nothing if not calculating. Clearly, China has seen Apple’s presence in the market (both as producer and seller) as beneficial. One could argue about who benefited most but overall deals happen (and persist) because both parties benefit.
The competition has been improving lately, but when has it not?
Fundamentally, from the consumer point of view, the competition question is moot since the alternatives are not iOS. The iOS ecosystem is incredible from a value-generation point of view, and Android has been clearly contained as a threat. (A nostalgic footnote. Recent talk of Alphabet being forced to sell Android is a wonderful reminder of the question I asked many, many years ago: why should a search engine need an Operating System (or a browser), but more about this later).
Chinese macroeconomic worries are not new (see Icahn’s from 2015). In most economies cycles are natural but in China there has been such a long expansion (since at least the 1990s) that a slowdown is considered a huge threat to stability. A recession would be seen as an existential threat. The CCP intends to manage its way through economic stress—one of the defining aspects of their semi-controlled economy is that “the state knows best” and markets can and should be controlled. This won’t last but the consequences are not likely to be catastrophic. China’s economy is probably large enough to avoid sharp changes which gives management enough time to muddle through. I would not say that this worry is unwarranted but rather that the changes are gradual enough to allow for some strategic planning.
The Tariff question has been partly touched on in a previous post. But the flip-flopping on the topic suggests that it’s a bargaining method similar to holding a gun to your head while threatening someone else that if they don’t do what you ask for, you’ll pull the trigger. Then relenting when they say nice things. Then repeating it.
Tariffs do not affect the customer relationship with the brand.
In 2016 Icahn’s worries were not geopolitical (they were just political) but has the world become more unstable since? The Covid pandemic was the trigger for much of this instability and we are still dealing with the consequences globally. However the bigger forces behind global changes are demographic and the subsequent loss of growth in China (and Russia) are causing authoritarians to find external threats to stay in power.
This will not play out quickly. There are worries but we should consider China (and India, and Africa) as sources of non-consumption that can and will be addressed with production. So the worry here is again structural and slow-burning. I would argue decades in the making.
Not much has been said about the benefit to Apple of its China strategy. Many assume that lower costs and access to a large market are all that has been gained. But it’s much more complex than that. The access was not to a lower cost base but also a much more agile and flexible production infrastructure. The flexibility allows for a very tightly coupled value chain. The result is a reduction in inventory and a rapid time-to-market which is essential to Apple’s integrated product/software/service rhythm of yearly launches.
I’d argue that without the flexible, at-scale production system China allowed Apple would not have been able to succeed at reaching a billion highly satisfied users. The world would have been awash with cheap Android phones and very few iPhones, a repeat of the PC model where hardware was largely irrelevant.
The challenge of the future is to take this model globally and either transplant it to India and other places or to scale it in such a way that it can be distributed to many centers of production. Toyota famously not only created a product system that reduced cycle time and inventory but did it with 400 plants globally. I certainly hope that the Apple Production System will also be celebrated one day as the “machine that changed the world”.
Come learn more about the Apple Production System at the ACTIVE conference.
Are Apple and Google competitors or are they partners?
Prior to the launch of the Android operating system, Apple and Google collaborated on many projects. Google Search was predominant on Apple products including the (at the time) new iPhone. The iPhone also launched with support for Gmail and had native Google Maps and even YouTube. Google was a cornerstone supplier for the new smartphone.
After the launch of Android only a year later, the relationship changed. The two companies came to be viewed as mortal enemies. The perception that Android was disruptive to Apple—insofar as it undercut the pricing power of the new touch-based user experience—was universal. The "zero price" of Android and its licensing by all other phone makers suggested a competitive collapse was imminent for the fledgling iPhone. Android phones were far cheaper and "good enough." If not immediately, then with the resources of all phone makers and Google itself, Android would surely soon overtake the iPhone in performance along all dimensions. It took a great deal of courage to argue otherwise.
But, over time, the notion that the iPhone would continue to exist became more widely held. Holding on to a "premium" positioning, iPhone seemed to be have pulled a rabbit out of a hat, perhaps because of Steve Jobs' reality distortion field or because of magical marketing. Nonetheless, doubts over long-term growth persisted.
Having survived Android, Apple was still seen as vulnerable to a multitude of Google initiatives including Chrome and Chromebooks, a range of Google Pixel phones (enabled by the acquisition of Motorola and HTC.) The entry of Google wearables (enabled by the acquisition of Fitbit), Glasses, the Play Store, YouTube content, Google productivity apps, Google cloud, Google TV, Nest, Google Assistant and numerous other services were all cited as nails in the iPhone coffin. This is all before the age of Crypto a new generation of AIs came into fashion.
Throughout this period the iPhone continued to increase its audience, growing its base of users not only from smartphone non-users but also from so-called "switchers", that is, those who moved from Android to iOS. Apple has benefitted from this net positive switching for at least five years now as most of its addressable market has already adopted the smartphone. There are about 1.2 billion iPhone users and it's far more likely that a new iPhone user today arrives from the 3.5 billion Android users than from the 3.2 billion people who don't yet have any smartphone. That is because those who don't yet have a smartphone today are also likely to not yet have access to electricity, cellular networks or money.
Indeed, it is Android that seems to be in a precarious position. The ecosystem is bleeding not just high-end users but also from fragmentation. Chinese OEMs in particular deliver their own experiences and code bases, eschewing Google services altogether. Large OEMs such as Samsung are seeking to differentiate with their own experiences and ecosystems and accessories and chafe against Google's hardware offerings. Upgrade rates to new Android versions are poor. Support of hardware beyond a few years is lacking. But, most fundamentally, Google has not developed a business model that directly fuels development of Android.
Put simply, Android is not a profitable product. It's not designed to create revenues. It's designed to reduce costs.
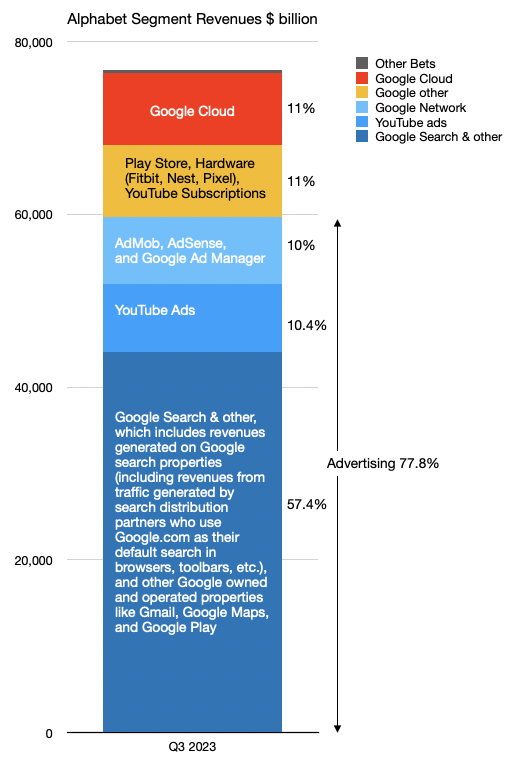
To understand this, we have to understand Google's business. It's not very complicated. Google's revenues in the last quarter are segmented as follows:
The colors above indicate the major categories. Blues are Advertising, yellow is "Other" and red is Google Cloud. Other Bets, consisting of research projects, is a 0.4% rounding error. Apart from Search which is about 60%, each major category is about 10%. Advertising as a business model is about 78%.
To Alphabet's credit, Advertising as a business model has been reduced from 94% a few years ago. Much of that credit goes to Cloud which is a B2B business and has completely different resources, processes and priorities than Search. The "one trick pony" label is less applicable to Google today.
Search however, and the ancillary properties, are still, by far, the largest sources of revenues and profit. Note that Android itself is missing from this mix apart from Play Store which is a direct Android extension. Play does contribute somewhat as part of "Other" but the OS itself is an enabler across all these categories.
While not directly producing revenues, what Android does is perhaps even more important. It helps reduce the amount Google has to pay to access its customers. Think of Search as a system which takes queries in and puts results out. These results are what advertisers pay for and the queries are what Google pays for. The output depends on the input. That input is harvested from many users. Access to those users is not free. The cost can be paid by building access directly (Android) or by paying for access to someone else's property (Apple, Windows, or Firefox). In old-school business terminology this is called distribution.
Distribution is often ignored or considered a superfluous "middleman" to be bypassed. But distribution is foundational to any business. It is, effectively, other people, outside your company, helping you sell your product because they have access to the customers. They get paid for that access, often with a percent of sales. Stores are distribution. Wholesalers are distribution. Resellers are distribution. Without distribution scale cannot happen. Distributors help both producers and consumers by creating access.
Access is also provided by what we call infrastructure. Just like you can't travel by car from your house to your destination without roads, all access to products and services is effectively infrastructure. If you own the infrastructure then you have to pay to build it and maintain it. If you don't own it you have to pay to use it. All infrastructure has value and all infrastructure has costs.
This all makes more sense when recalling the historic birth of Android. At the time (2006 to 2008) the worry for Google was that Microsoft's mobile operating system (Windows Mobile née Windows CE) would be licensed as was Windows. That is to say that all phone OEMs would take a license for a nominal fee and build Windows Mobile phones. Microsoft would thus dominate the mobile computing market the way it dominated the PC market (with market share above 95%). Microsoft would then ensure that Bing search was the default on all devices running Windows and Windows Mobile, thus blocking access to what was expected to be the next 3 billion users while capturing all search ad dollars ad infinitum.
If Windows Mobile were to dominate, Google would be denied distribution, at any price. It would thus be relegated to, at best, 10% market share of mobile search. This would be an existential crisis.
In this setting, Apple was an ally for Google. Apple was not a search engine provider and was very welcoming of Google search on a nascent Safari browser. Whereas Explorer would block Google search, Safari would offer default placement. Not for free, but for a reasonable cost. Google was a "go-to-market" partner for Apple and it was a symbiotic relationship.
However, the expectation of Google at the time was that Apple would be no more successful with iPhone than it was with the Mac: A fringe of "creative" or "fanboy" quirky oddballs. This was not just Google's expectation. It was everyone's expectation.
Android was built to counter a Microsoft mobile OS monopoly with a "zero cost" option vs. Microsoft's end-user-license model. Microsoft made money selling software. Both system software (Windows) and application software (Office.) Google would give away system software (Android) and services (Gmail and Docs) but make money on advertising.
A genius move. Phone OEMs would much rather pay zero of the OS on their phones than for the non-zero Windows Mobile license. [On a $200 retail cost phone (and thus $90 bill of materials) a $8 OS license is a huge cost.] Google's Android did indeed block Windows Mobile from getting a foothold in the post-PC era.
But it did so by taking some short cuts. Android itself was an acquisition in 2005 (for $50 million, with a keyboard interface) and, in response to the iPhone, a new touch user interface was developed. It so happened that this interface copied as closely iOS as Windows had copied the original Mac. This perceived theft was such an affront to Steve Jobs that he declared war on Google.
It was important to ask (as few did) why did Google need to develop an OS, only to give it away. Was its business that robust if it needed to expend enormous energy and capital to build an enabler? The answer is, of course, distribution.
Google was initially not paying for distribution as most people just typed "google.com" into their browsers. As the URL field became a search field, Google could still expect PC users to make Google.com their search bookmark, one click away.
But on mobile devices, the friction of the constrained interface meant that defaults mattered. Mobile was going to require new distribution economics. Devices were going to be in the hands of many more people, who, since they did not have full-size keyboards, would type less and who would interact in new (and very succinct) ways. One click away was one click too far.
With Android (and Chrome) Google set defaults for its services across the platform. If Android was the OS then Chrome would be the default. If Chrome was the default, then Google Search would be the default. For these Android-sourced queries, Google would not pay for distribution. Or, more precisely, would only pay to build and keep Android. Thus the more Android there was, the cheaper it was to obtain search queries for Google. Google had built its own highways: it owned the infrastructure that connected users to its services. These roads were for Android users. And what about iOS users?
Over a 15 year period the smartphone went from essentially zero to 5 billion users. It became so important to those 5 billion people that they keep it with them every waking moment, use it 100 times for a total of 5 hours each day. That adds up to 182,500,000,000,000 interactions a year and, as a result, it has changed behavior, politics and humanity itself.
Throughout this period, the relationship between Google and Apple changed. From being allies, to mortal enemies to, as we shall see, partners. We have to understand this new relationship that has emerged and its consequences.
The next post will explore the relationship in detail using the lens of the deal structure that exists. A deal which is not public and largely unexamined.
As I remember it, at least 10 years ago, I began to hear anecdotes from developers who built apps for both iOS and Android about their economics. The story is that they tended to have twice as many users using Android but that iPhone App Store revenues were roughly twice those of Google Play Store. From that I devised a rule of thumb that an iPhone user was about 4 times more valuable than an Android user. Half the users, paying 4 times as much means double the income.
Over the years I came across a lot more data about market development (the diffusion of innovations) and market creation (the innovation process) and applied it to transportation. Along the way I also became more aware that figures of consumption and spending are not normally distributed. That it turns out that the governing function of much of human behavior is log-normal. That is, it is skewed rather than balanced or symmetric around an average. Classic examples are income distribution and the distribution of travel distances.
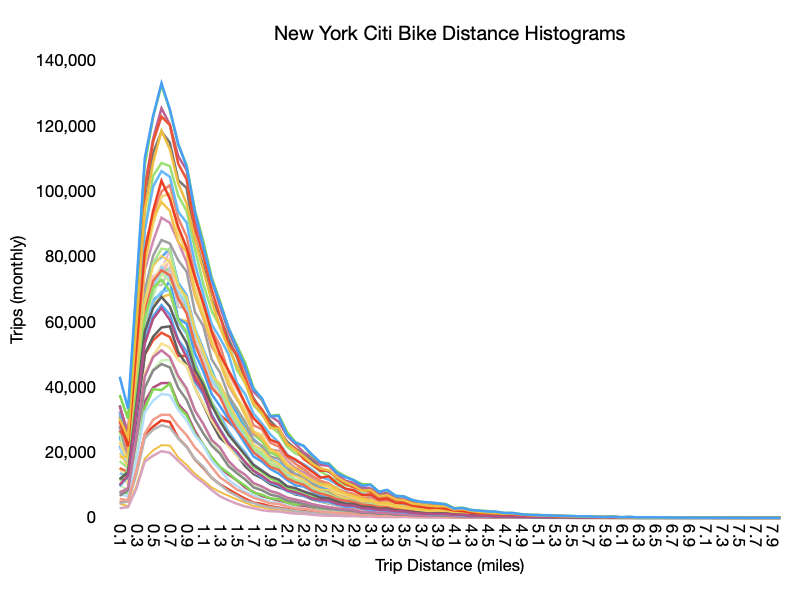
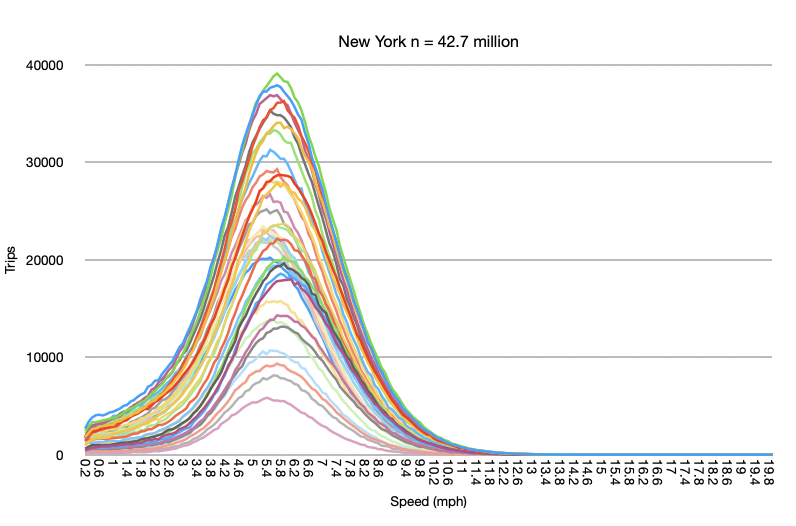
Consider the following diagrams: Trip Distances vs. Trip Speeds for New York Citi Bike travelers (n=42.7 million.)
The different lines represent different time periods spanning the months of the year.
The top graph shows that most trips are short, and the average distance is not the most common distance. The bottom graph shows that the average speed is the most common speed. The top graph is very accurately modeled with the log-normal function. The bottom graph is the classic bell curve of the normal or Gaussian function.
Income is log-normally distributed and so it has to be with services revenues. There must be a definite skew where there is a disproportionate spend by those who have more income. Thus segmenting or, to put it less kindly, discriminating customers properly is super important. Customer quality is just as important, perhaps more so, than quantity.
So let's revisit the question of user quality for online services.
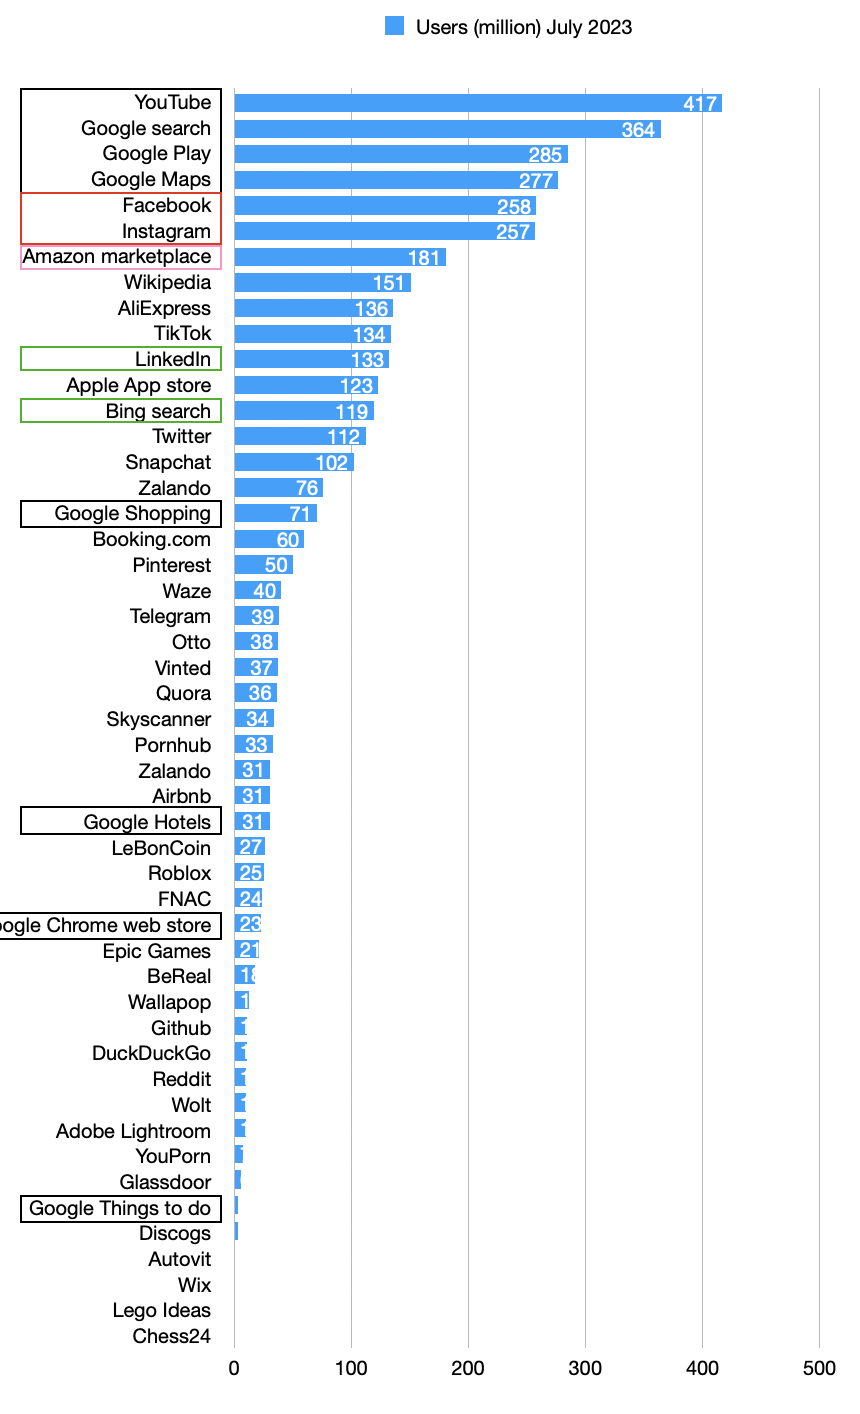
Unlike 10 years ago, there is a lot more data. The EU, for instance requires a report of the number of users on each platform.
The figures I want to focus on are those of Apple App Store and Google Play Store: 123 million and 284.6 million respectively. These are strikingly similar to the ratio of 2x between iOS and Android from my old anecdotes. However, if we look at global data, Apple claims 650 million active App Store users while Google claims 2.5 billion active users. That makes the global ratio closer to 4x Android. However, if we look at the US, the ratio is 167 million iPhone users vs. 144 million Android. In the US, iOS is a majority.
This is explained by income. The wealthier the user base the more iOS seems to be in use.
Now let's look at revenues for the platform stores.
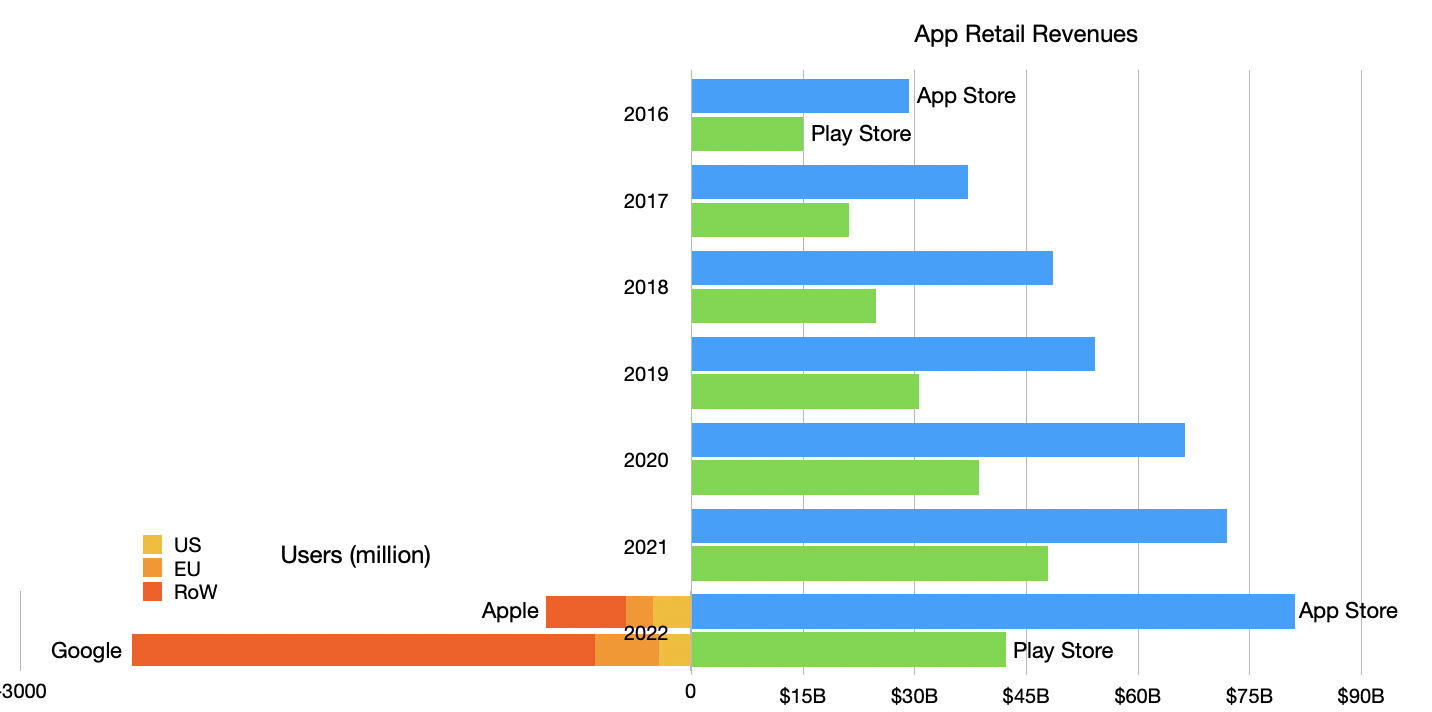
On the right side is the history of retail revenues by year from 2016 to 2022 and split between Apple App Store and Google Play Store. Mirrored on the left is the number of users, also split by store but also by region, but only for 2022. [App Store revenues are my own analysis (with validation against other sources) and include billings not just Apple's own cut. Play Store revenues are from Business of Apps.]
The ratio between revenues has kept remarkably steady, with 2016 revenues at a Apple:Google ratio of 29:15 (1.93) and 2022 at a ratio of 81:42 (1.93).
The global user numbers are, as mentioned, 3.8 to 1.
[Aside: One sanity check on the data is that the 650 million App Store users is about half of my estimate of iPhones in use (1.2 billion). That might be alarming. Why are only 54% of iPhones in use paired with App Store use? However, if we take the sum of both App Store and Play store users (3.15 billion) and compare it with the total number of global smartphone users (6.92 billion), we discover that 45.5% of all smartphone users use some store. Adding Chinese Android stores we can see that the ratio of 54% for iOS is somewhat consistent.]
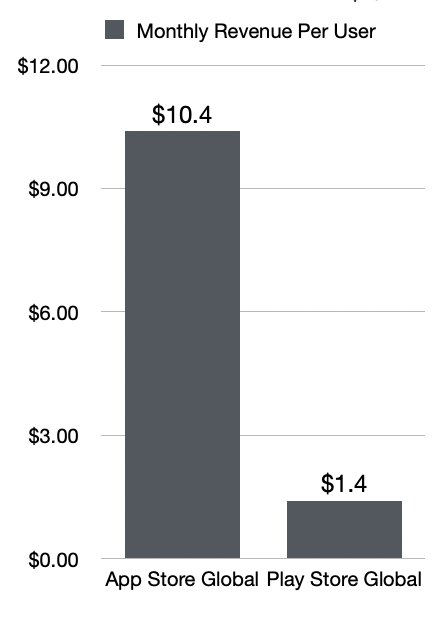
Thus we can compare the app revenue per user of the two platforms by dividing global revenue number by the global user numbers. The results are shown below:
I scaled the spending to a per-month basis.
So the picture becomes clearer. The iPhone customer is 7.4 times more valuable than the Android customer. This is more impressive than the 4x rule I had 10 years ago. The reasons are mainly that my anecdotes were from developers who sold products in the US or EU whereas expansion of smartphones to 7 billion global users has drawn in more lower spending customers.
But Apple's base has also grown to over 1 billion users (650 million store users). This highlights that Apple has effectively grown and discriminated customers effectively. It obtained not just 1 billion customers but the best 1 billion customers.
How to discriminate effectively is the holy grail of marketing. The naïve approach is to keep prices high. But that usually only results in a "luxury" branding and a small base that tends not to grow. The alternative "premium" approach is to offer functionality and multiple tiers and distribution options and financing and merchandising. There is no simple formula.
The bottom line is that Apple's approach is attracting 650 million $10/month app spenders. When we factor in additional subscription services, we get to the juggernaut that is Apple Services. This analysis has shown how difficult it is for anyone to come close to this quality of revenue.
As we look forward to Spatial Computing, the idea of increasing that spend from $10/month for a small glass rectangle in your palm to perhaps $100/month for an immersive 360-degree 3D experience does not sound too crazy.
But only if you can find those customers. I suspect Apple already knows who they are.
If you want to learn more and hear an in-depth discussion on this topic make sure you subscribe to the Asymetric Podcast on Supercast and Apple Podcasts.
Five years ago I used the Cook Doctrine (put forward 12 years ago) to assess the possibility of Apple's entry in the car market. That doctrine states, among other things:
We believe that we need to own and control the primary technologies behind the products we make, and participate only in markets where we can make a significant contribution.
Tim Cook
I concluded that it was not a question of if, but of how and to what degree Apple could make a significant contribution. How in terms of control of the technology and to what degree in terms of significance of contribution.
It was a tough call five years ago and it's still a tough call today. Arguably the failure of initial efforts to meet the Cook doctrine have caused resets and reboots and pivots which means no entry is visible in the near future.
But there is another effort that Apple has undertaken in the automotive space which might be indicative of their intentions and capabilities.
This is an effort that hardly gets mentioned and was dismissed as immaterial a long time ago but I would argue it has made a contribution. It's also unique for Apple in being a licensed software technology made available to hundreds of licensees and extending a software and services strategy to non-Apple hardware.
I am speaking, of course, of CarPlay.
CarPlay was announced almost exactly 6 years ago. It implements a unique division of labor between the iPhone and the on-board hardware. A division that keeps most of the computation and data on the phone but displays and allows inputs through the car. As a result it can evolve with new versions of iOS while keeping car inputs and outputs functional even when they age well beyond the lifespan of several iPhone generations.
It can be argued that CarPlay is a necessary "connector" for the iPhone for that one hour a day that many iPhone users spend in their cars. It is effectively a better way to control the iPhone and have it be the "brains" of the infotainment system. In that regard it's very similar to Apple TV: controlling the "dumb" TV without having to be a screen. The difference here is that CarPlay does not need an Apple remote.
But how is this significant? It improves things, sure. It improves most in-car experiences related to making calls, music, navigation, calendar, messaging, podcasts and news. It also seems to have traction.
The measure of any product introduction should be adoption and in that regard CarPlay could also be seen as significant in its departure from the Apple play book.
Because the adopters are not users but carmakers, the decision to deploy it depends on it being licensed and put into cars that are produced and made available. Quite a different set of hurdles, these are the "orifices" that Steve Jobs famously riled against.
One of the aspects of adoption by institutions vs. adoption by consumers is that whereas consumers are influenced by an early adopter calculus followed by the observation and imitation of others, for institutions there is a long delay with indecision followed by a rush to do adopt in unison with competitors. In other words, the adoption curve for consumers is a continuous gradual uptake whereas for institutions it's a flat line followed by near-vertical step function.
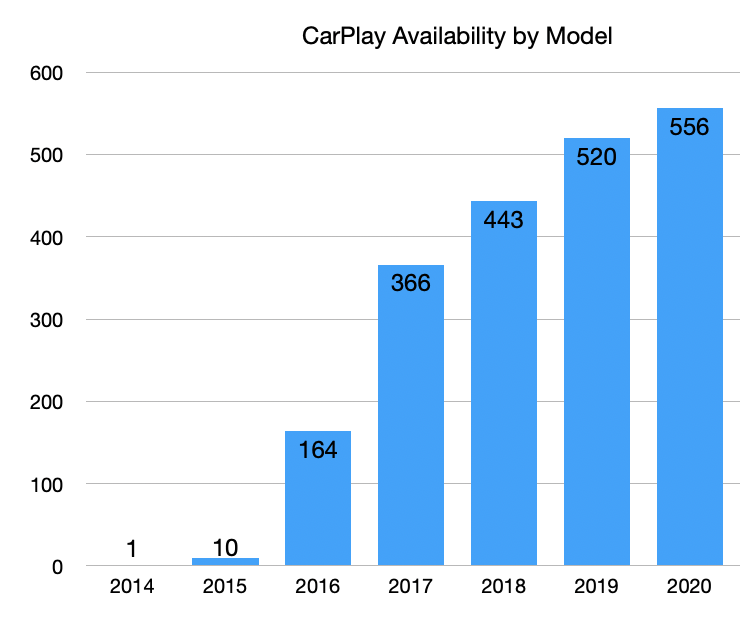
We can see this with the following graph showing the number of car models supporting CarPlay for the model years they represent.
2014 and 2015 were very tepid but 2016 and 2017 saw huge leaps in adoption. Since then there has been a steady filling out of support. At this point in time about 600 car models support CarPlay which is very nearly all the models available in the US market and a substantial number for the markets where the iPhone is widely used.
So is CarPlay significant and can it provide control? On the control side the answer is a tentative yes. CarPlay creates an iOS bubble in the car and it sustains the iPhone ecosystem with no incursions by alternatives likely. [Android Auto which seems to have a similar degree of adoption does the same for Android but there is no "pull" of switchers from one to the other.] Anecdotally, CarPlay support has become a hygiene issue with carmakers. Having it offers few advantages but not having it may repel users.
On the significance question, the answer should be "it depends". The support seems substantial but it's hard to assess market share of models as a complete list of car models available is not easily obtained. Apple has effectively injected software in a lot of cars and done so relatively quickly. By licensing it has amplified its reach much in the way Microsoft did with Windows and the Intel PC in the 90s. The speed is remarkable because everything in the car industry happens very slowly.
More than 1000 licensed car models in 4 years. This is quite a feat.
But the software touches only a fragment of the car. Infotainment is important, perhaps more than anything else the user perceives about the car experience. But it has not changed what the car is. It has not made driving safer nor more productive or more efficient.
Messaging and calling and mapping/navigation notwithstanding, significance needs to be measured in more important terms. The iPhone is significant precisely because an iPhone is not a Phone. The Apple Watch is significant because it's not a Watch. AirPods are significant because they are not just acoustics.
CarPlay would be significant if it made the car something it isn't and not keep the car being what it is. We know it should be something else and that is what we are all waiting for.
In March 2016 Ben Bajarin and I put on an event called SUBSCRIBE where we asked, among other things,
How will the online services business models evolve?
How will hardware affect software and services and vice versa?
How will users, usage, and capital connect?
Now is a good time to look back on that event.
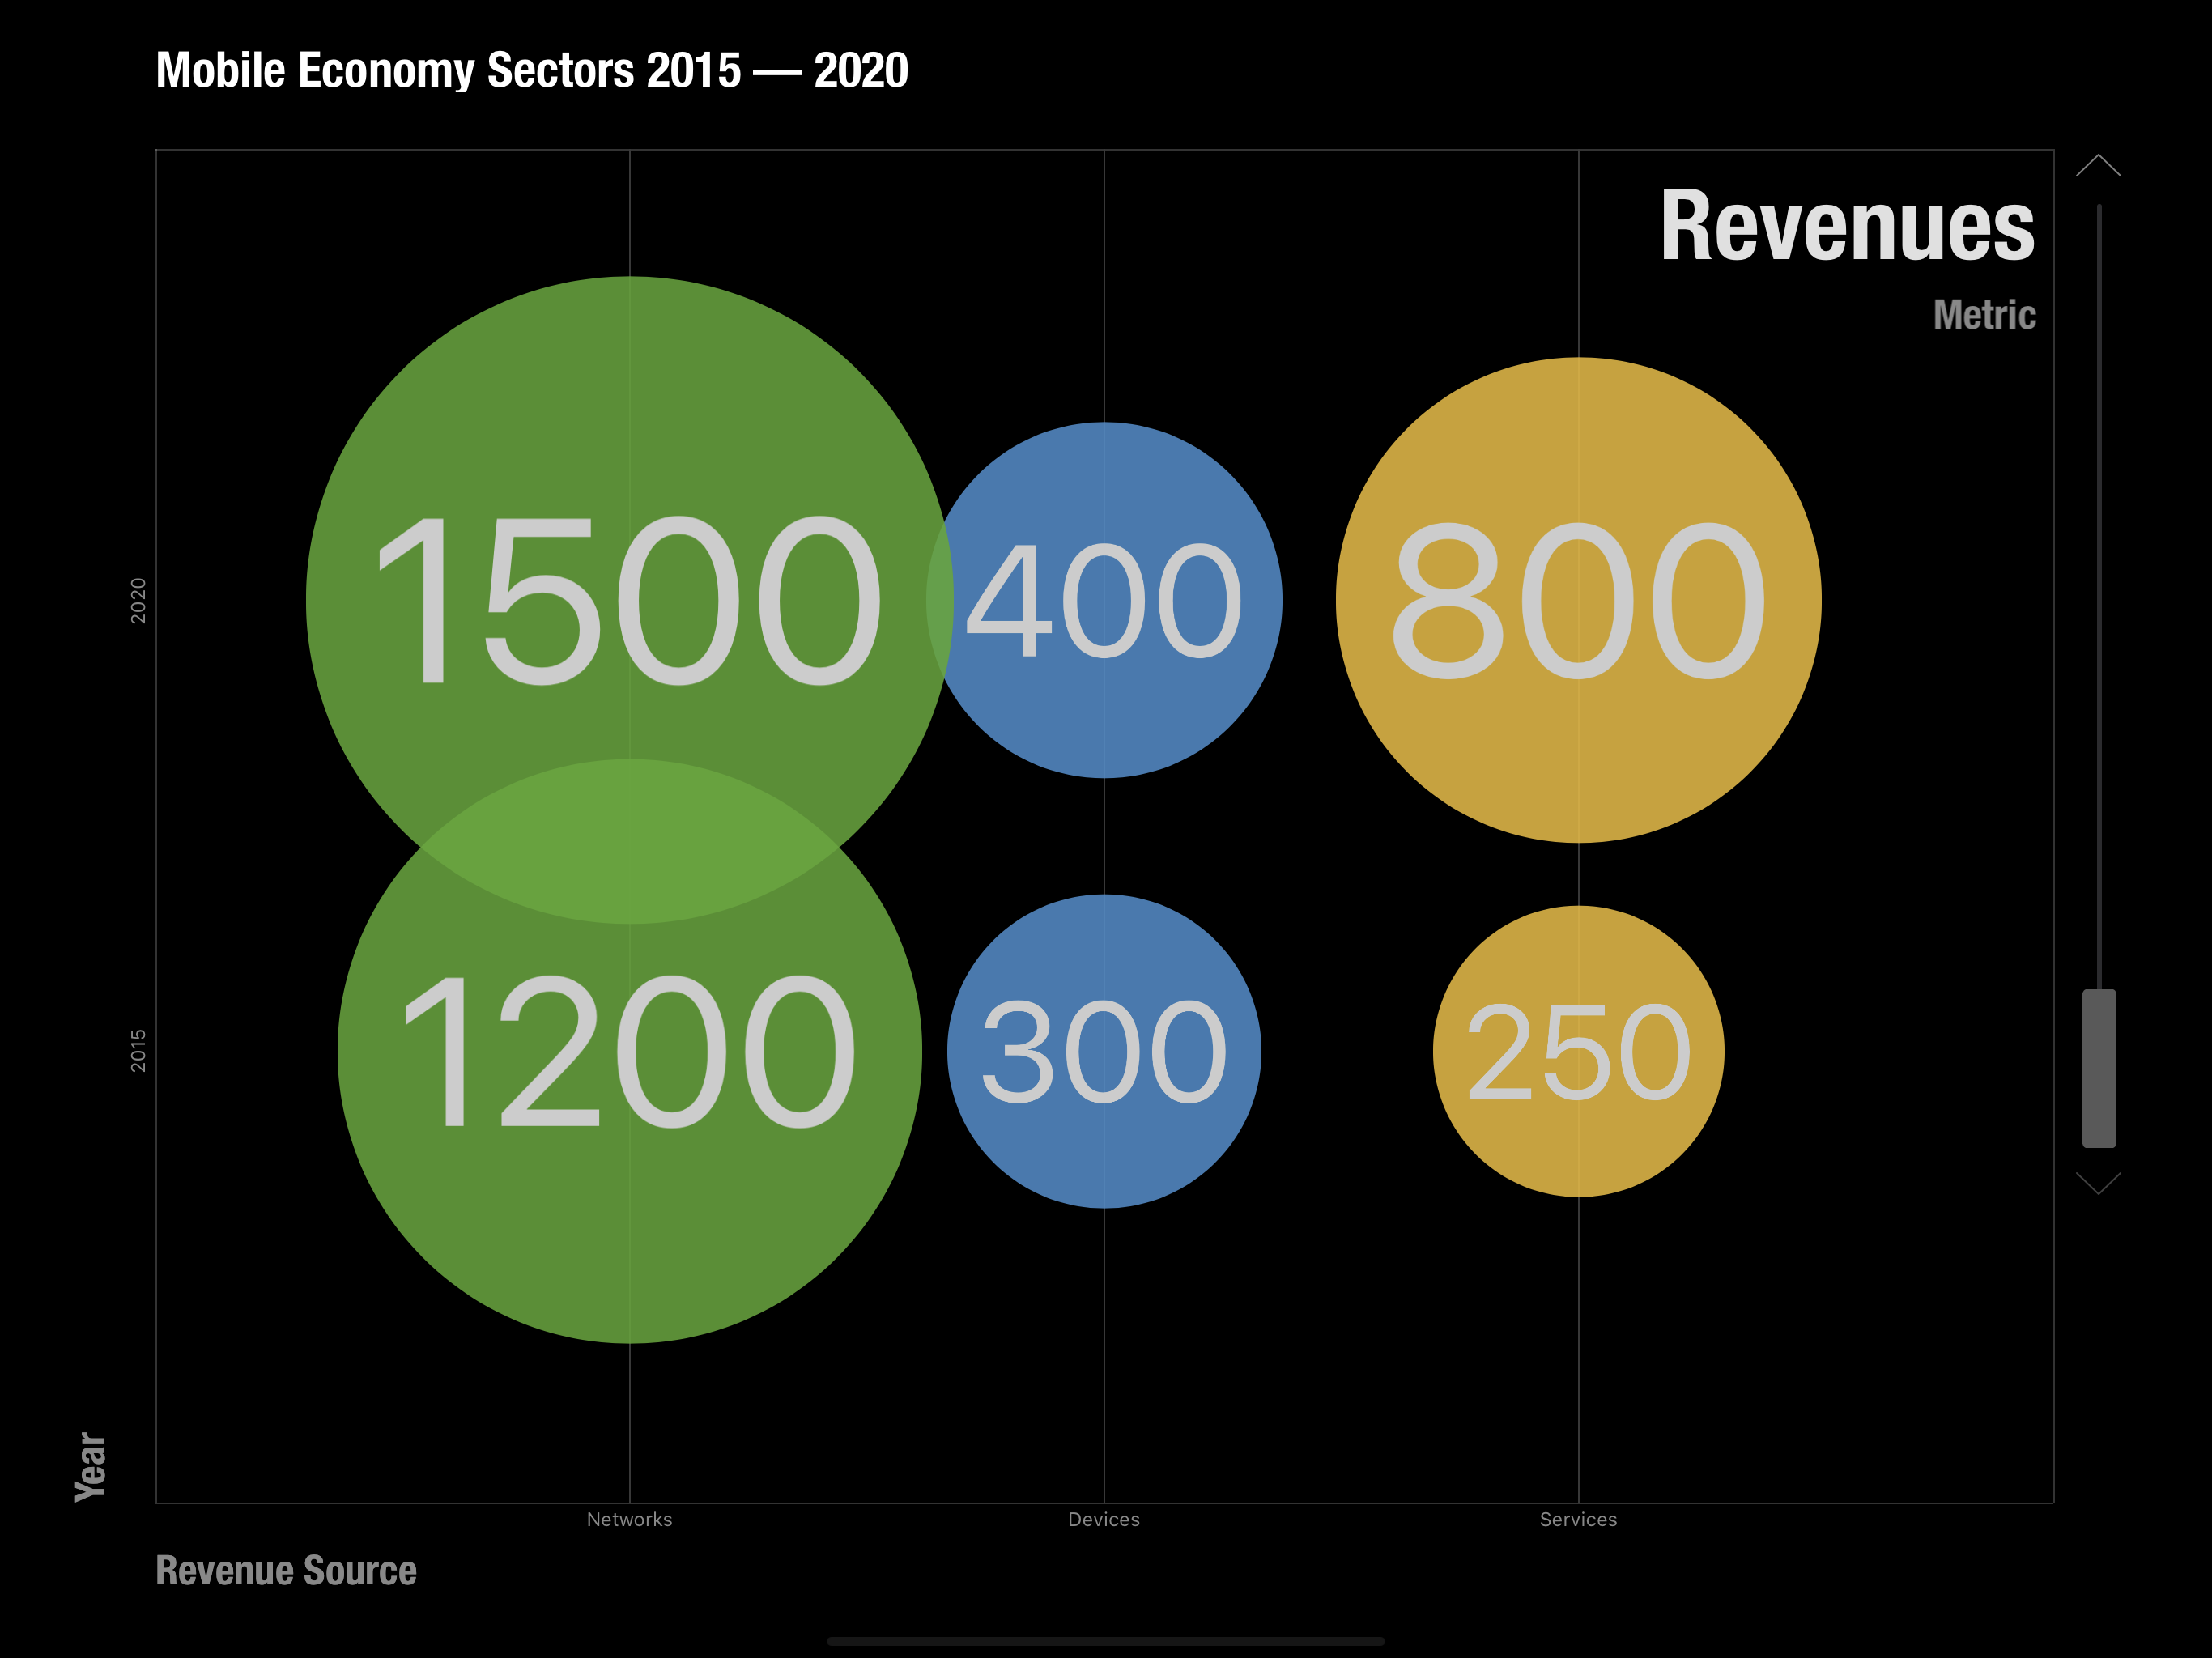
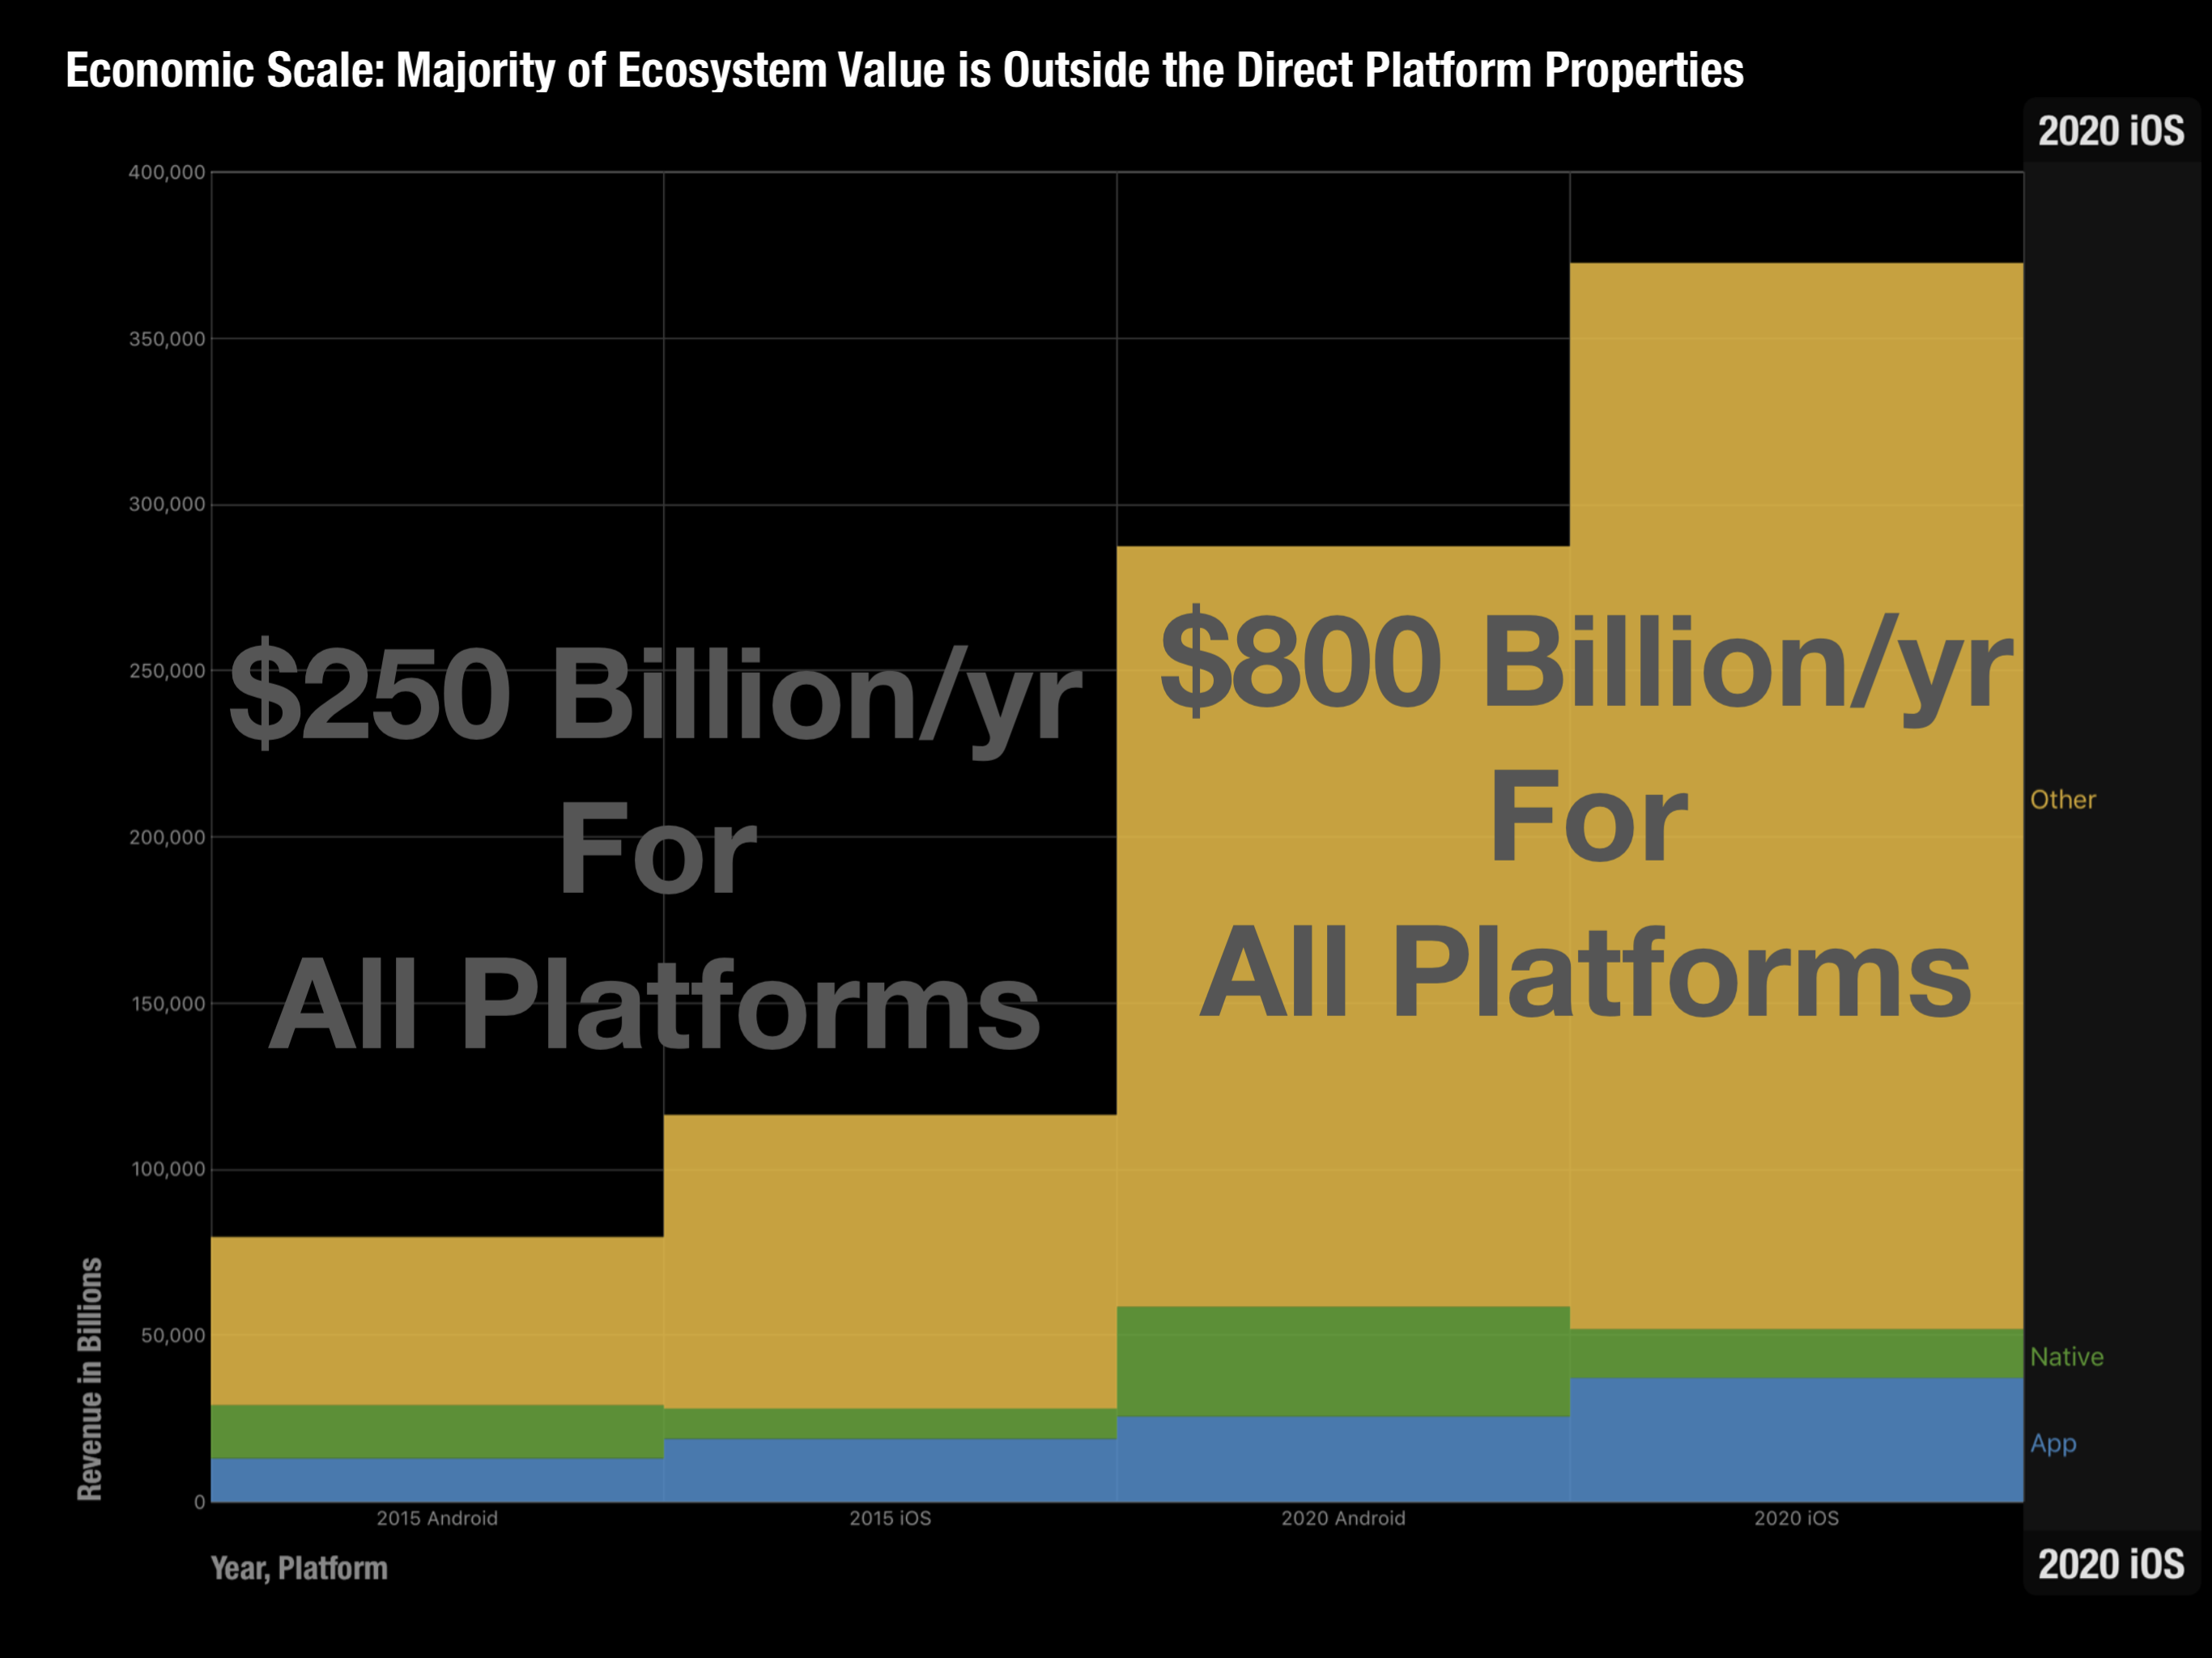
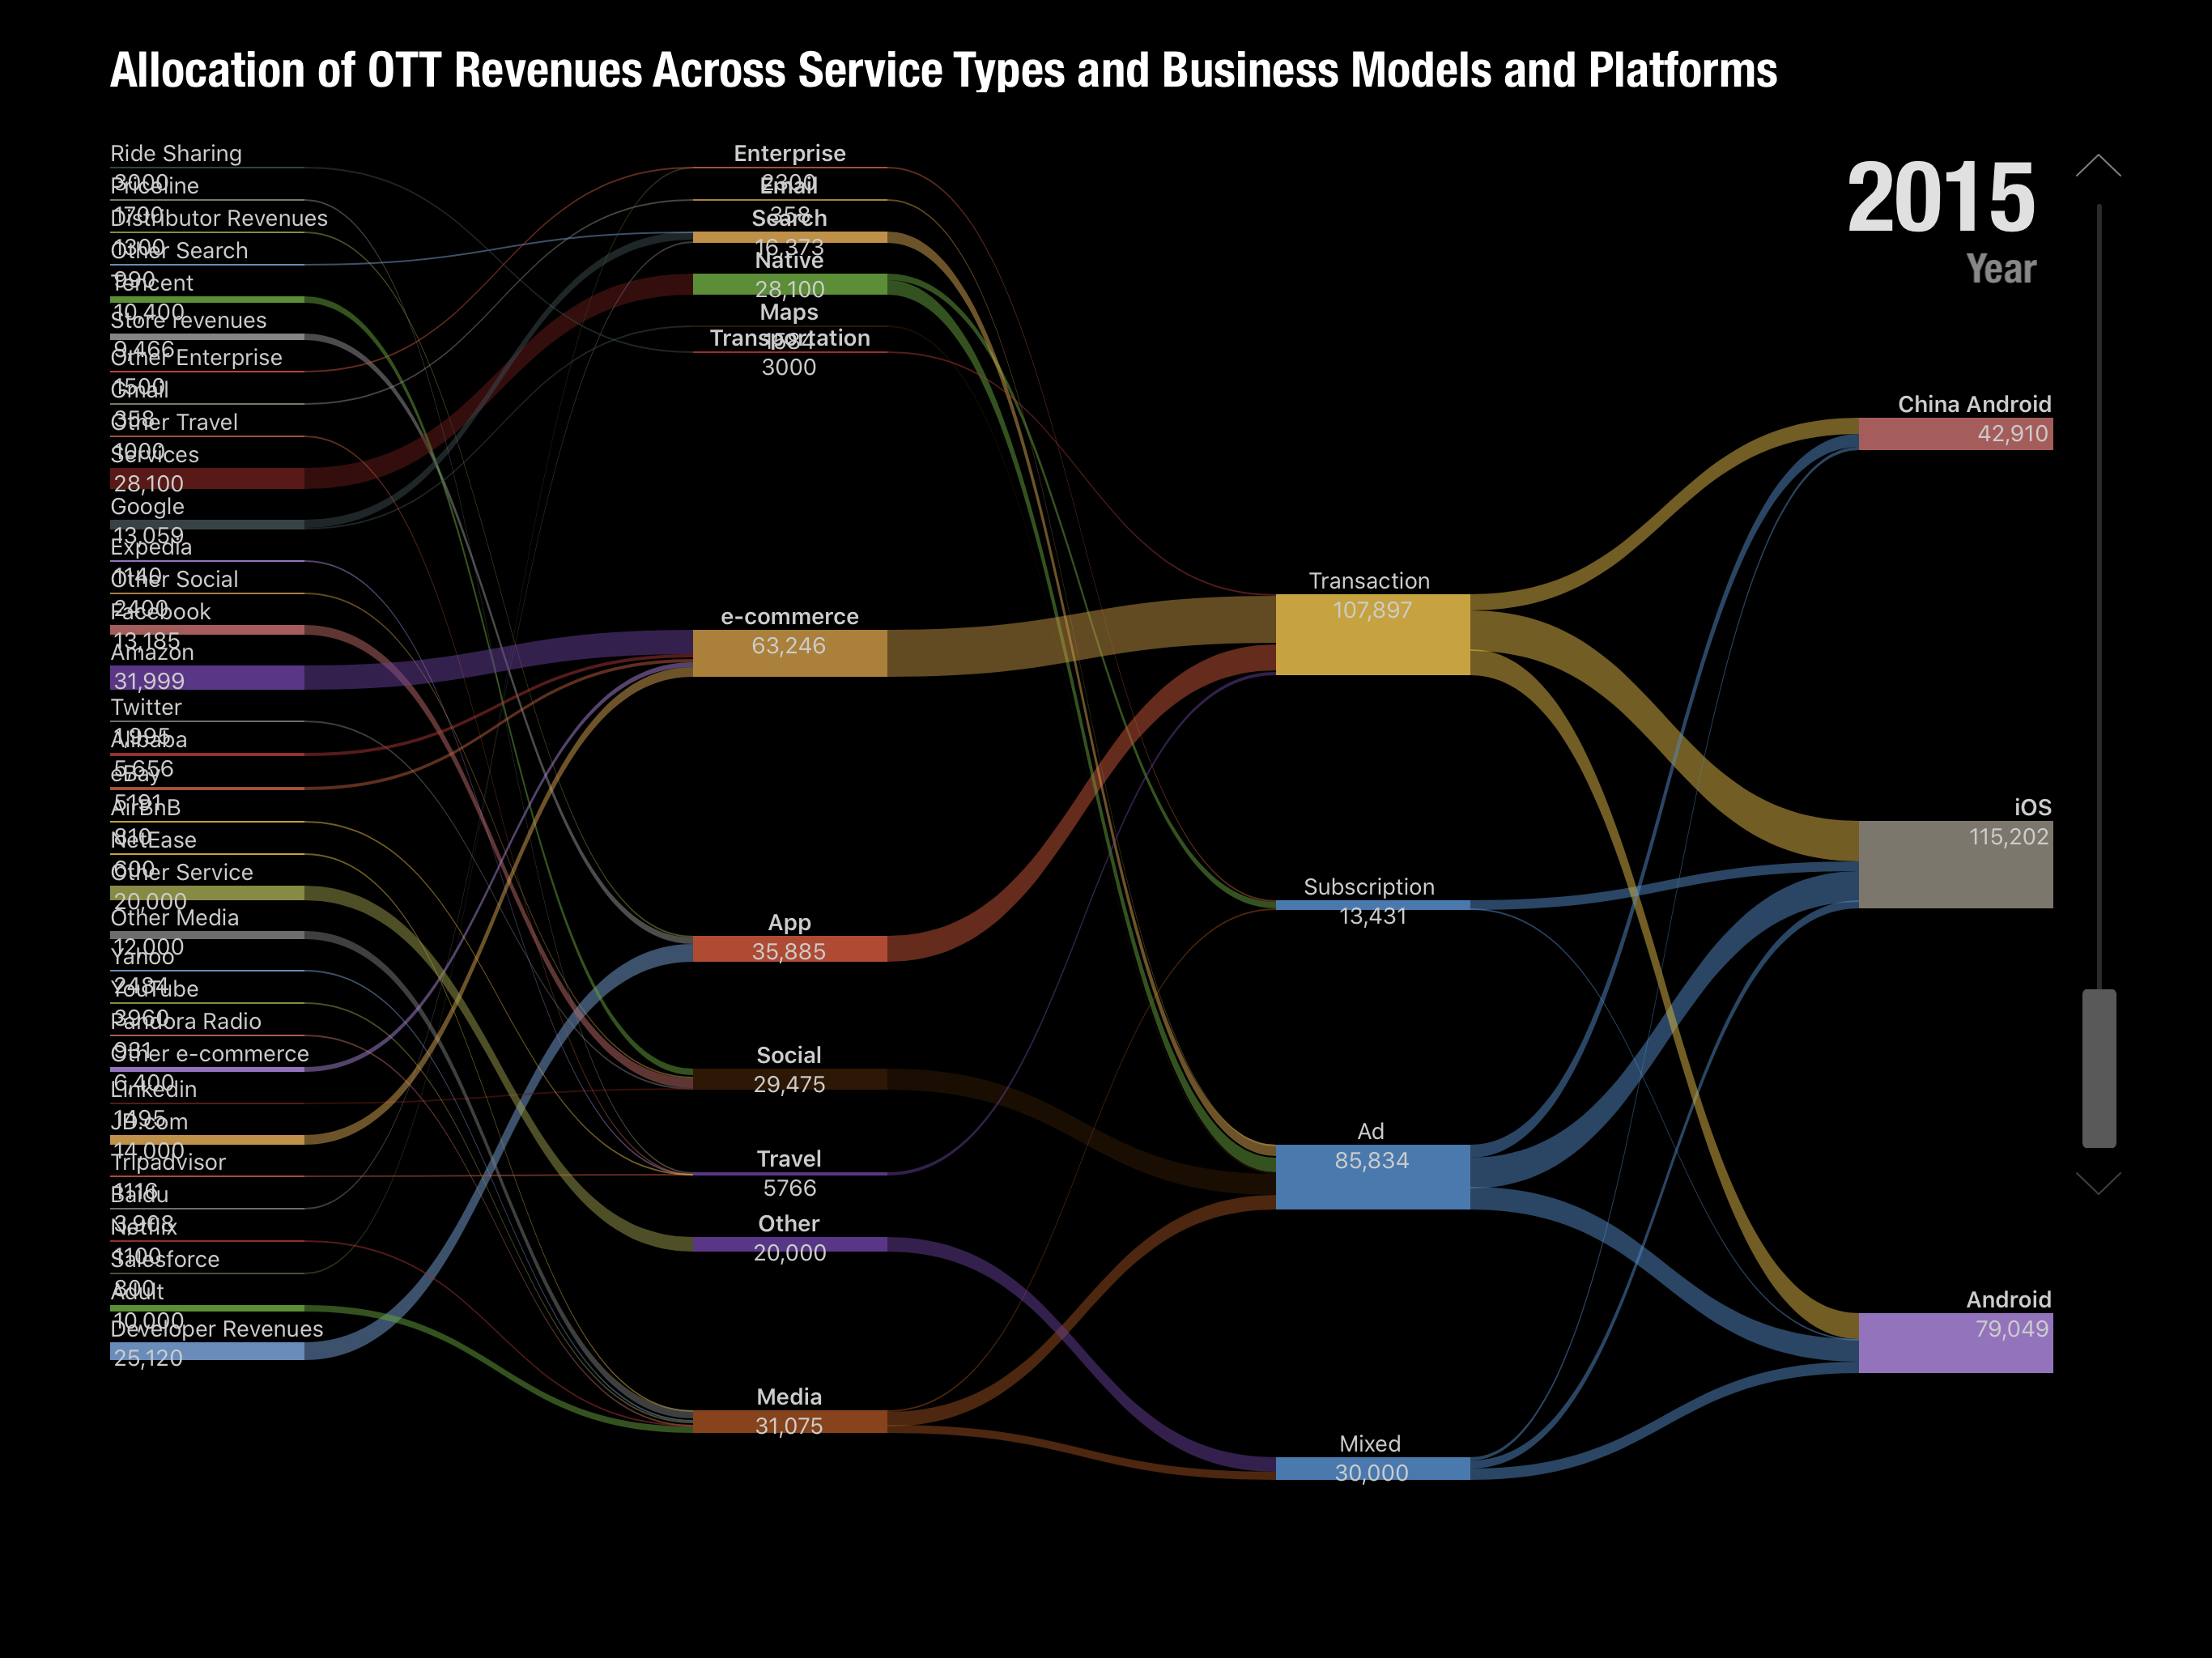
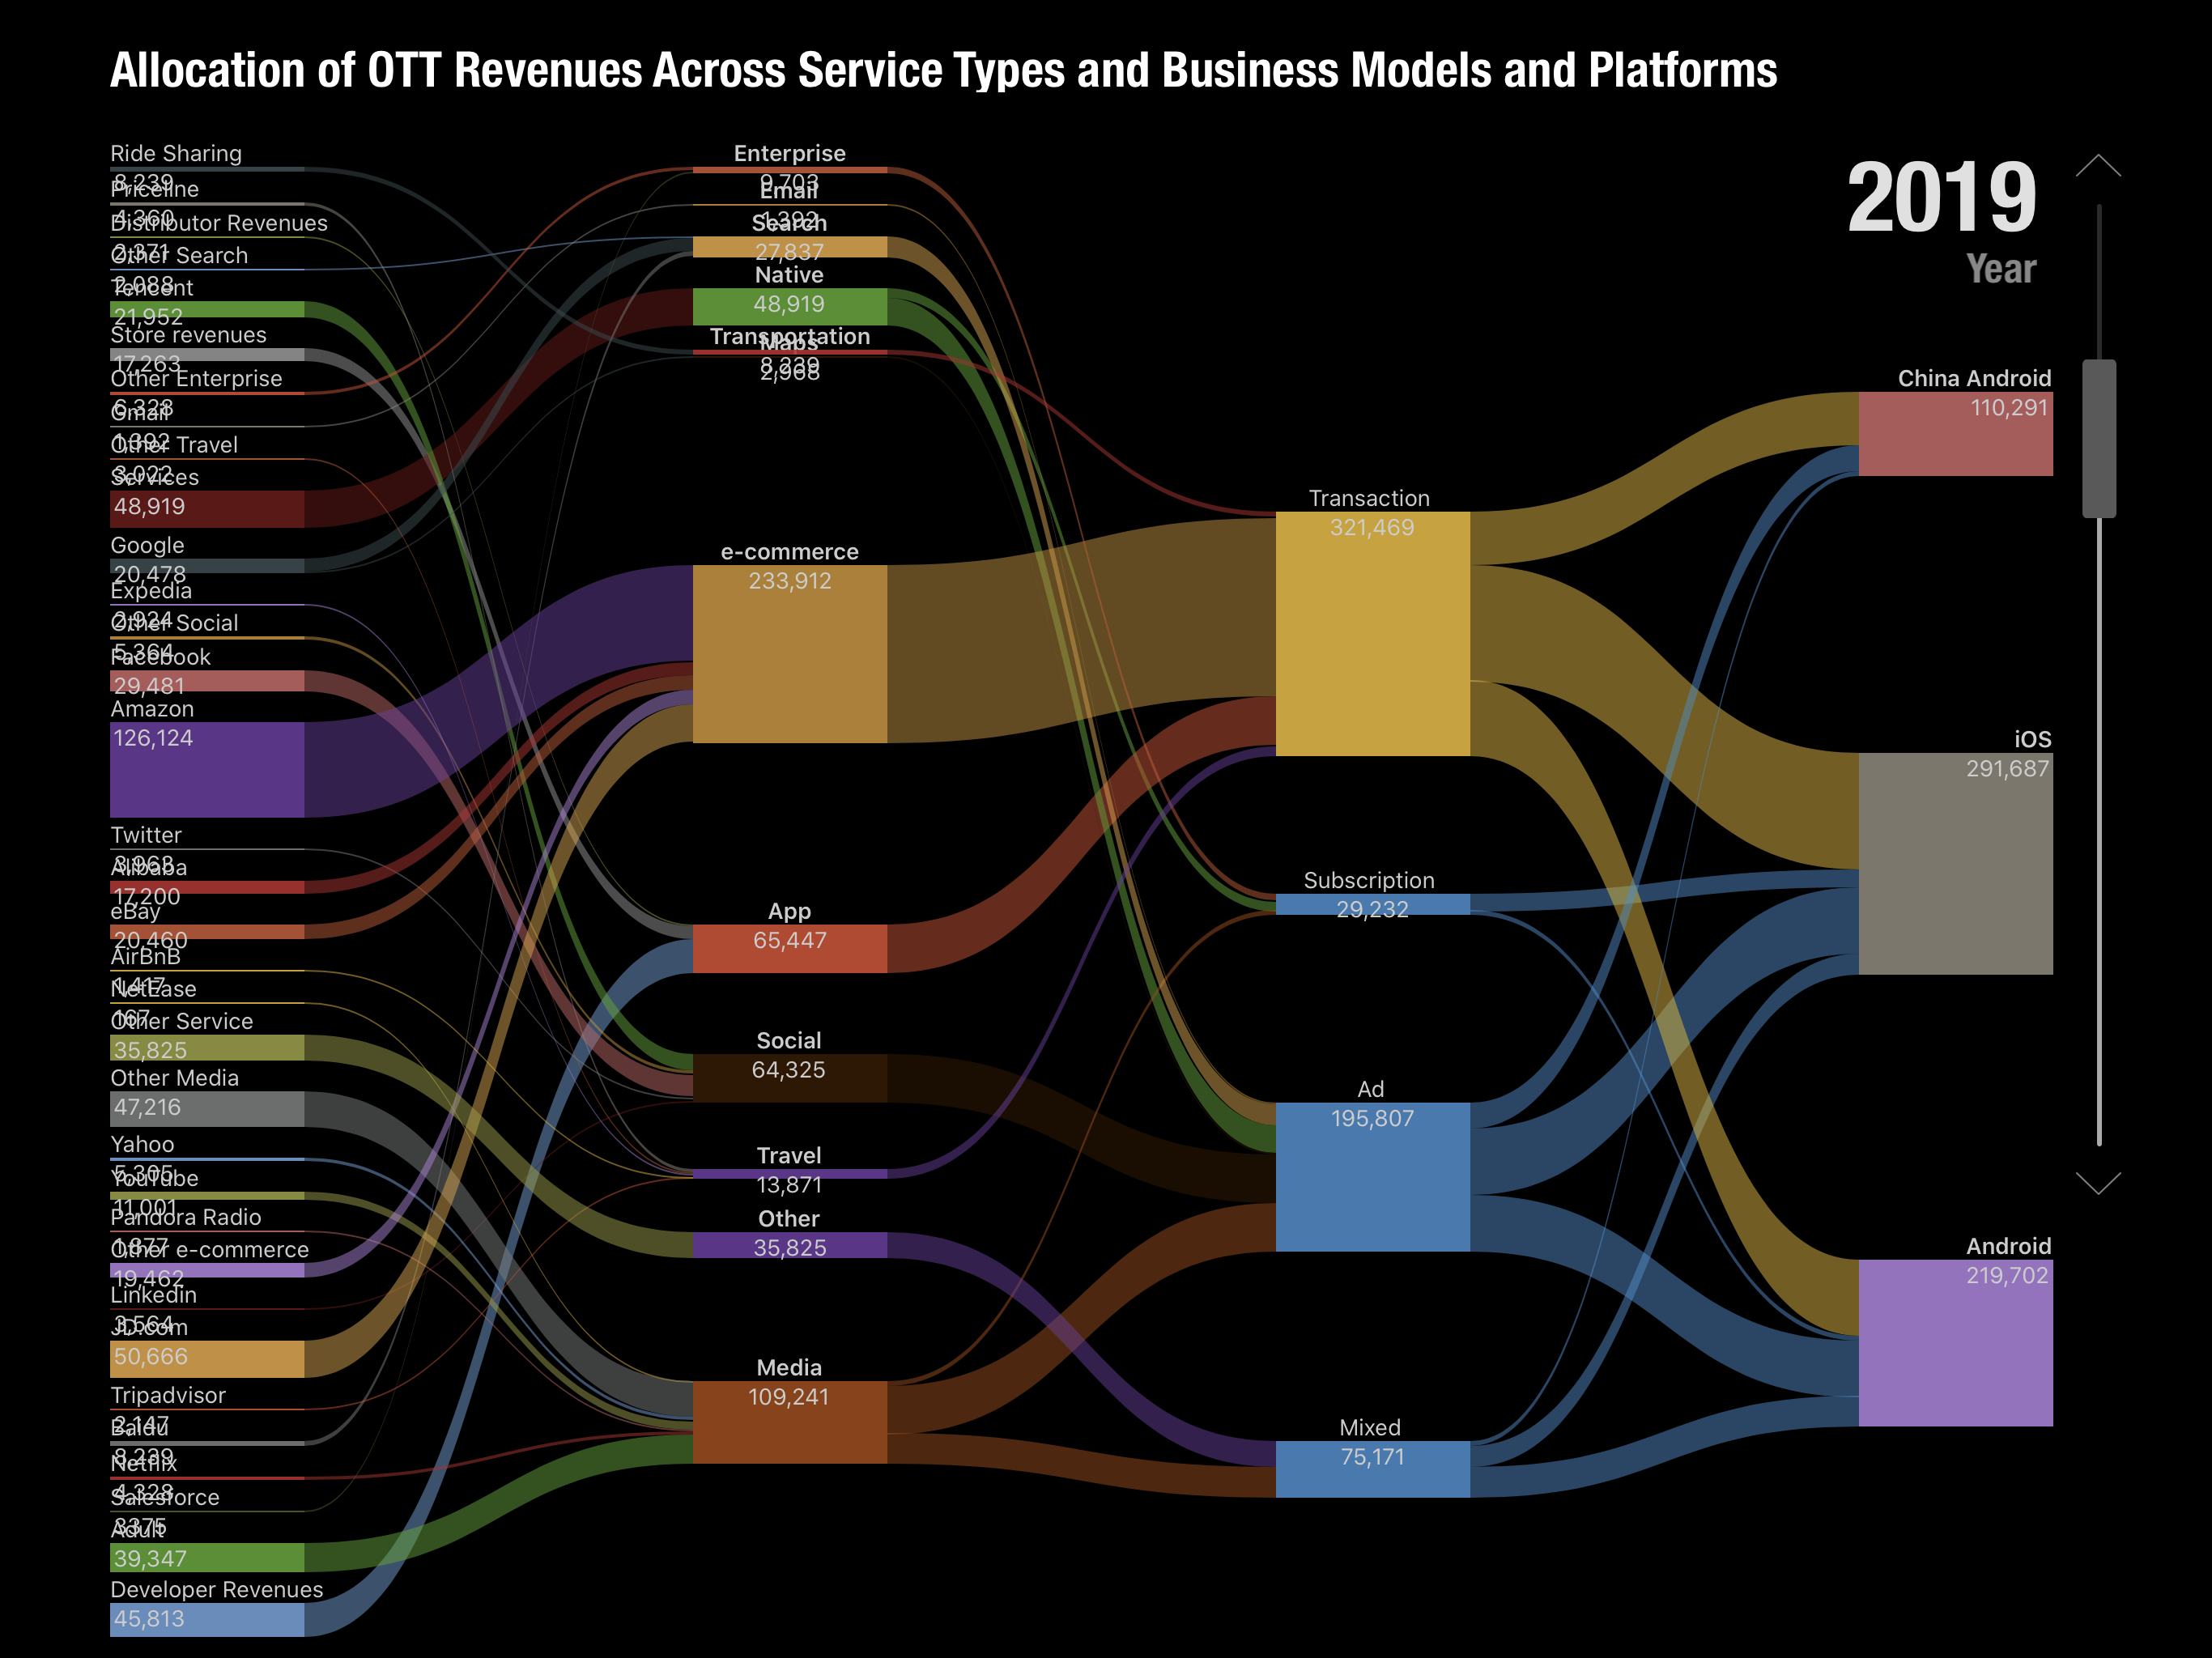
For the keynote I prepared a model which predicted the mobile ecosystems for iOS, Android and Chinese Android over the next 5 years (to 2020). The methodology involved taking a measurement of the revenues of the top internet service companies, building up the categories these companies occupied, estimating how much of those revenues are through mobile distribution and then splitting the result among the three platforms of iOS and the two Androids.
Adding to that the "native" app and content revenues for each platform would yield the Ecosystem total value. Applying a growth rate would offer some visibility into the future.
The following images are screen captures of the Perspective presentation.
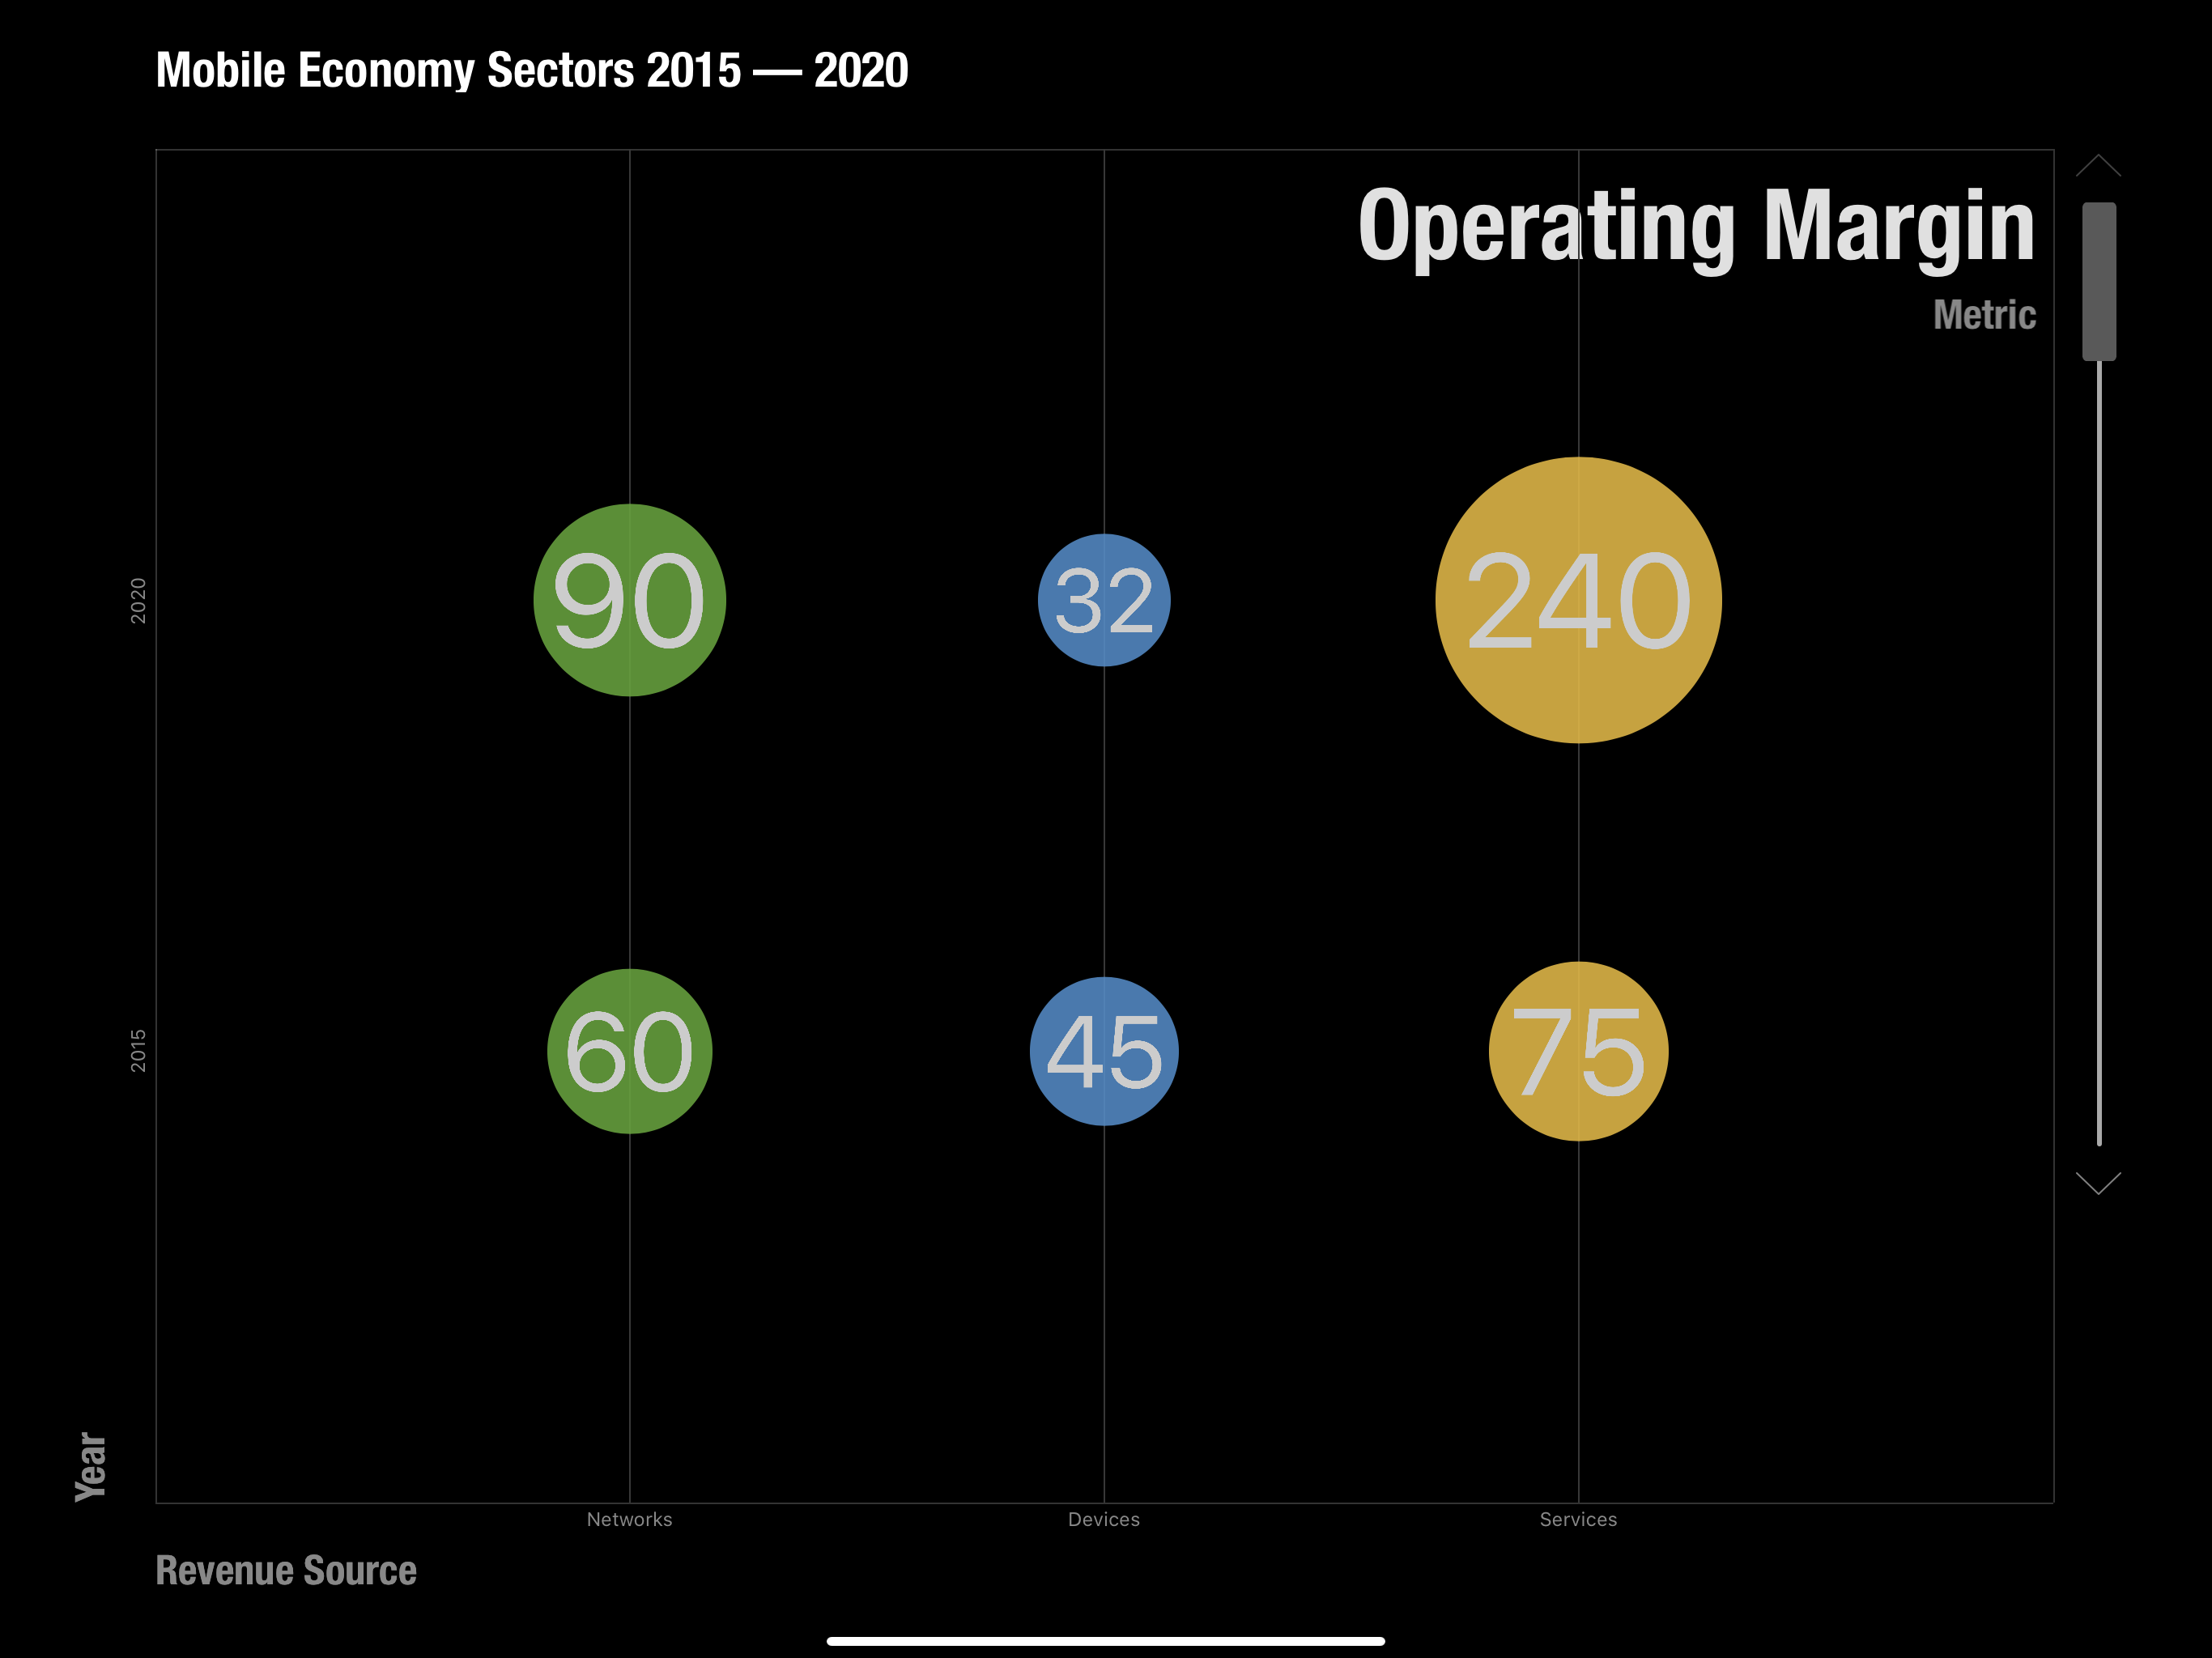
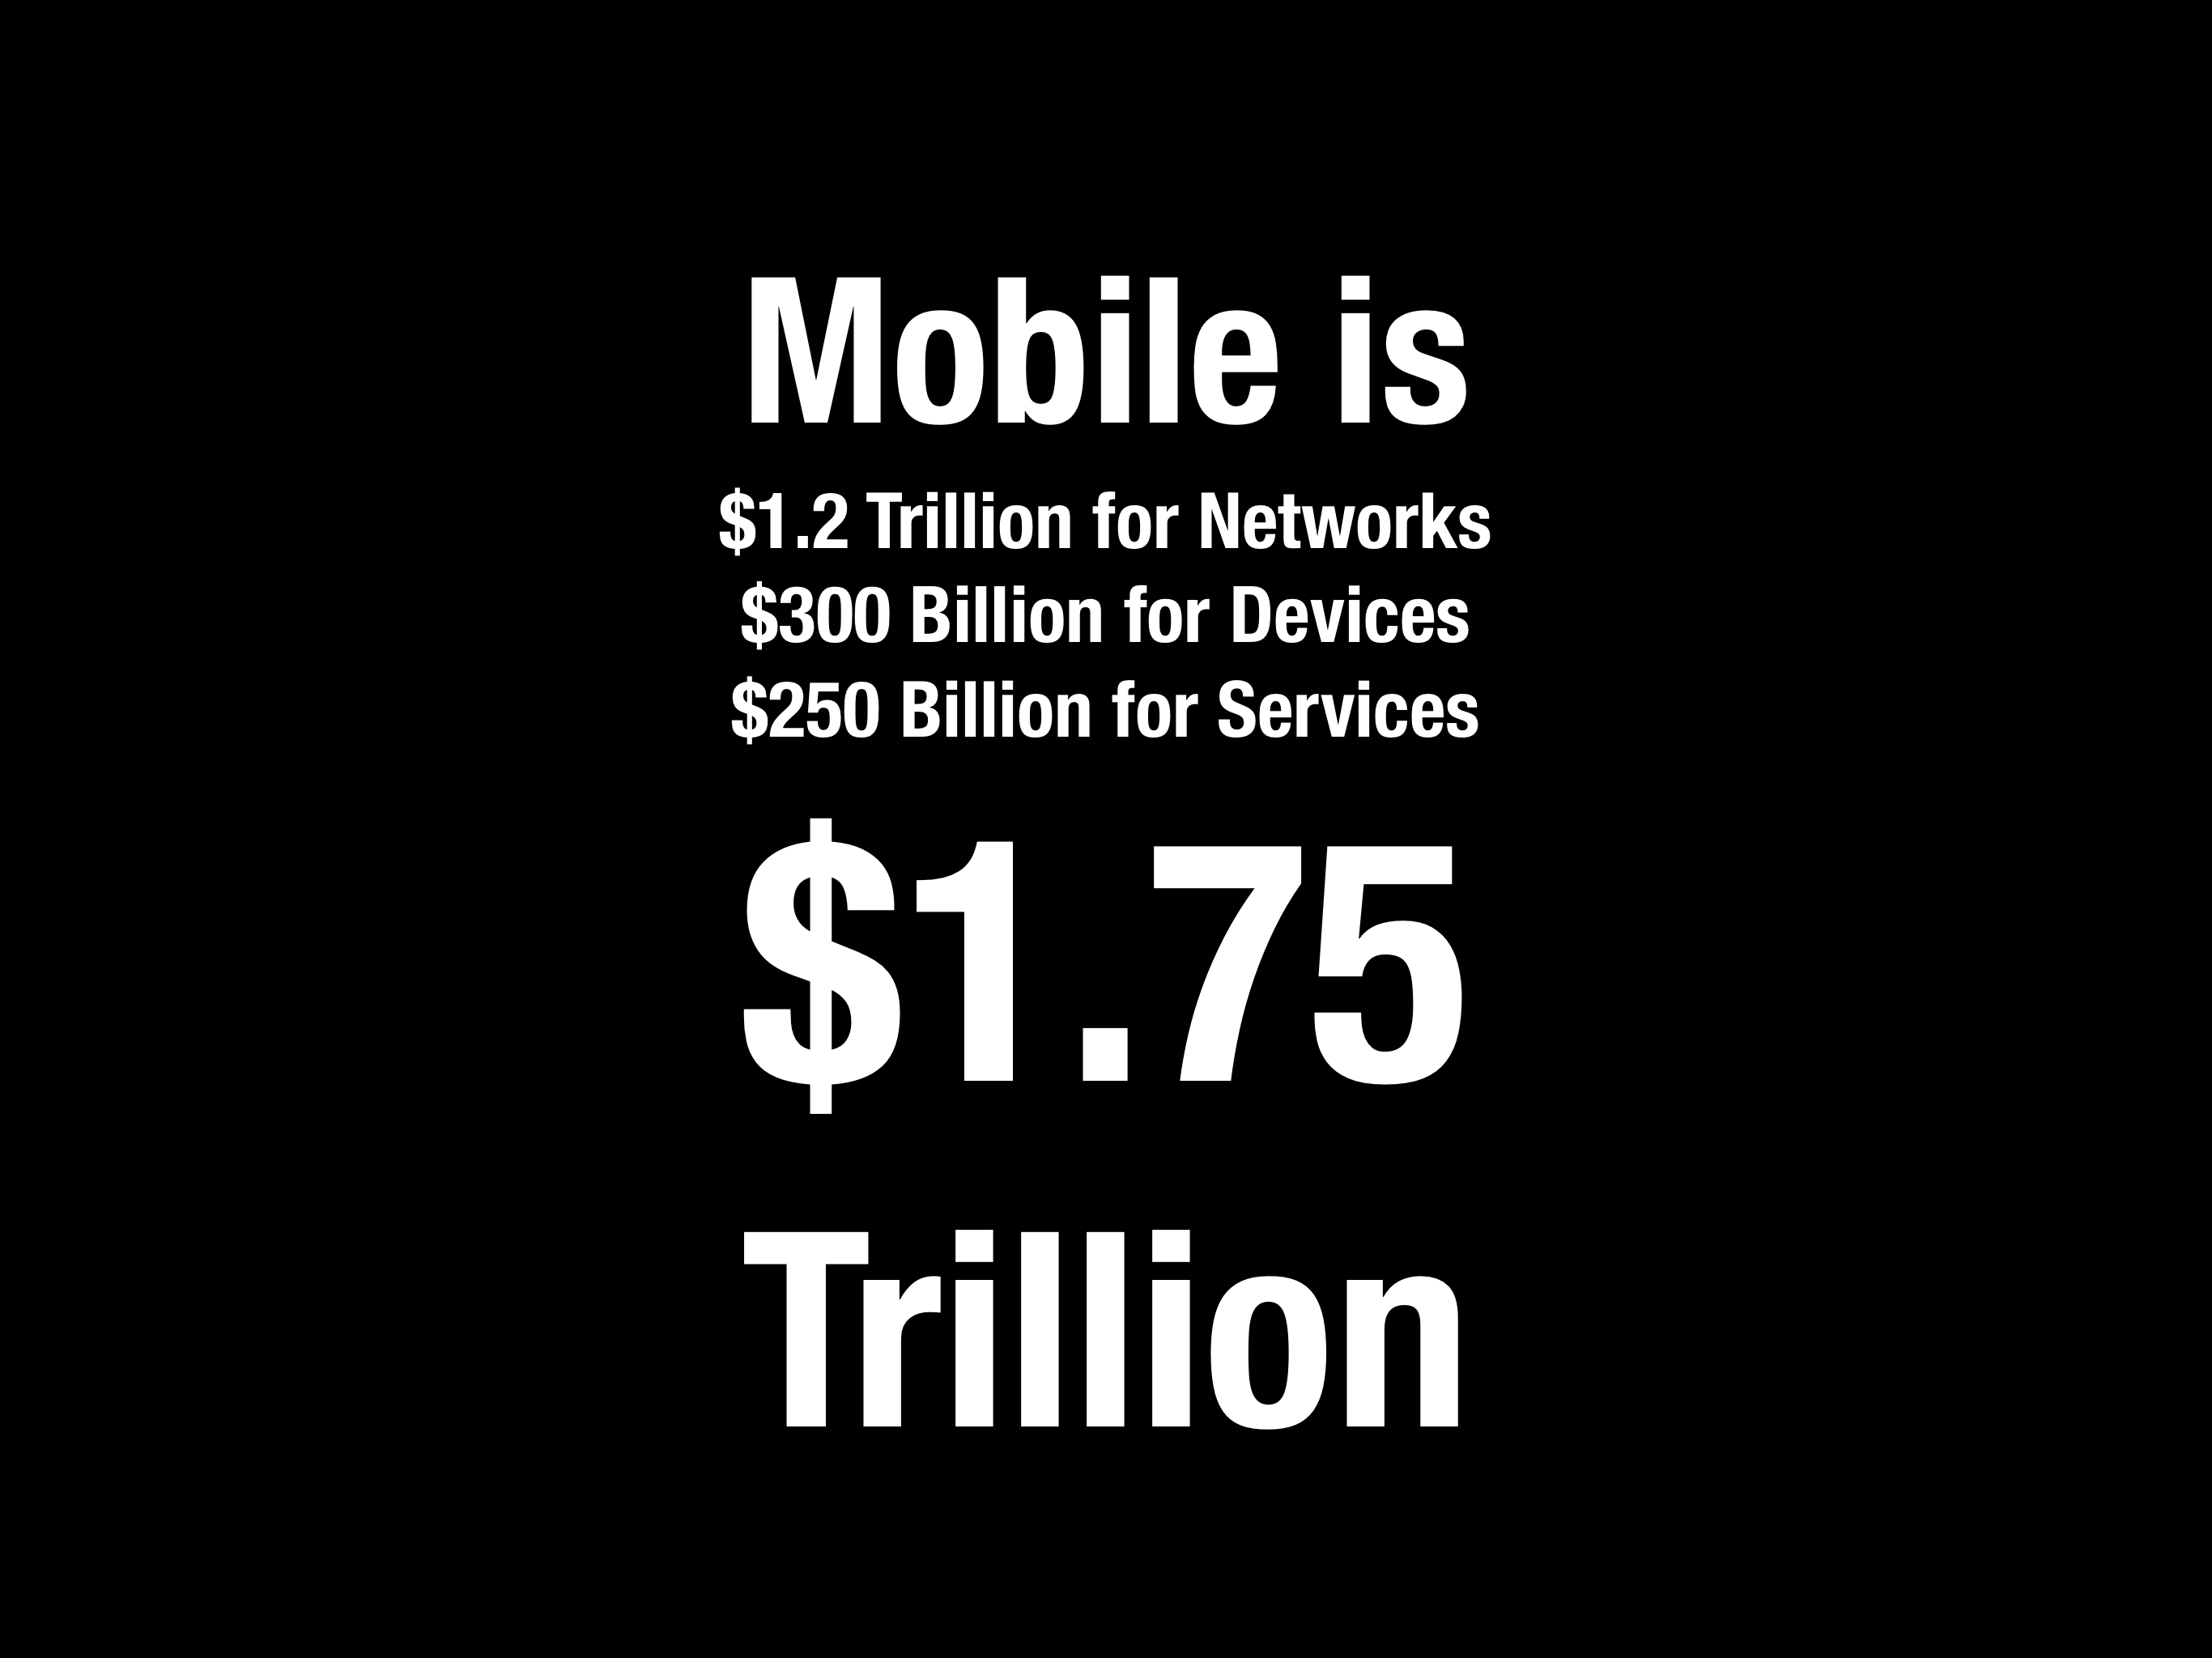
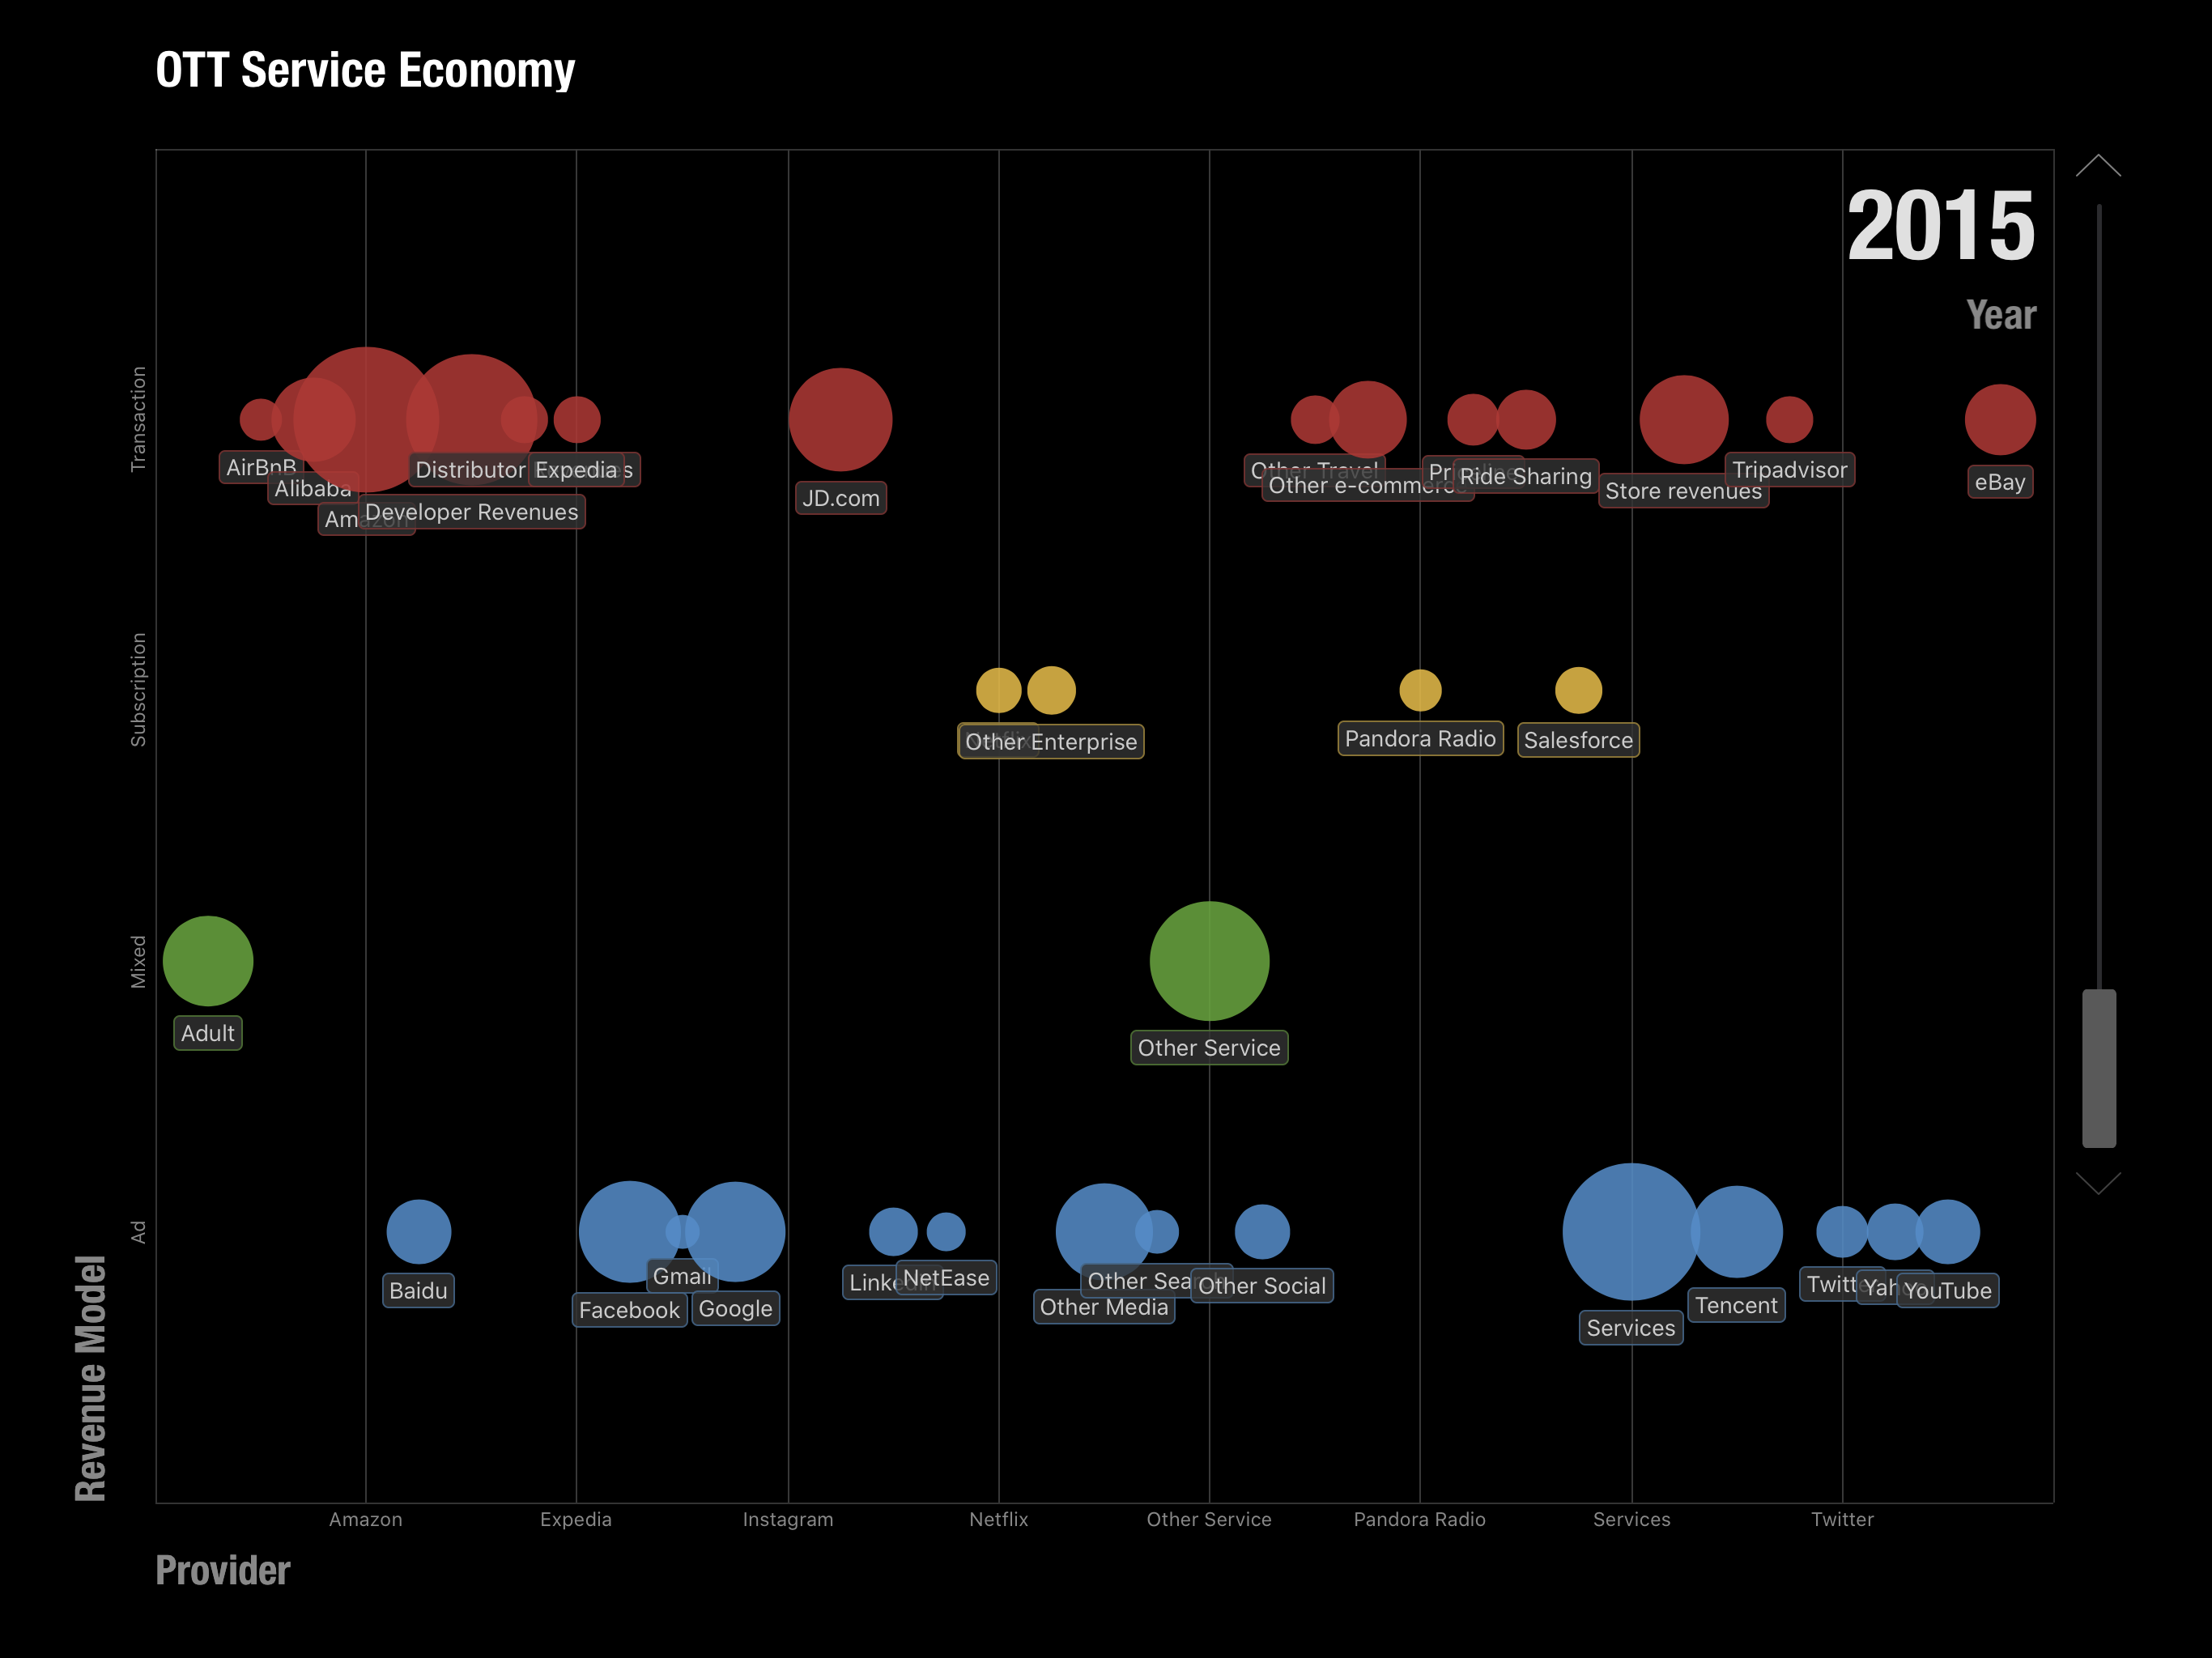
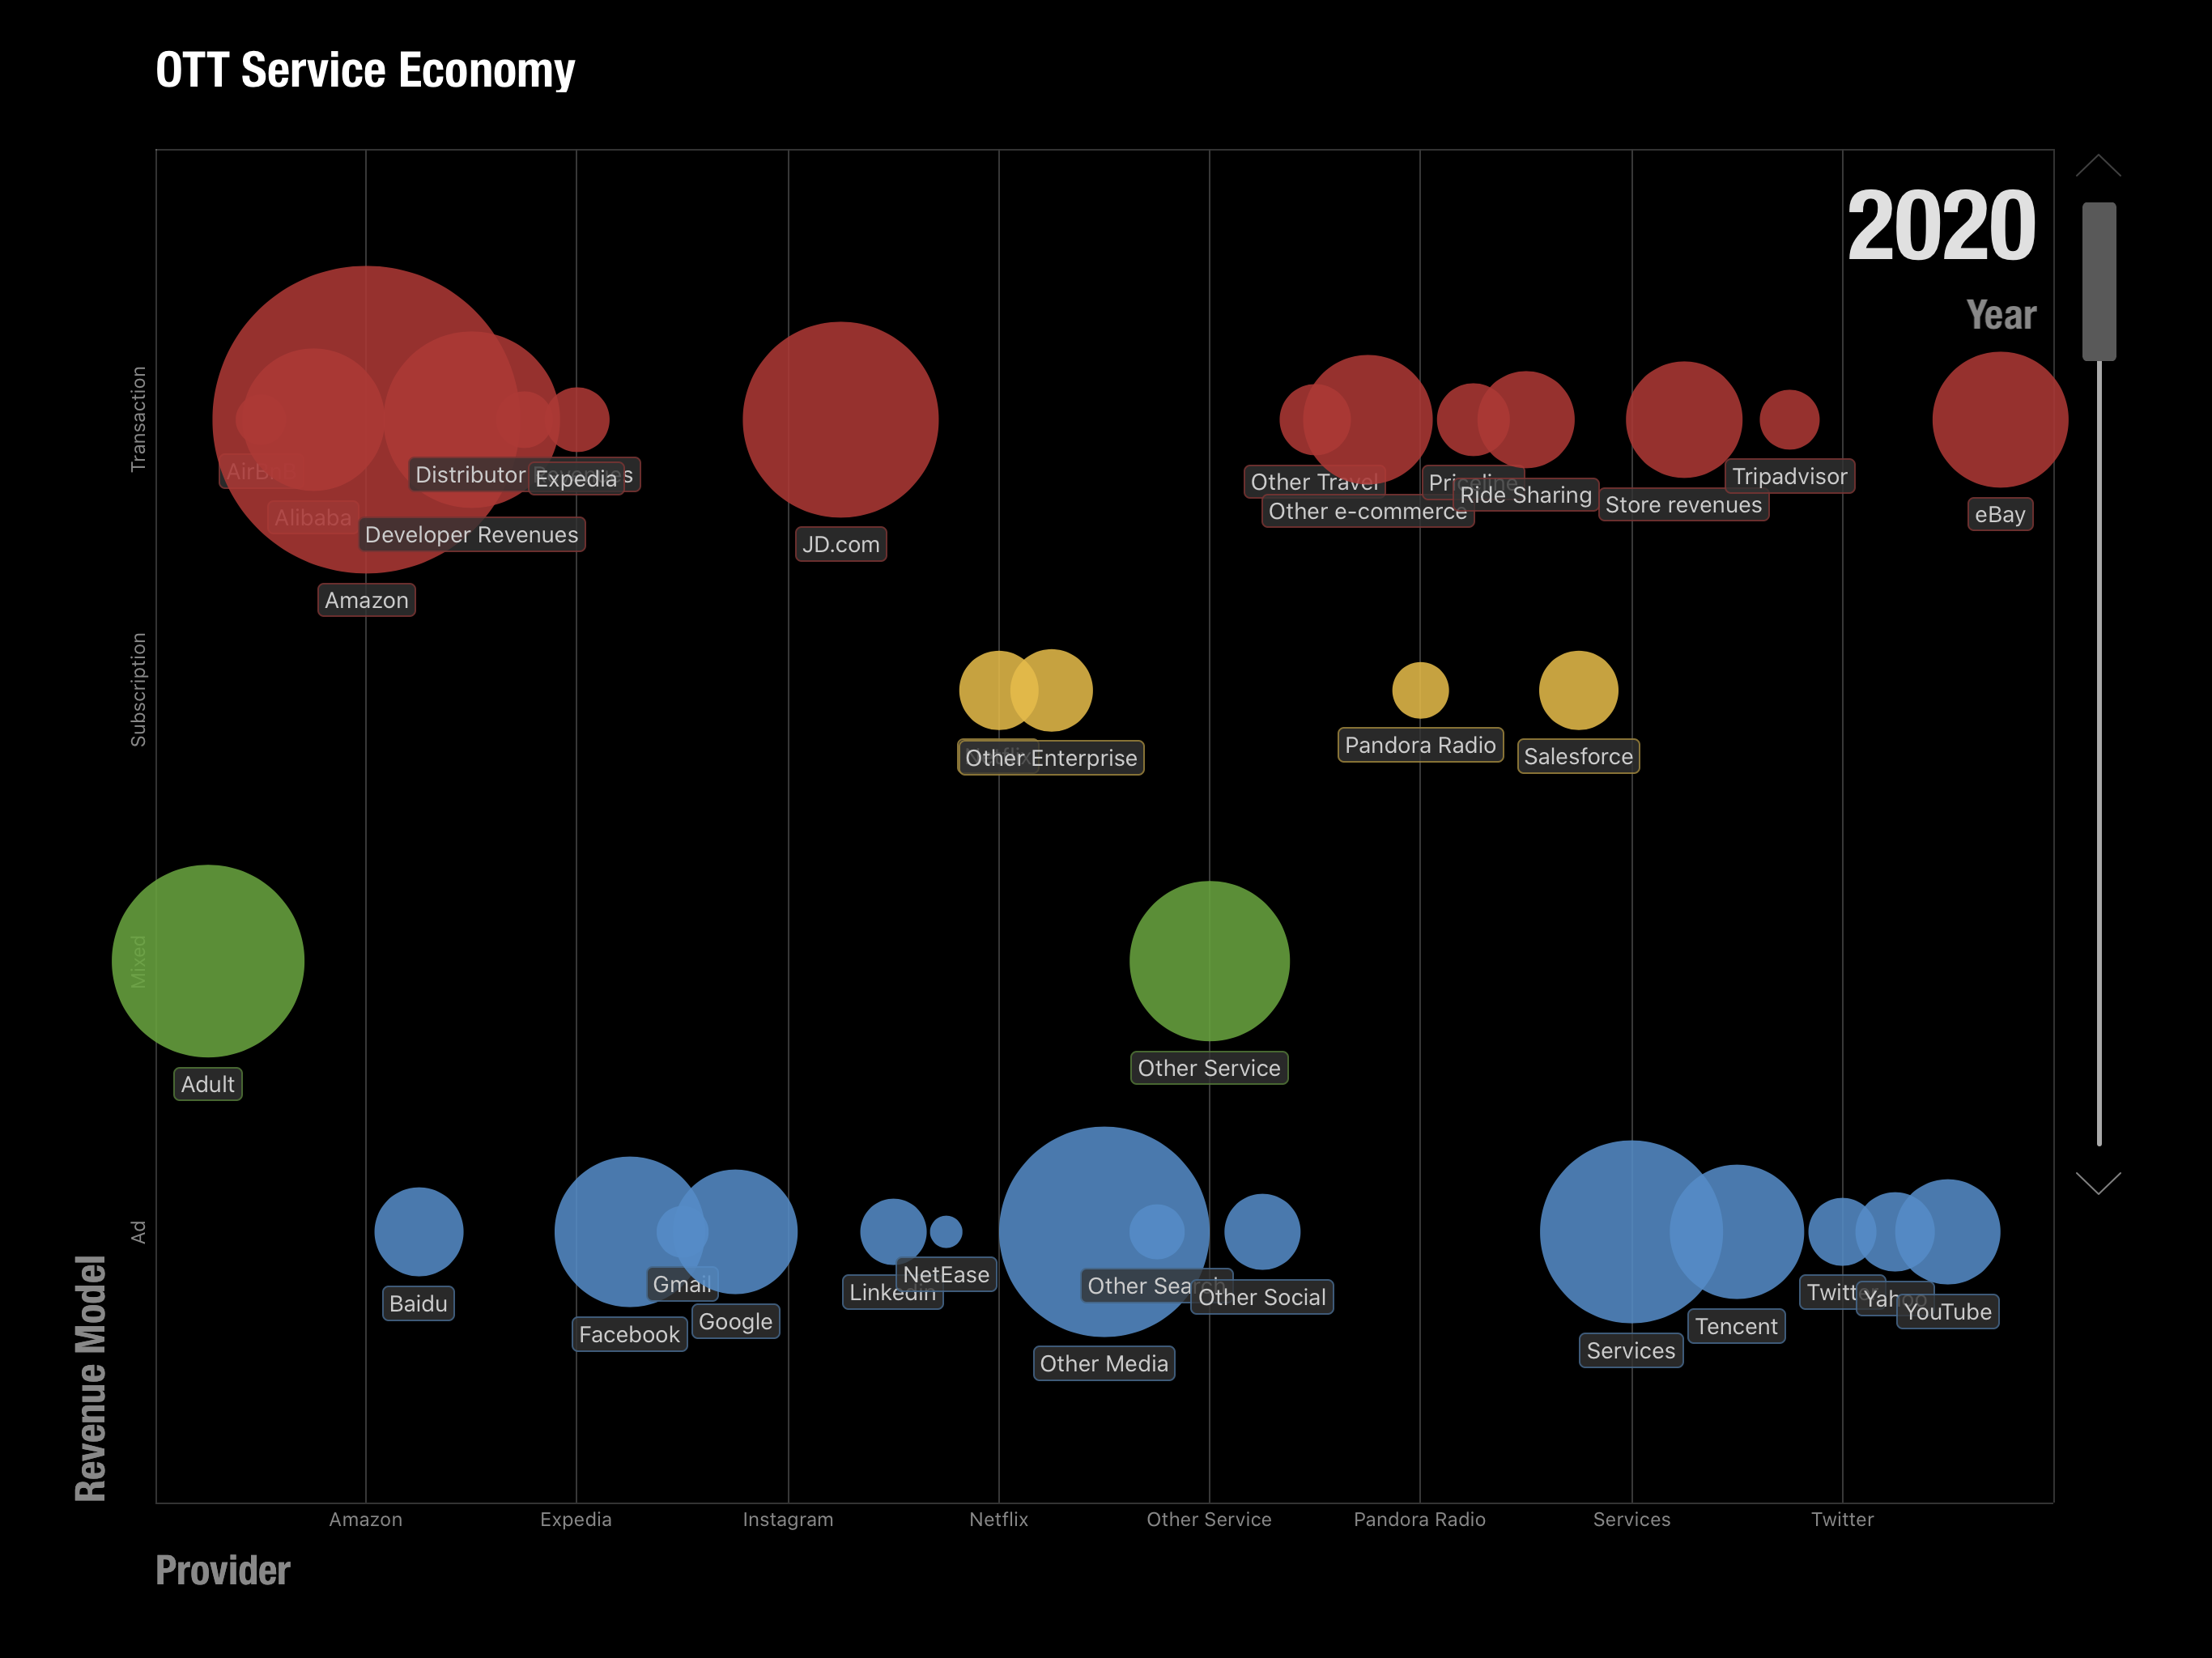
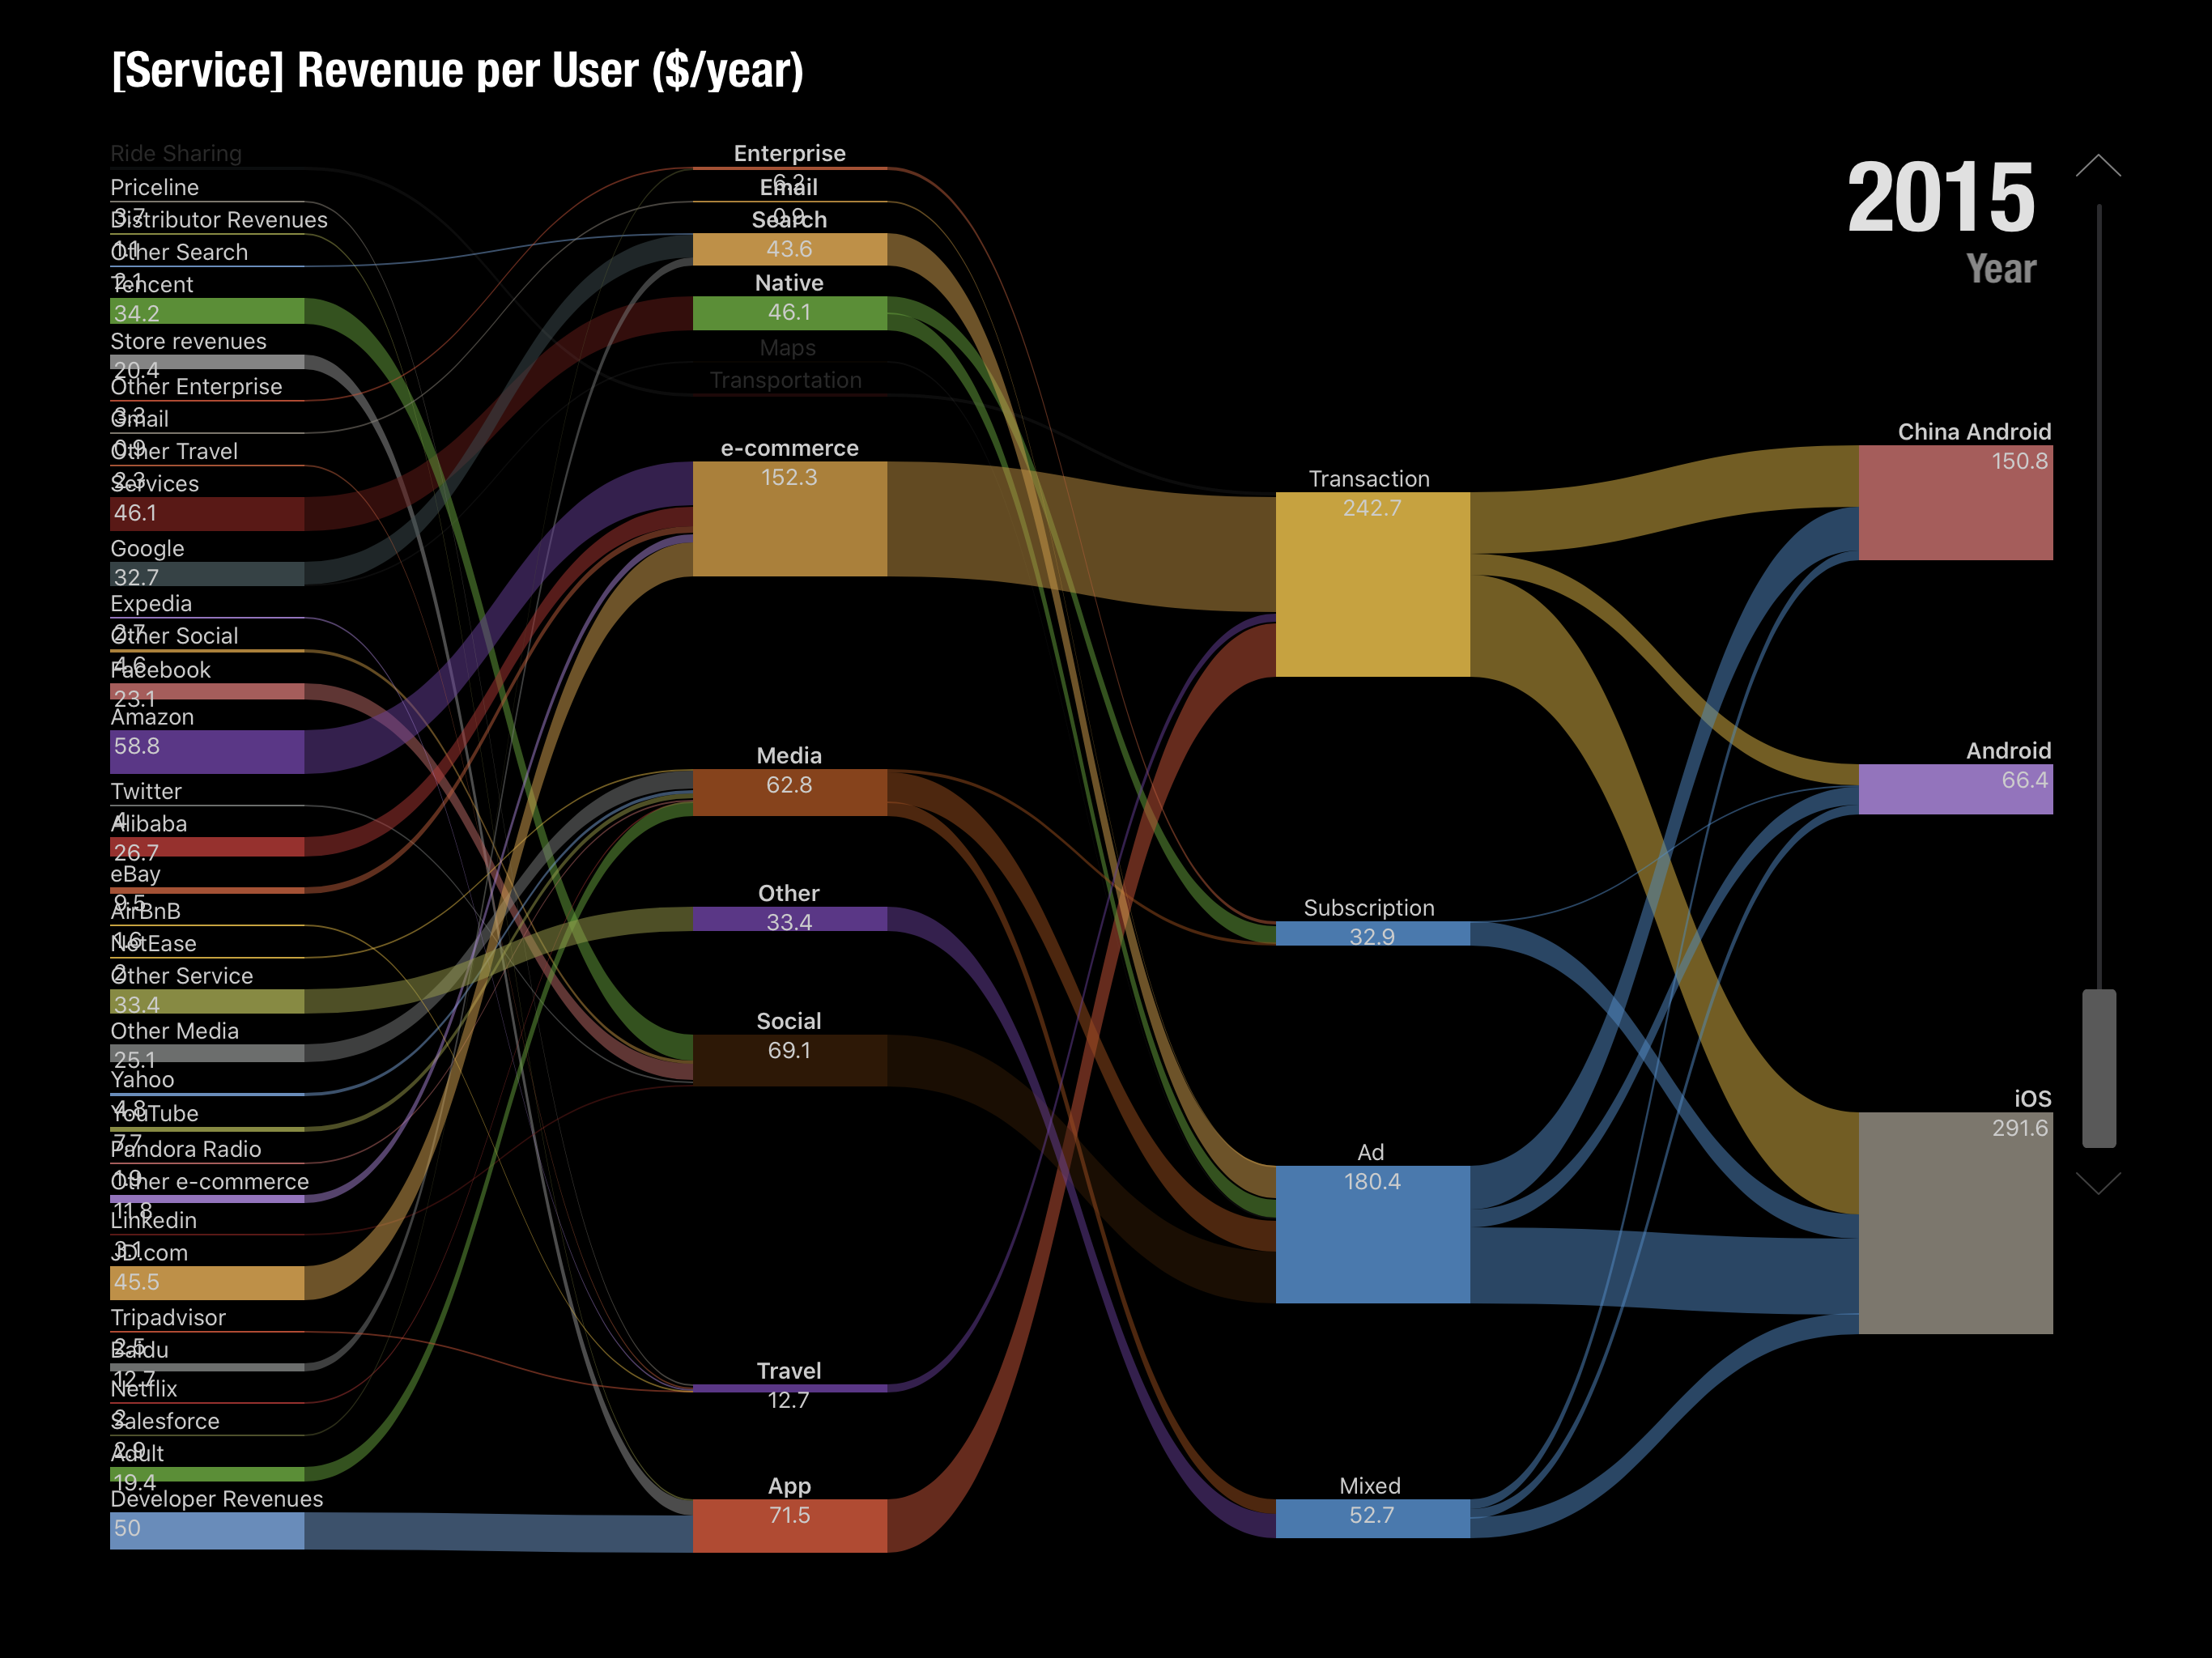
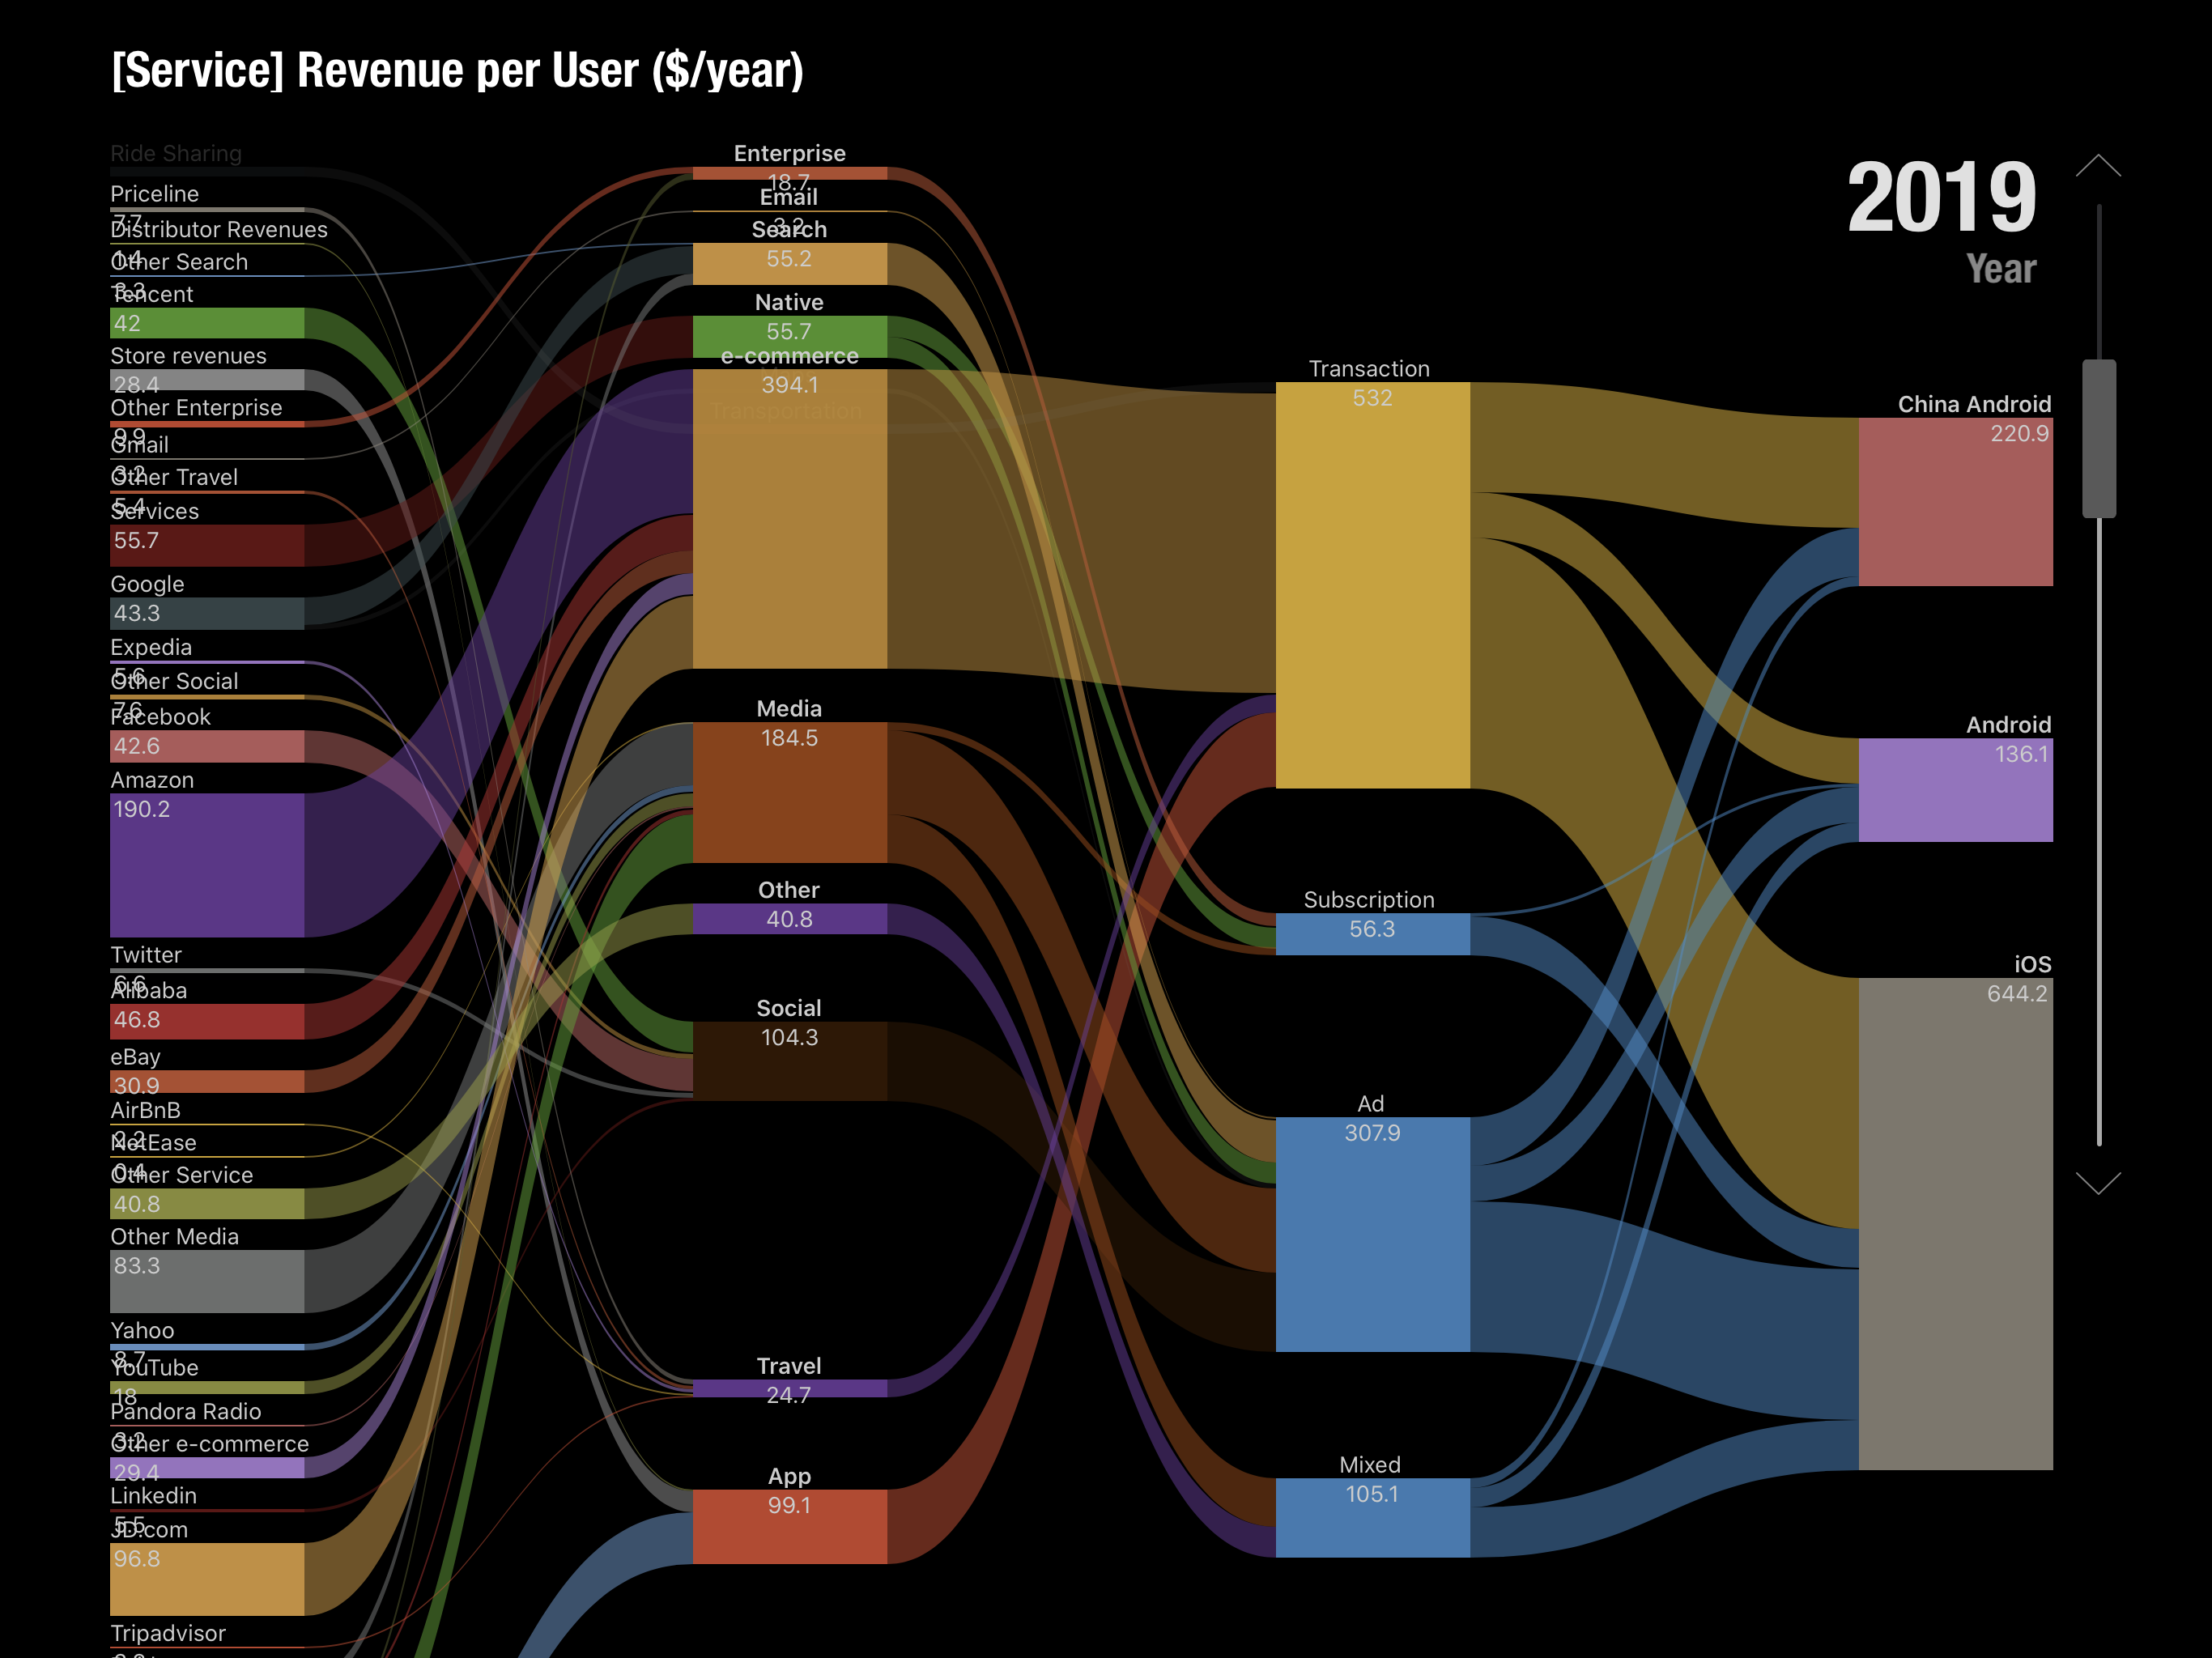
Revenues across Networks, Devices and Services 2015 to 2020 (estimated March 2016)Operating Income across Networks, Devices and Services 2015 to 2020 (estimated March 2016)Ecosystem composition (Third Party App, Native Apps, Other) 2015 to 2020, Android vs. iOS.Estimated mobile ecosystems total value by 2020 estimated in 2016.Over the top (OTT) service components by revenue model in 2015 estimated in 2016.Over the top (OTT) service components by revenue model in 2020 estimated in 2016.Allocation of OTT Revenues Across Service Types and Business Models and Platforms 2015 (estimated in 2016)Allocation of OTT Revenues Across Service Types and Business Models and Platforms 2019 (estimated in 2016)Composition of service revenues per user ($/year) for mobile platforms in 2015 (estimated in 2016)Composition of service revenues per user ($/year) for mobile platforms in 2020 (estimated in 2016)
Of course there are several potential errors in this methodology. The categories were not all inclusive. I used Social, Media, Search, Maps, email, Messaging, e-commerce, Travel, Enterprise, Storage, Transportation, Travel and Other as the top level categories. There are many products and services who would end up in Other. Moreover, these categories were anchored by the top companies in each category and the share of the top names was not always clear. Finally, the growth rates for these categories were based on historic trends which could change either way.
The online services ecosystem (all platforms) was thus estimated to be $450 billion in 2015, growing to $820 billion by 2019 and $914 billion by 2020.
The mobile split would vary by segment but would be roughly 75% by 2020 (25% would not be mobile). The final assumption was based on the split among the existing mobile platforms. I put a multiple of roughly 50% for iOS and 35% for Google Android and the rest for China Android.
Multiplying all these assumptions gave me a figure of $275 billion for the iOS portion of the global online services market in 2019. (Incidentally, Android was estimated at $207 billion and China Android $110 billion.) Note that this does not mean this was an expectation of Apple's revenues or that this was the opportunity of Apple obtaining any percentage of this revenue. It was simply the value of what would transact through iOS, a platform which would act as a commerce enabler. This was to be the size of the iOS "ecosystem" or co-dependency between Apple and the companies delivering through its platform.
Ecosystems are a powerful idea. As I recall, this term applied to mobile was coined by a Palm executive in the late 1990s when he referred to the value of all the apps built for the Palm Pilot. The biological term refers to the system of multiple species living in close proximity. It implies an equilibrium as each species benefits from the others and the environment. There might be predators and prey but biodiversity is the successful construct.
The idea of an ecosystem for a platform was also the core strength of Microsoft's Windows which created the network effects around it and it has been the goal of every platform since. The nature of computing and networking implies that these systems grow faster and are more resilient than the more traditional value networks of other businesses or industries.
Now this ecosystem was something we wished to highlight in 2016 as a core strength for Apple. It was not considered as such at the time and I thought putting a figure of $275 billion in 4 years' time was a way to highlight the potential. Time since has proven us right.
This week Apple highlighted the result of another research team who attempted to measure the iOS ecosystem. Their conclusion was that billings and sales facilitated by the Apple App Store Ecosystem in 2019 was $519 billion. More than twice the amount I had so optimistically forecast four years earlier.
The authors also emphasize that this is a conservative estimate and should serve as a baseline.
I feel partly vindicated about that figure as my attempt at a figure was intended to highlight the scope of the ecosystem and it is better to have underestimated it than overestimated it. The authors' methodology was also similar in being bottom-up summation of components by categories of services but the information available today is enhanced by the new data Apple made available on subs and Services revenues and install base.
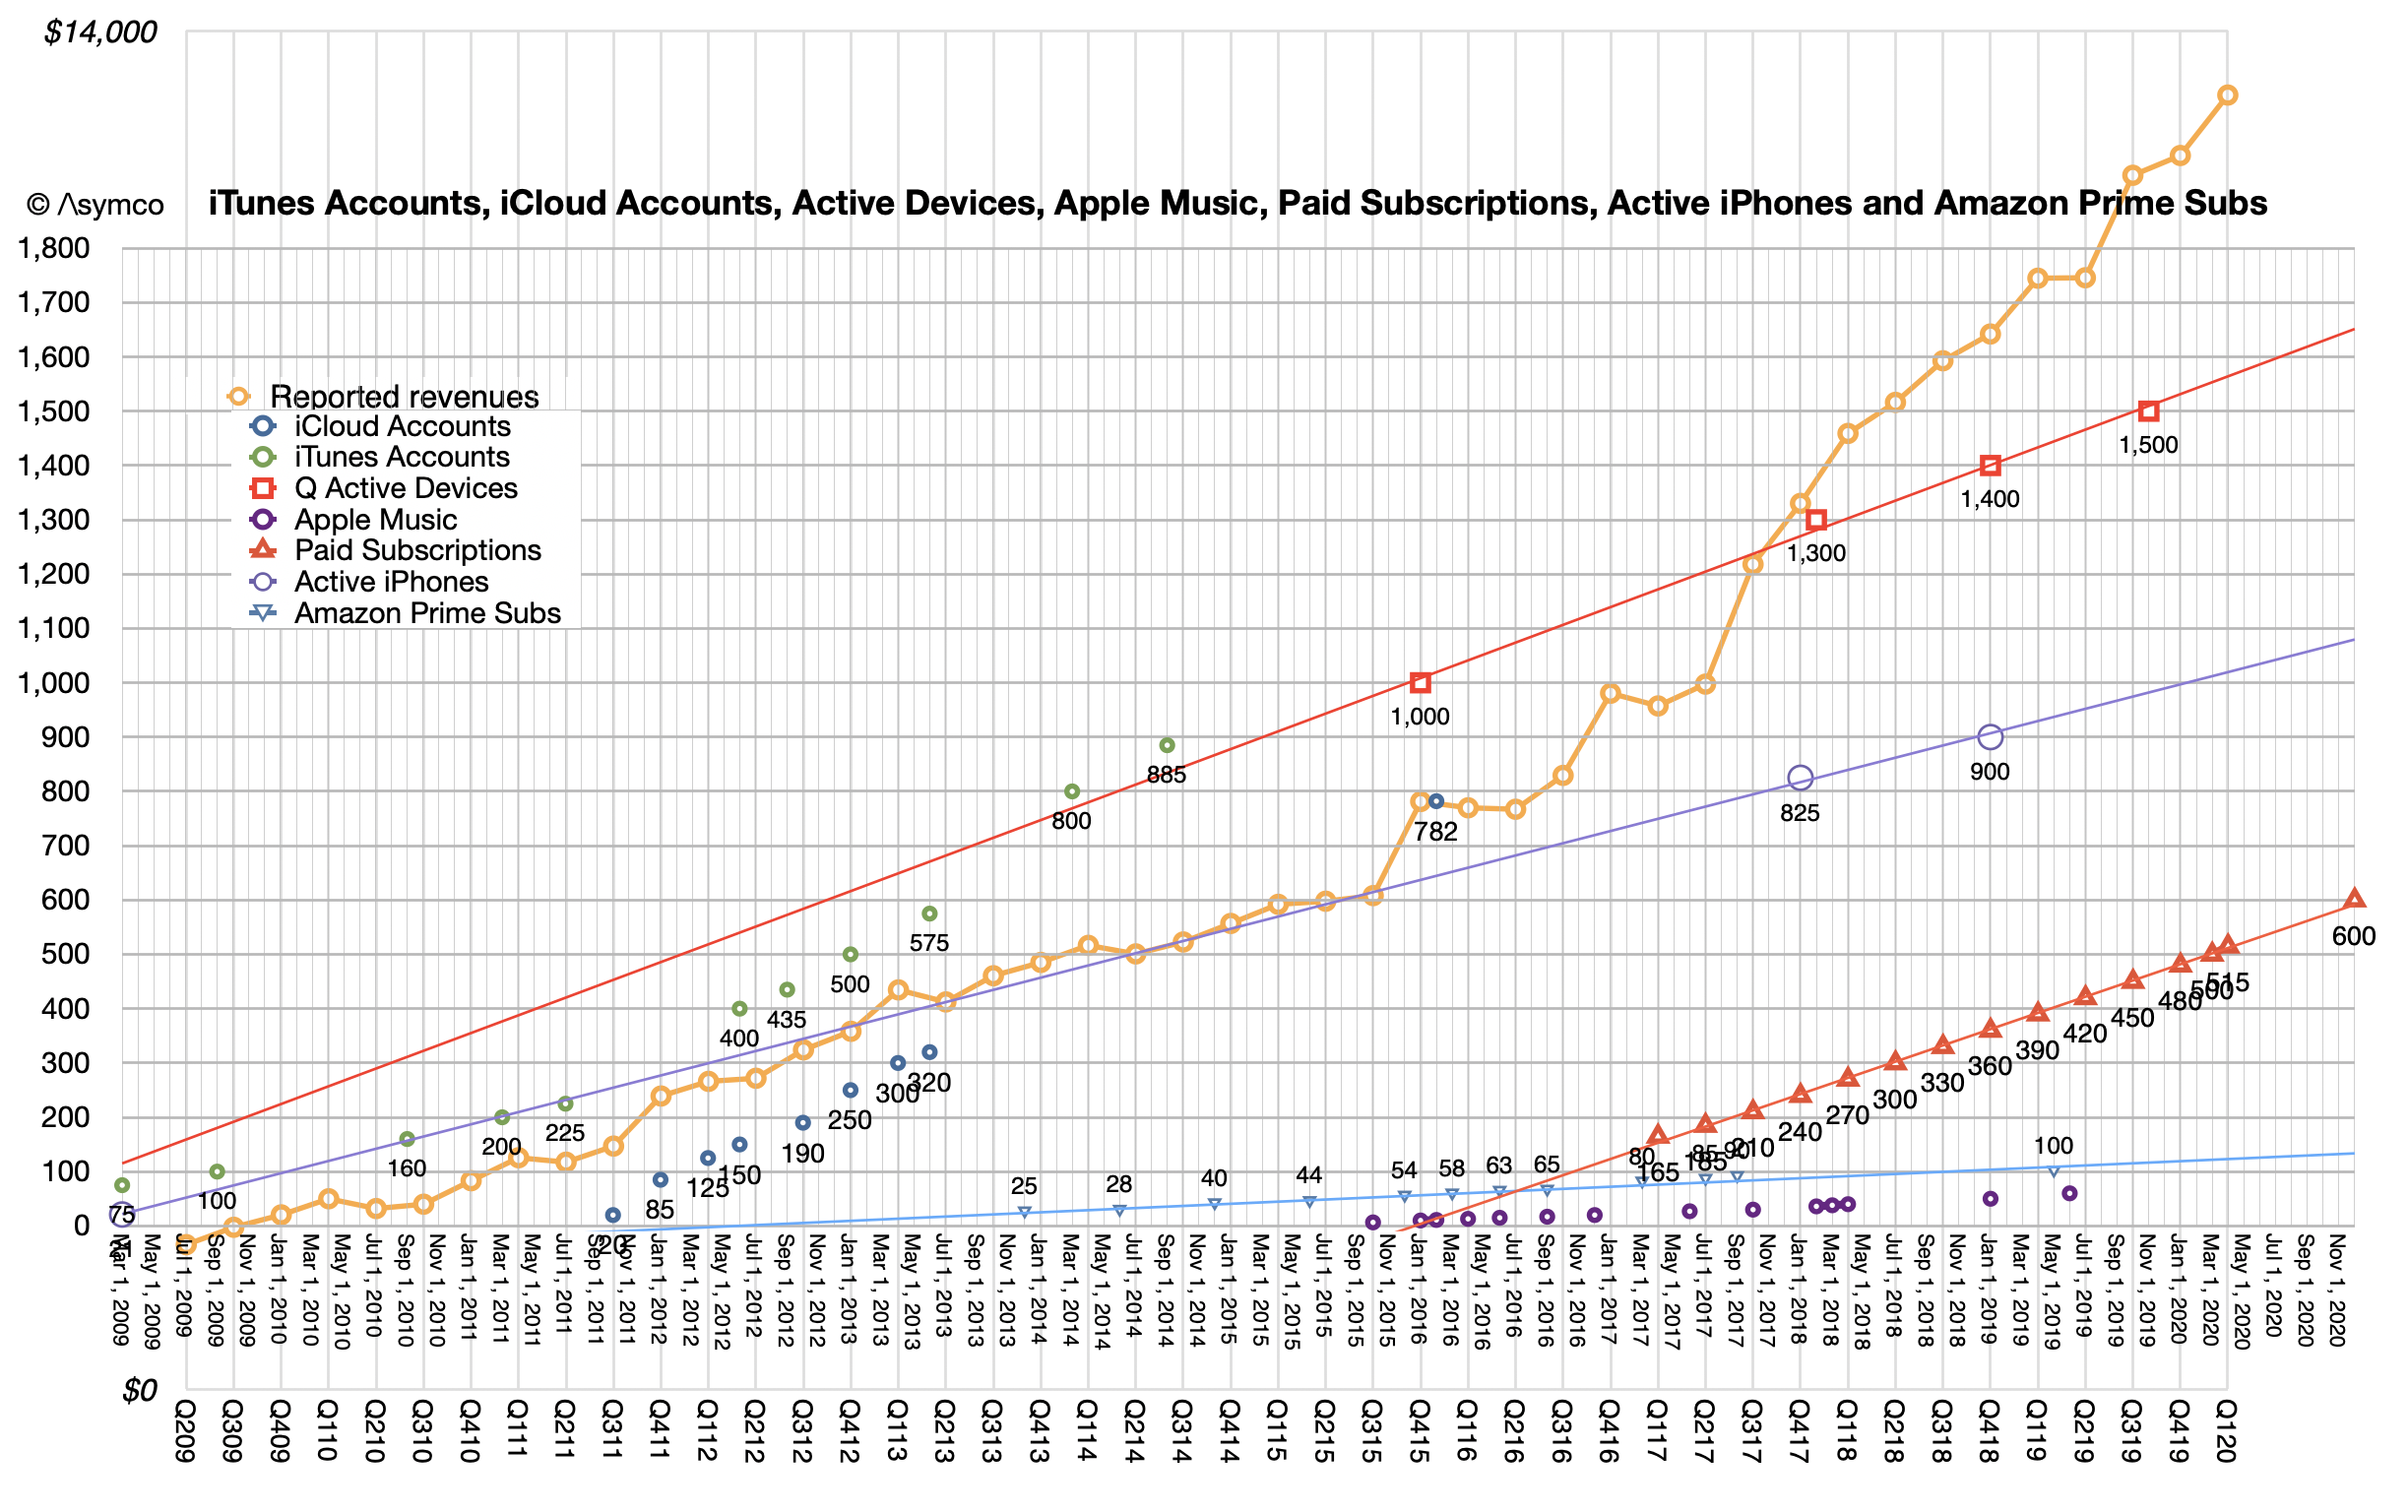
Note that in the graph below the salient data points of subscribers (red triangles) had not begun until 2017 causing the acceleration in Services revenue (yellow line). Note also the additional square points representing install base.
This figure of more than half a trillion dollars of value transacted through iOS should give some pause. It it a very powerful figure that can be combined with the other data from Apple:
More than 1.5 billion active devices
More than 1 billion iPhone users
More than 500 million paid subscriptions
More than $1/day iPhone hardware revenues for Apple
The half-trillion per year on services implies between $335 and $520 in spending per user (likely closer to $500) per year. This would be in addition to the approximately $365/yr in hardware spending per user (which Apple books as hardware revenue). In the case of the iPhone there is yet more: the cellular network service which may average $350 per year.
To simplify, the "average Apple user" spends $1/day for each device, $1/day for the network and $1.4/day on items bought through the device. Adding a margin of error, that's between $3.4 and $4 per day each user spends. Oh, and there are about a billion such users.
The total spending enabled by iOS thus is close to $1.4 trillion/yr.
That's a significant amount. It's bigger than many industries. There are only about 12 countries with higher GDP (Spain is about the same.)
How does Apple benefit from this?
Apple captures 30% of billings through its App Store. My estimate for these billings were $67.9 billion in 2019 which means App Store billings were 13% of the 2019 ecosystem. Apple's 30% cut of Billings amounts to 3.8% for the whole ecosystem. It's hardly an oppressive number.
If Apple only captures 3.8% what use is this to Apple?
The last decade has seen Apple emerge as the world's largest company in terms of market capitalization, and not doing so with a wild multiple of revenue or earnings, quite the opposite. It did this by creating the world's greatest customer base. Not in absolute scale. Android and Facebook have larger customer bases with multiple billions of users.
No, Apple's one billion users are simply the best billion users. They are the most likely to stick with Apple and they are the most likely to buy more from Apple and—this is crucial—they are the most likely to buy everything else. Those other companies whose sales come from Apple customers have been taking note. They know that Apple customers are desirable customers and choose to target Apple customers, as much as they can. Associating your company with Apple makes a lot of economic sense.
I will admit however that my argument that Apple created a customer base is contrived. The fact is that Apple creates productsand services and those products are the root of its power to attract the right customers. By choosing to create the best products it coincidentally chooses to create the best customers. The power flows from product not from pricing or positioning. This is a lesson lost for many.
Developers and regulators might feel Apple's massive power is perhaps too much. In the last decade, the narration around Apple has shifted from Apple being perpetually "doomed" to it being too dominant. Although I'm sure there are some who will try to conflate the two declaring that dominance will inevitably result in doom, most critics of Apple went from laughing (at it) to crying (about its practices).
The argument that Apple should change its practices developed to price as it does, distribute as it does or design as it does because it was too successful or is "unfair" is getting the causality wrong. Dominance won't be altered by a few points of percentage change (on a tiny fraction of ecosystem transactions). Fairness won't be altered when there are thousands of business models and many remain to be invented. Case in point is pornography which is not permitted on the App Store but which exists in abundance thorough other access methods.
The argument is that Apple should be more generous. That it should decrease the "cut" it takes for distribution. Or that it should not enforce revenue split for the customers it exposes to others.
But this is problematic on many levels. The playing field for all developers needs to be level. The customer must be respected and access to that customer should be constrained or certainly metered. Abuses must be policed and that requires leverage.
These practices are inter-dependent and the effect multiplicative, not additive. Apple has a monopoly on iOS and on MacOS and WatchOS and iPadOS. It does this to control the experience, security and safety of the user. It's that control which created the customer in the first place. It should naturally control access to its hard-earned customers.
It does not monetize the distribution of content or apps unless the developer/creator directly charges for the product or service. Distribution is not cost free and to offer it for free is a subsidy which would create additional market and innovation disincentives. The loyalty of Apple users is evidenced by the 600 million paid subscriptions (end of year estimate) that are booked through the App Store. Developers benefit directly as a result.
One could argue that the abundance of services which don't distribute through the App Store is evidence that the system works as intended. Apple's App store front is its property and it reflects its core values.
Being on the shelf in the App Store means you operate on the terms of the shelf owner. If the rules are not agreeable then the half trillion dollars of ecosystem activity is testament to the availability of alternatives.
In June of this year Apple reported that it had paid a total of $100 billion to developers. That is the 18th such figure given in the 10 year history of App Store, making the progress of payments and hence revenue and spending easily trackable.
The other regularly reported figure is the business segment revenue where App sales are currently allocated. Now called "Services" this omnibus segment includes many other sources of revenues such as:
Digital Content (Books, Music downloads, Video downloads--including TV shows and movies and movie rentals.)
AppleCare, Apple's extended warranty service.
Apple Pay, transaction fees
Apple Pro Apps, including Final Cut, Logic Pro, Motion, Aperture
Licensing including "Made for iPhone/iPad"
One-time settlements of various lawsuits.
Other Services revenues which include
Apple iCloud-related services
Music Match
Music subscriptions
Other third party subscriptions (commissions)
Third party licenses
This combined Services segment is significant with $35 billion revenues in the last 12 months. This is quite a jump from 2016 when Services had crossed $25 billion. At the end of 2016 Apple said it expected Services revenue to double by 2020. With a growth rate since then of 25% the company is on track to reach its target one year early. ((To calibrate this consider that Facebook revenues for the last 12 months were $48 billion and it now has a market capitalization of $468 billion or 41% that of Apple whereas Services consists of about 14% of Apple's total revenues.))
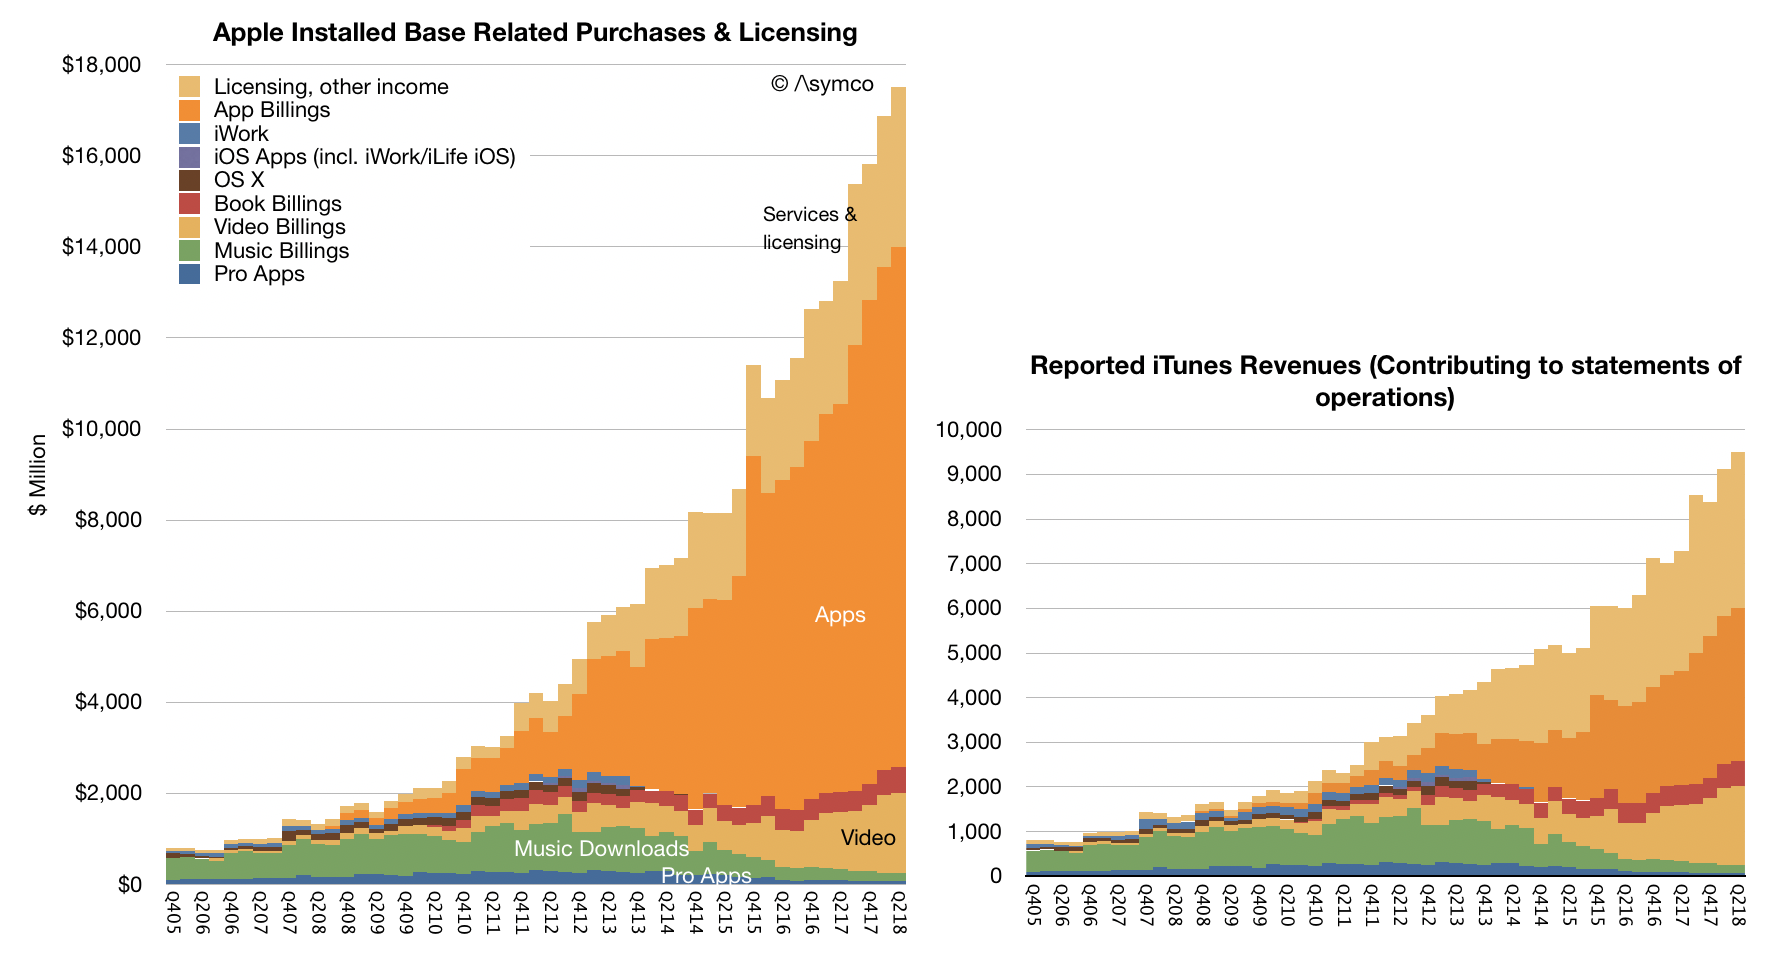
Consumer spending on Apple services includes more than what it books as revenue since only the (typically) 30% of App Revenues is considered Apple's revenue. Including the payments to developers, Services generated over $65.5 billion/yr in billings. This will reach $100 billion/yr in 2 years. The difference between reported revenues and consumer spending is shown in the following graphs.
I described the visibility into App Store revenues (which is the orange area in the graphs above) but the other sub-segments of Services are much more difficult to ascertain. Of special interest is Other Services which includes very high margin services. As part of that there is a peculiar source of revenues: Google.
It's known that Google pays Apple for the default placement of Google search within Safari on iOS and Mac OS. That payment is registered by Google as a "Traffic Acquisition Cost" or TAC. TAC is essentially payment for distribution where what is granted by the distributor is access to queries (traffic.) This way Apple acts as distributor for Google. So, for that matter, does Firefox which also receives TAC payments.
What is peculiar is that the amount of TAC paid by Google to Apple is becoming staggering.
A few years ago Google was paying over 20% of its revenues as TAC. Recently that ratio rose to 23%. Bernstein analyst Toni Sacconaghi estimated that Google paid Apple $1 billion in 2014 as TAC and that payments to Apple were about $3 billion in 2017. Now Goldman Sachs analyst Rod Hall estimates Google could pay Apple $9 billion in 2018, and $12 billion in 2019.
This is starting to look interesting but is it believable?
My own estimate of Apple's Other Services (which includes TAC revenues) is a run rate of $15 billion for calendar 2018. This makes $9 billion (60%) from Google quite challenging but not impossible. The remaining $6 billion needs to account for Apple's own cloud and subscription service revenues.
Does this make sense given Google's spending? TAC payments to distribution partners in Q2 were $3 billion. The $9 billion/yr assumption implies a $2.25B/quarter payment to Apple. That would be 75% of Google's distribution costs. That also sounds reasonable given the high utilization of iOS relative to any other platform.
An increase to $12 billion for next year is also quite a claim but it certainly is possible. I don't have a basis for making this estimate but the assumption of growth leads me to conclude that the payments are tied to actual traffic generated.
In other words the two companies have an agreement that Apple is paid in proportion to the actual query volume generated. This would extend the relationship from one of granting access for a number of users or devices to revenue sharing based on usage or consumption.
Effectively Apple would have "equity" in Google search sharing in the growth as well as decline in search volume.
The idea that Apple receives $1B/month of pure profit from Google may come as a shock. It would amount to 20% of Apple's net income and be an even bigger transfer of value out of Google. The shock comes from considering the previously antagonistic relationship between the companies.
The remarkable story here is how Apple has come to be such a good partner. Both Microsoft and Google now distribute a significant portion of their products through Apple. Apple is also a partner for enterprises such as Salesforce, IBM, and Cisco. In many ways Apple is the quintessential platform company: providing a collaborative environment for competitors as much as for agnostic third parties.
Every October, at the end of its fiscal year, Apple files its Form 10K or annual report. In this report the company includes a section titled "Capital Assets" which details expenditures for capital equipment. This is last year's entry:
The Company’s capital expenditures were $14.9 billion during 2017. The Company anticipates utilizing approximately $16.0 billion for capital expenditures during 2018, which includes product tooling and manufacturing process equipment; data centers; corporate facilities and infrastructure, including information systems hardware, software and enhancements; and retail store facilities.
Note that there are categories of spending detailed and that their order might indicate the degree of such spending, suggesting that product tooling and manufacturing equipment is likely to be the costliest category.
After this report, during subsequent quarters the company may update this forecast of spending. In the last (third fiscal) quarter the entry was as follows:
The Company’s capital expenditures were $11.1 billion during the first nine months of 2018 . The Company anticipates utilizing approximately $17.0 billion for capital expenditures during 2018, which includes product tooling and manufacturing process equipment; data centers; corporate facilities and infrastructure, including information systems hardware, software and enhancements; and retail store facilities.
Note that the forecast of $16.0 billion was updated to $17.0 billion and the first 9 months' expenditures were $11.1. Since there is only one quarter remaining ((and since at the time the quarterly report is filed, only about 2 months remain in the quarter)) it's reasonable to assume that the company's forecasts are more likely to be precise and that therefore the difference between total expected spending and already spent, i.e.f $5.9 billion remains to be spent.
The actual spending is not recorded quarterly but an approximate value is reported in the Cash Flow statement as "Payments for acquisition of property, plant and equipment". That can be tracked but it does not equal exactly the capital expenditure. For example, the quote above says expenditures were $11.1 billion through first 9 months but the total of all payments for acquisition of PP&E is $10.272 billion.
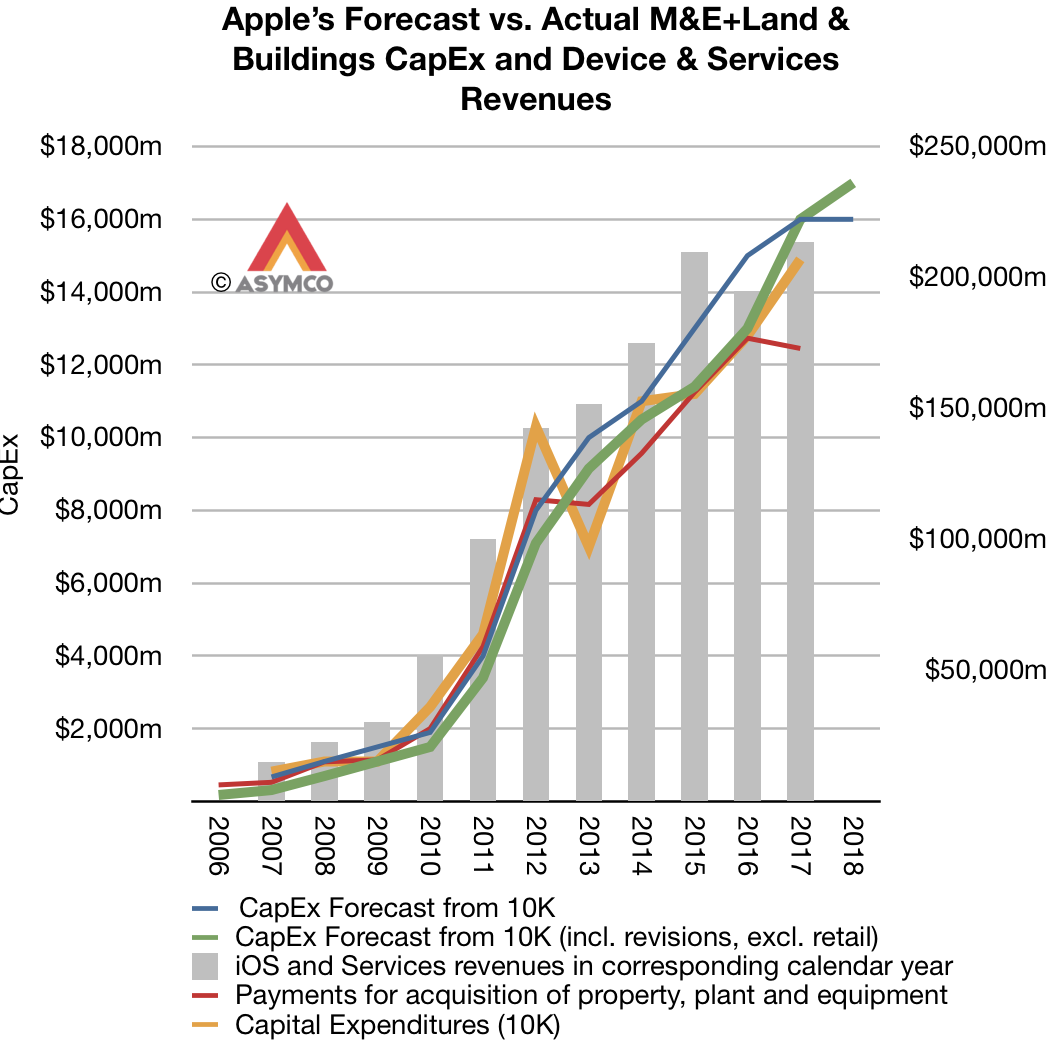
Minor ((To the extent that $1 billion can be considered minor)) differences, aside, this forecast and actual spending and payments data is significant because it is highly correlated to Apple's overall business. Assuming that the spending on manufacturing equipment and information systems hardware (i.e. data centers) is in support of the iOS device sales and services we can try to show how sales correspond to spending with the following graph:
Here sales are shown as a bar graph and the various spending forecasts and actual payments are shown as lines. Also note that the spending and sales are offset by one quarter. The fiscal year is used for spending and the calendar year for sales. The reason is that spending is presumed to lead sales by approximately one quarter.
There are some notable discrepancies, especially with the 2012/2013 period when spending was brought forward a quarter thus showing a surplus to forecast in 2012 and a deficit in 2013. But apart from that, there is a broad correlation between spending and sales.
This means that the CapEx forecast in October is a good indicator of sales in the following year.
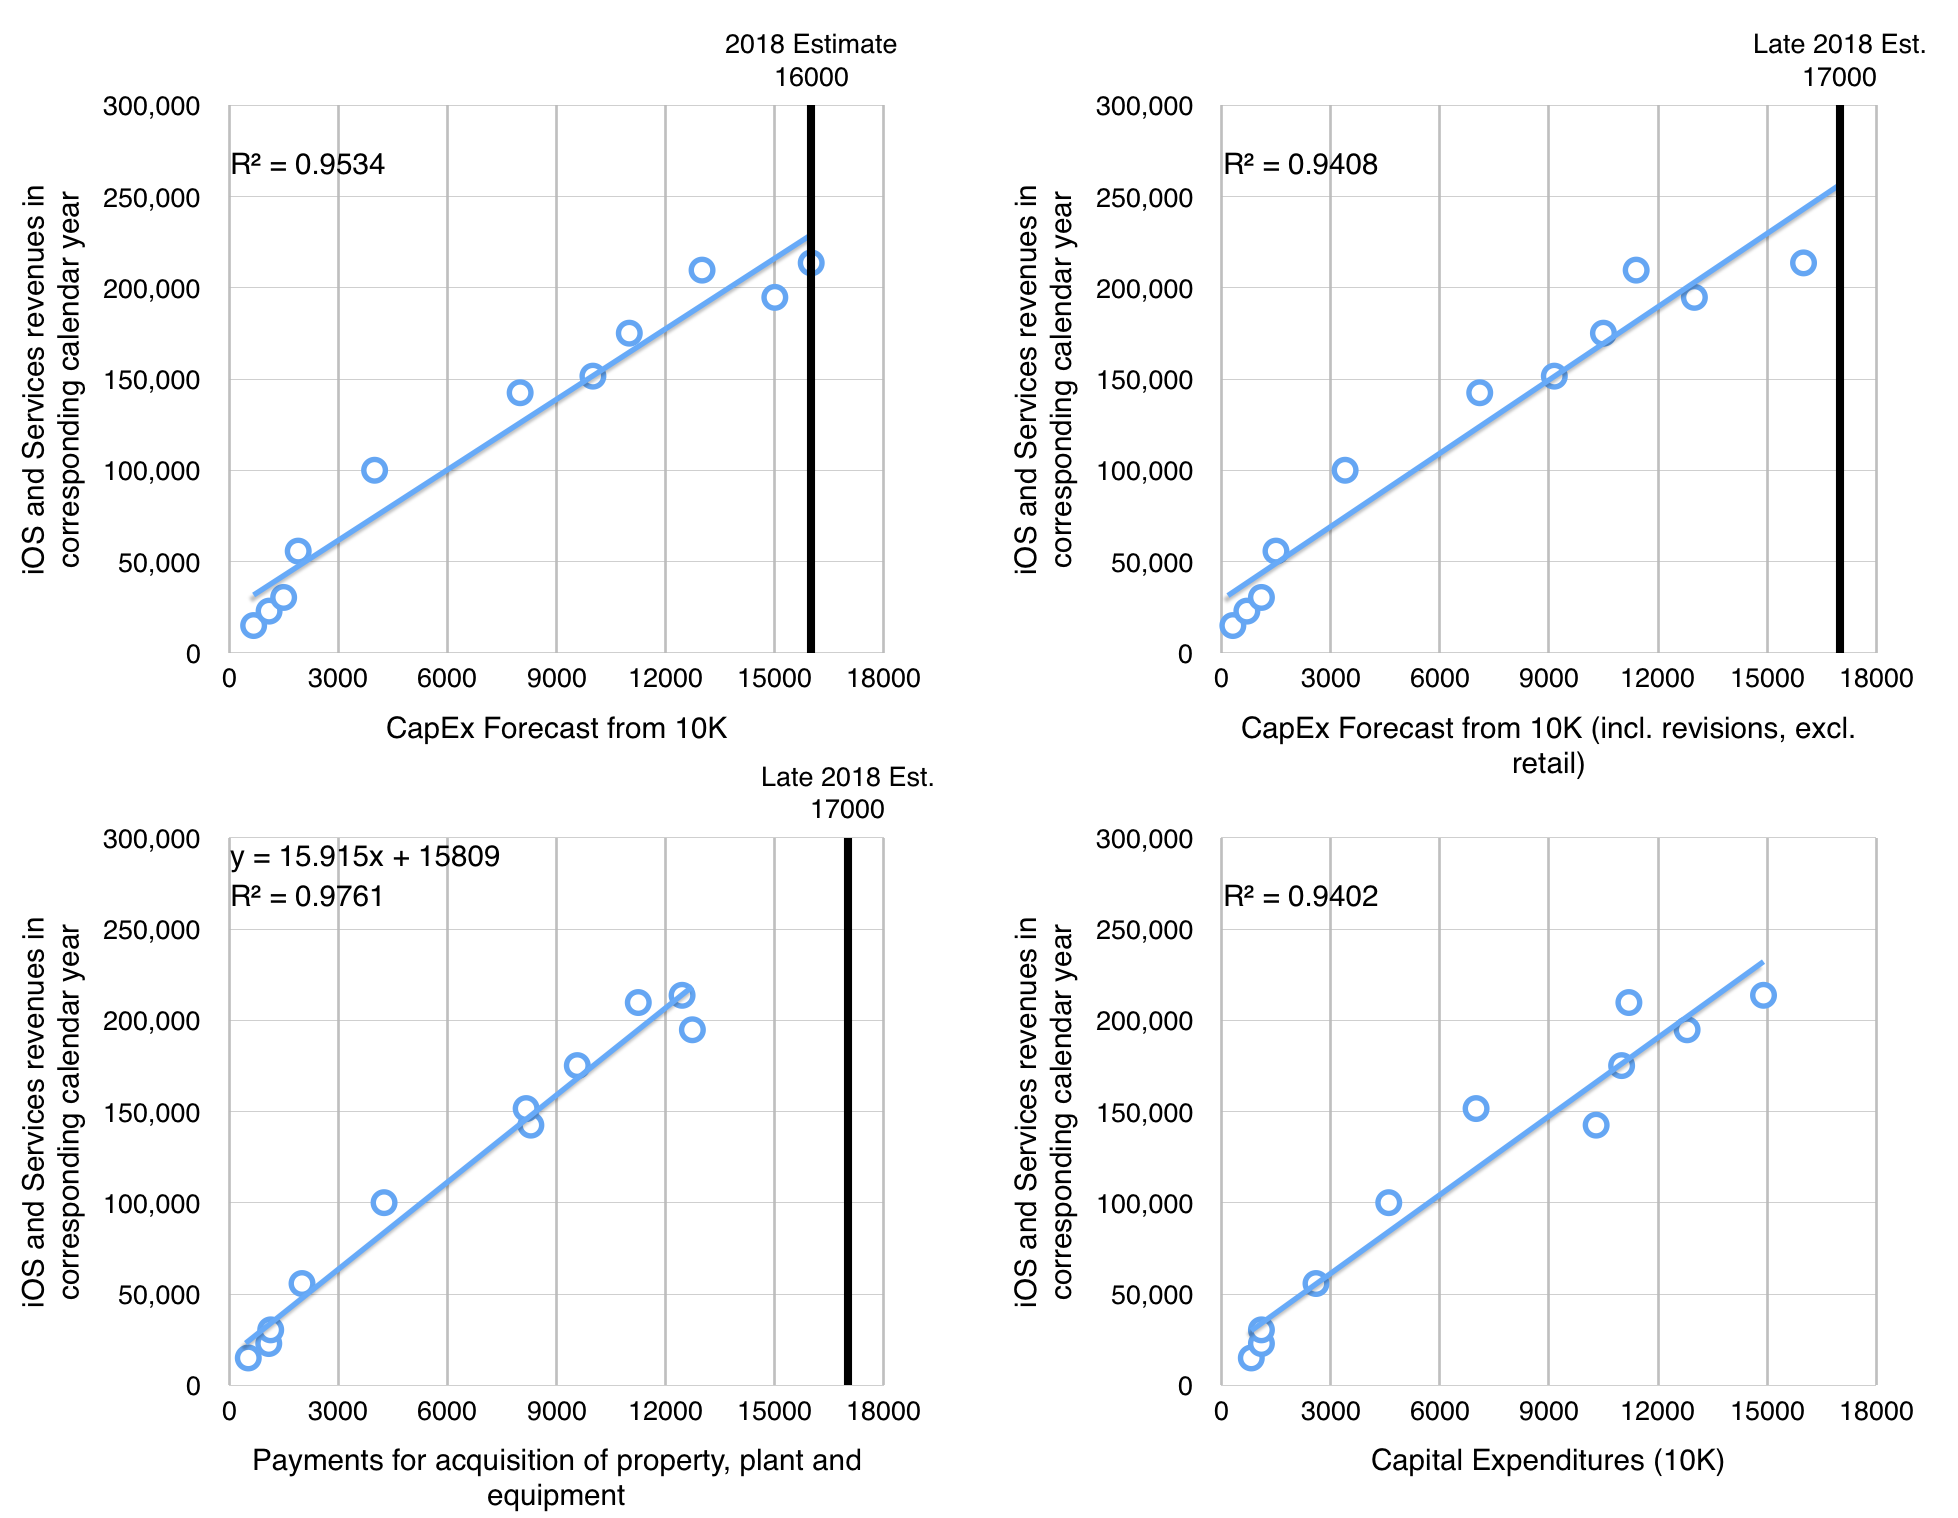
In fact, the relationship is can be shown with four scatter plots, one for each of the published figure:
I caution that this is a yearly forecast and it is revised through the year on a quarterly basis, sometimes up, sometimes down. It's therefore not a perfect indicator and of course the relationship between sales and spending is not perfectly predictable. Note that there are four types of spending that can be measured, two are forecasts (one year and revised) and two are actuals (cash flow payments and reported total expenditures)
We can measure the best variable that fits the sales data through the coefficient of determination or R-squared. The best fit seems to be with Payments for acquisition of property, plant and equipment (R-squared of 0.976).
This gives the formula for yearly sales as 15.915x + 15809 where x is the expected total spending. That spending to date has been $10.272 billion and it's probably going to exceed $16 billion for the year.
Using $16 billion spending total, we can calculate iOS products and services for calendar 2018 of $270.45 billion.
iOS and Services sales to date have been $103.2 billion with an estimate for next quarter of about 54.3 billion (based on guidance) and thus a total through Q3 of $157.5 billion. Subtracting this from the $270.45 billion expectation from the calculation above gives a fourth calendar quarter iOS revenue of $113 billion.
Adding $7 billion for the Mac results in a total net sales of 120billion. This therefore is what I'd put forward as a reasonable target for CQ4.
Note that this is equivalent to a growth of 36% from the 2017 fourth quarter.
[UPDATE: Original version used total sales rather than iOS related products and services (i.e. excluding Mac). The text has been edited to reflect the correct figures.]
The iMac launched May 6 1998, exactly 20 years ago. It is not the most significant computer to ever exist. It was a clear descendant of the original Mac which established the "all-in-one" desktop computer category. That category, to which it still belongs, is a modest segment. The last time Apple reported portable sales separately was in late 2012 when the desktops/servers and pro systems combined made up only 20% of all Mac sales by units. If iMac were 10% of Mac sales, it would represent about 2 million units in 2017.
Desktops evolved into laptops and personal computing evolved into pocket computing. Becoming more personal means more intimacy and this is leading to wearable computing. There is more beyond that to be sure.
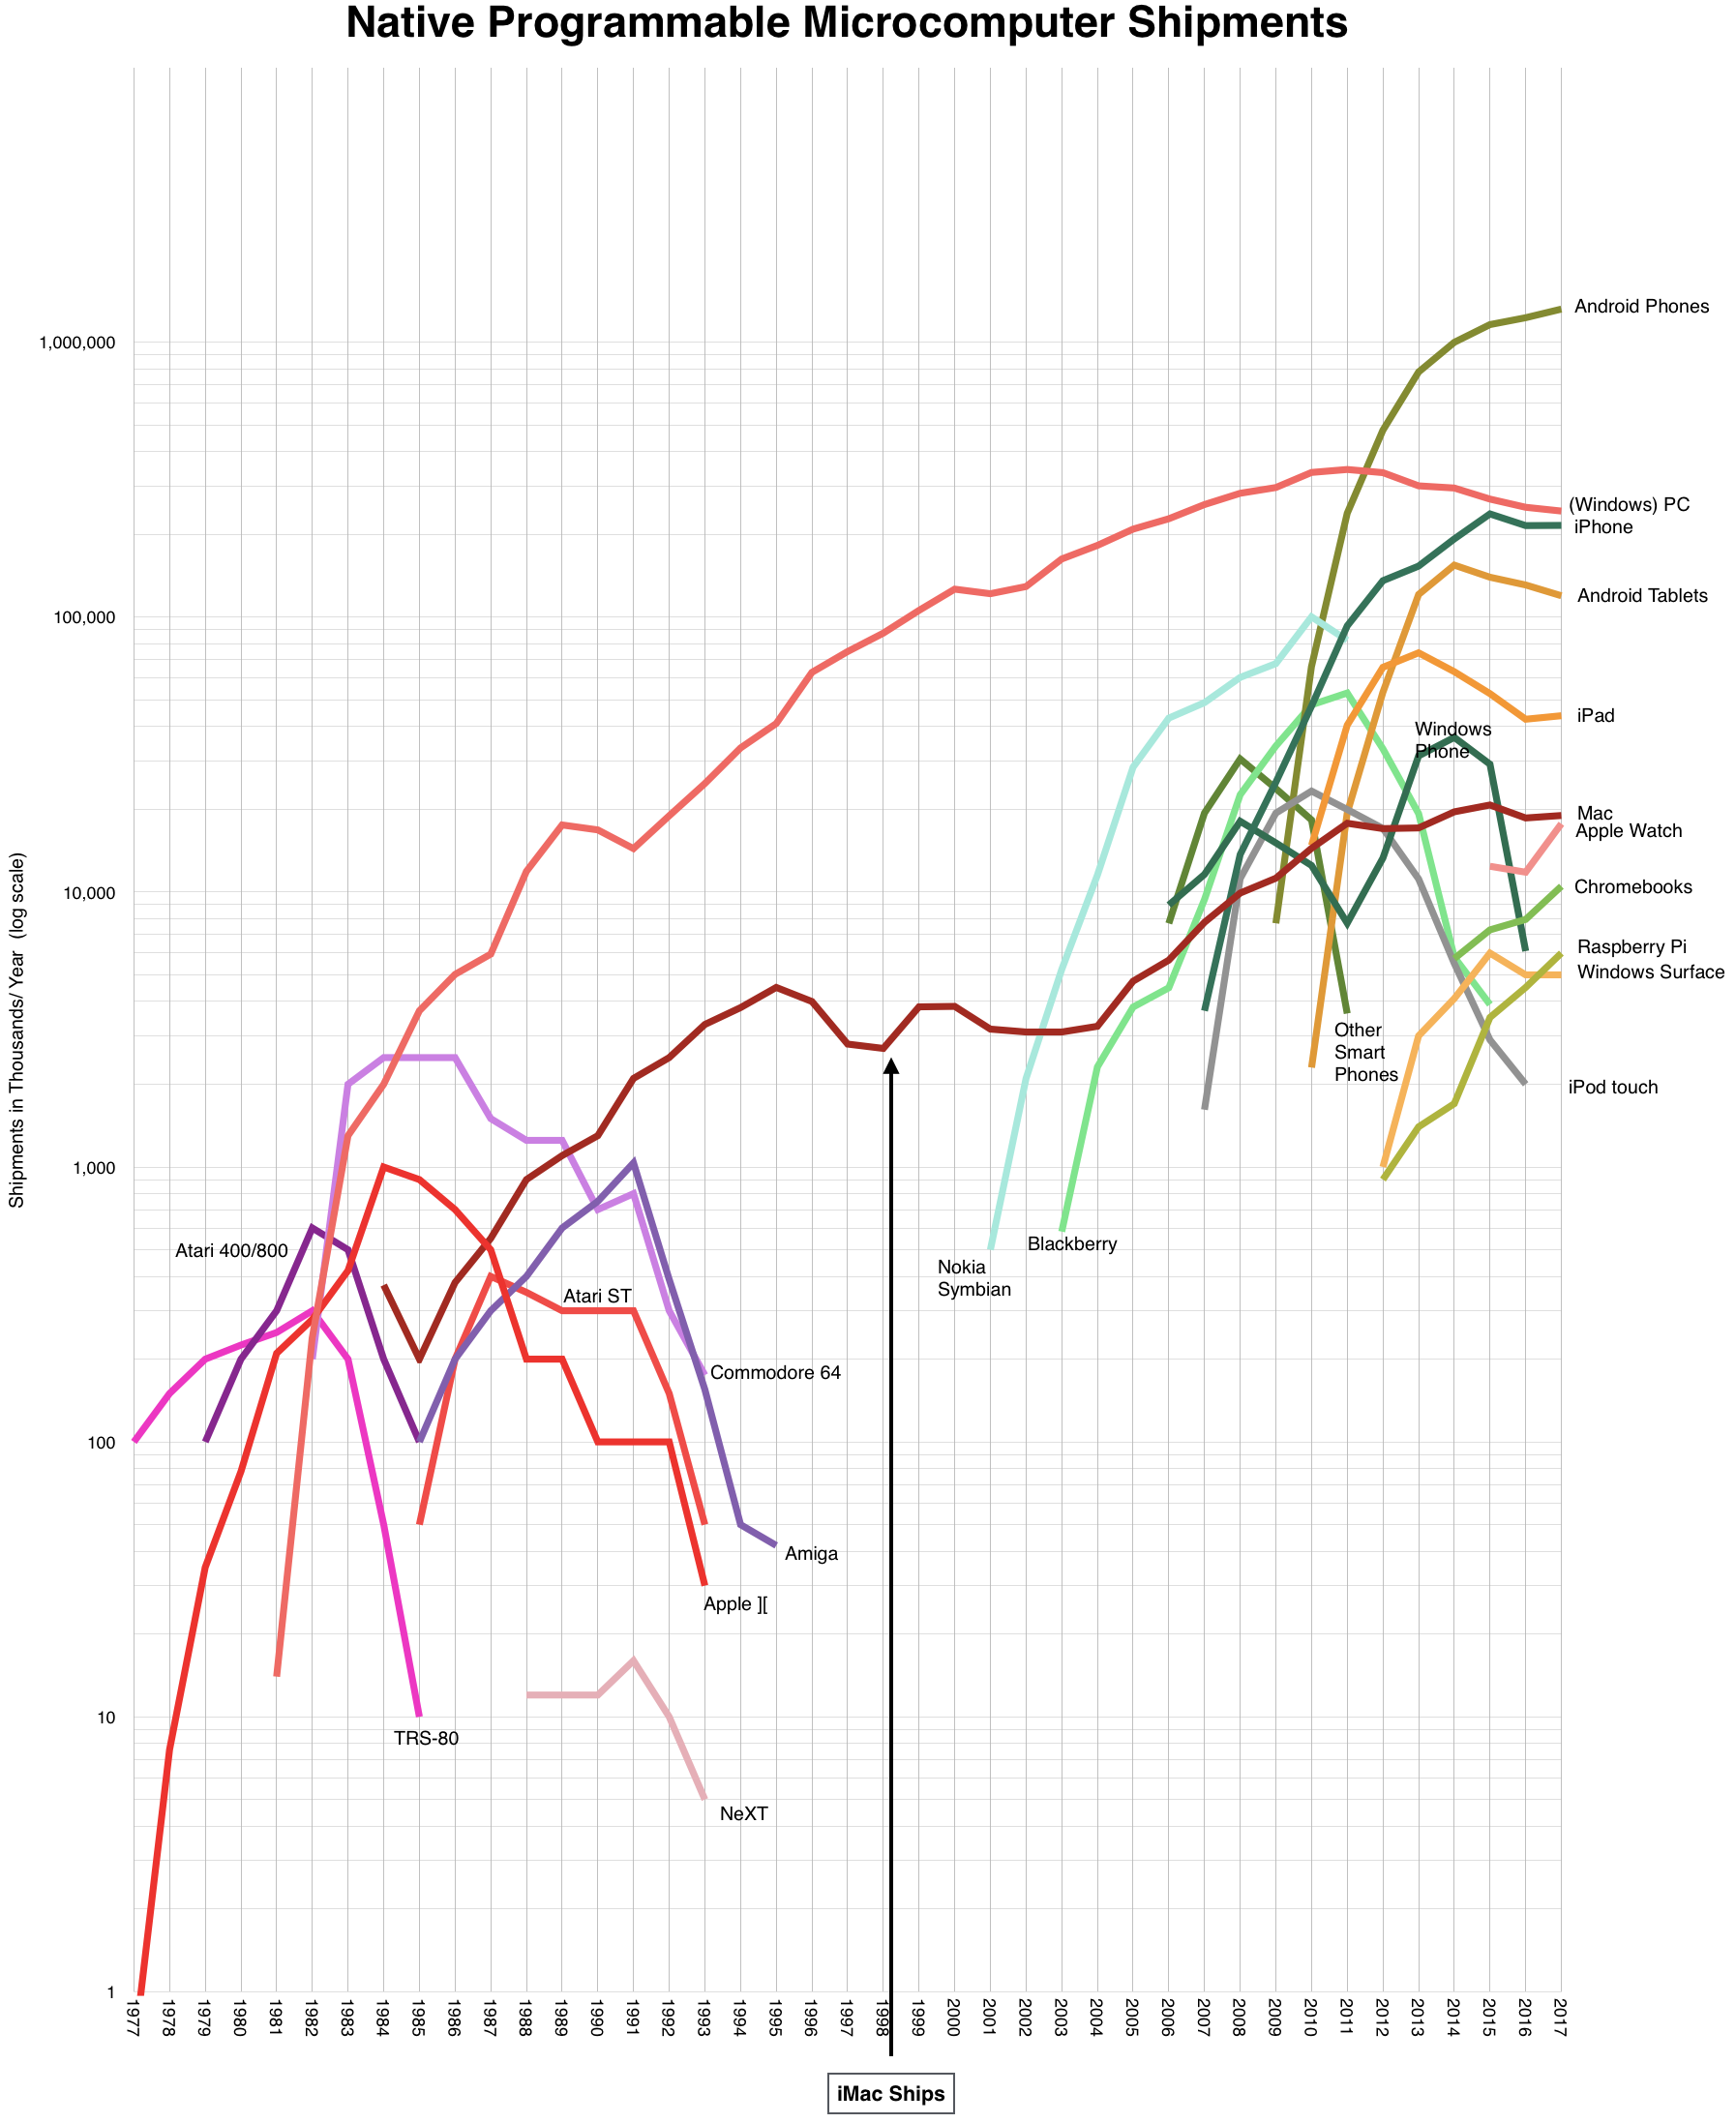
But the iMac is a historically significant machine. It allowed Apple to start on a new trajectory. It did this by first offering a financial lifeline. Sales of Macs, which were at the time the only source of revenues for Apple, increased from 2.7 million to 3.8 million a year. This at a time when Windows PCs were shipping about 100 million units. That was enough to ensure survival. Today Mac units are five times higher while Windows PCs are about 2.5 times higher. The following graph shows the impact of iMac on the Mac's trajectory.
Second, the iMac was the first host of OS X, an operating system built on Unix which made it extremely flexible. iMac gave Apple the space for OS X to be developed and to be optimized for various hardware. The experience with OS X and its inherent scaleability (down as well as up) meant that it could be considered for the post-PC devices of the future.
Lastly, iMac's design screamed "consumer product" which went from signaling inferiority to superiority. It set a standard for novelty, creativity and dynamism in the category that was considered second-rate. In the early 2000s consumers began to lead in the adoption of new technologies. DVD drives, internet connectivity, wifi, instant messaging, media consumption exploded. All the while institutions, hung up on legacy, began to block technologies. At this pivotal moment, the iMac spoke with its looks. It didn't just imply a new order, it stated it.
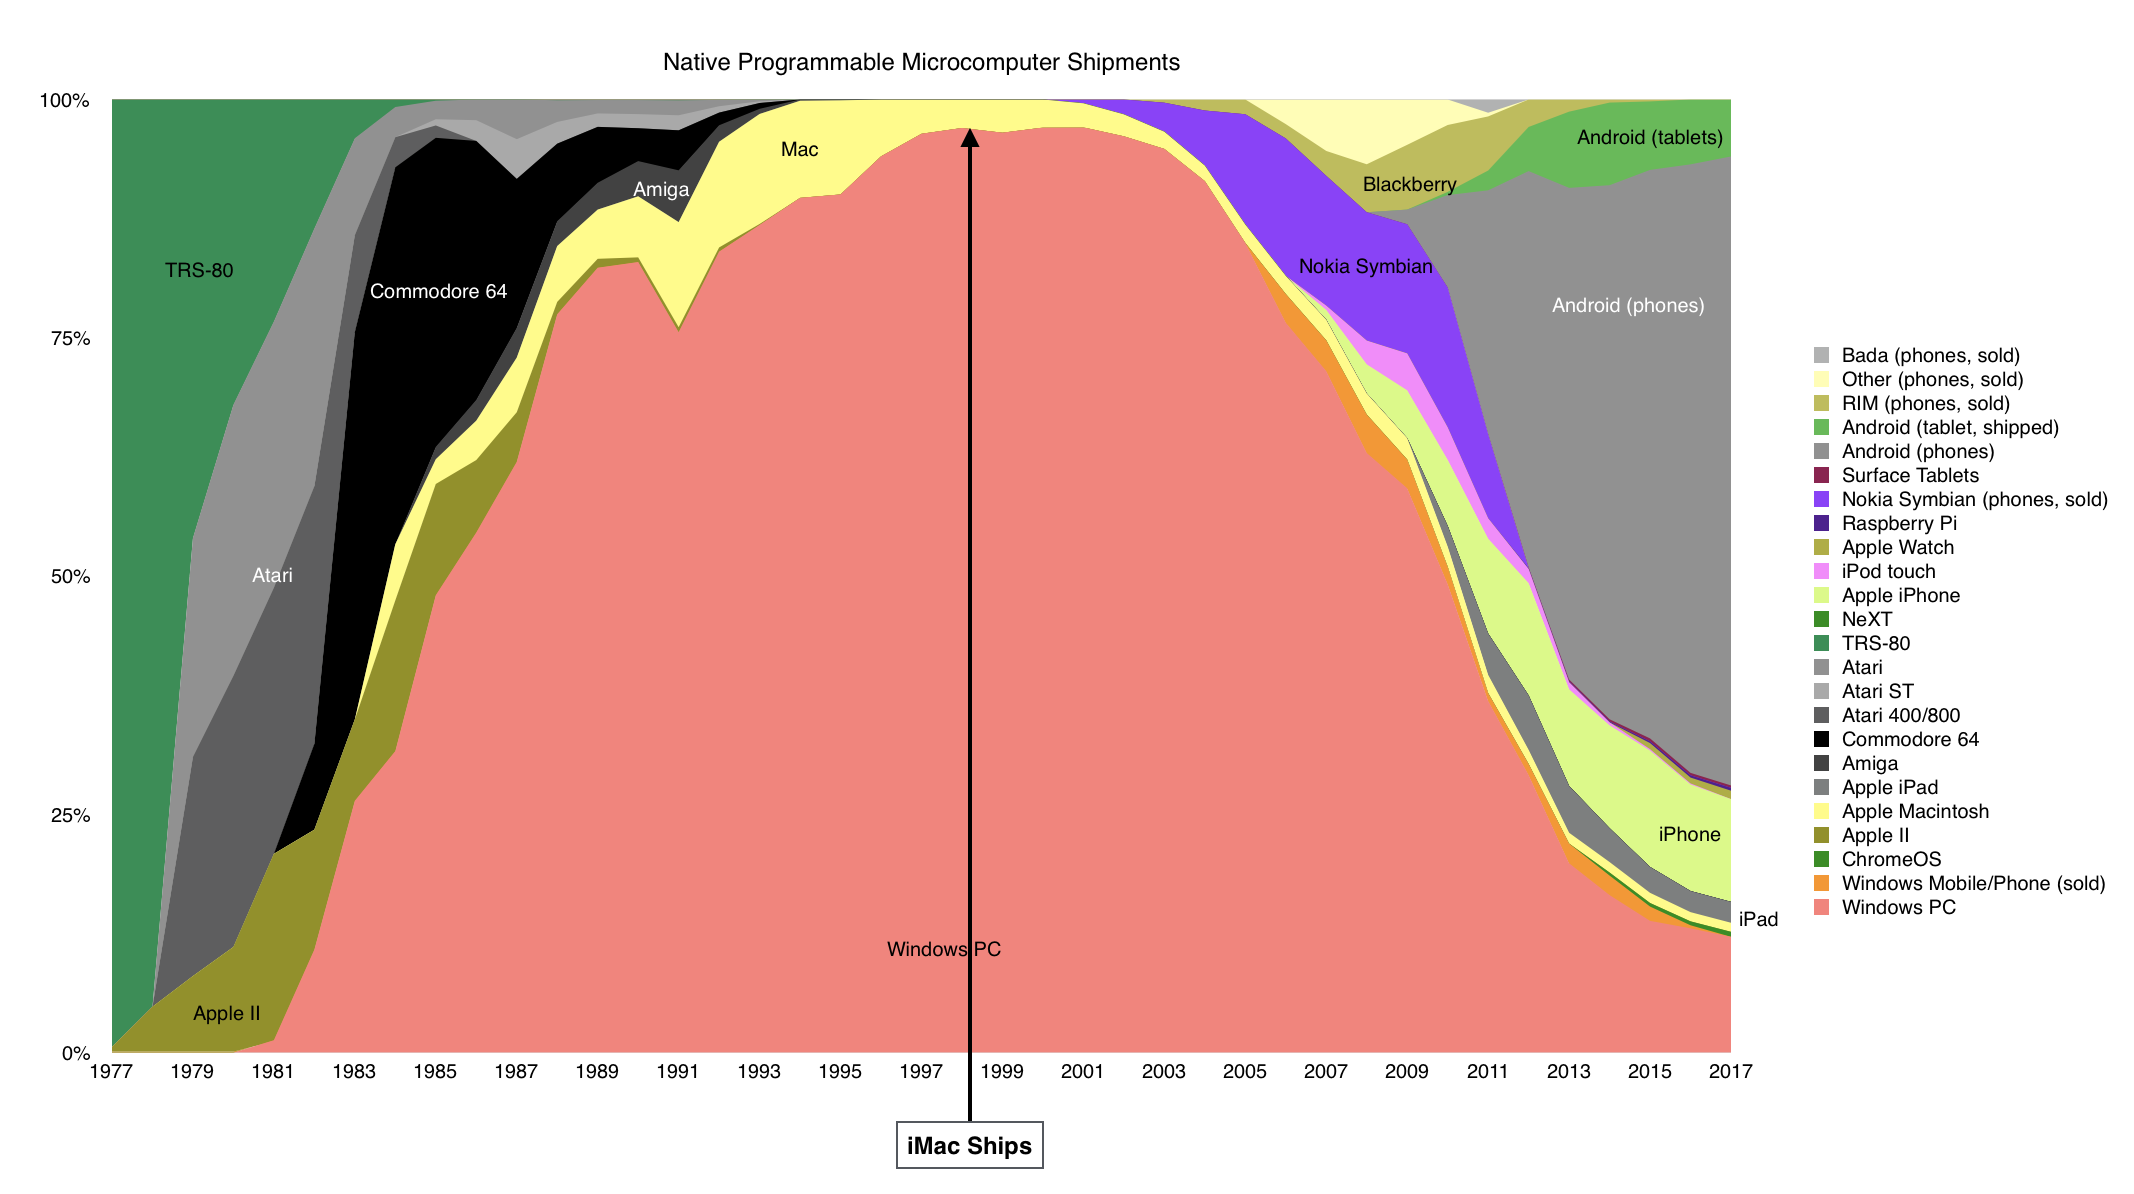
To me the incredible aspect of the iMac's entry is its uncanny timing. It came not only just in time to save Apple but exactly half-way between the first two ages of computing. In the following graph showing "share of computing" you can see it as launching precisely at "peak Windows".
In retrospect you have to wonder if Apple, with the iMac, was lucky to survive into this next era or if that era would have ever happened without the iMac. It's a question of causality which quickly devolves into an un-winnable argument about stochastic vs. deterministic existence.
Regardless, the result was felt more than seen. The computing industry was pivoting. The results are seen also in the graphs above. The iMac came right in the middle of the "desert" of platform choice of the late 1990s. By the 2000s mobile platforms detonated on the scene. The iPod was Apple's first entry, in 2001, but it was not a computer. It was an appliance. A stepping stone at a time when the early platform contenders Nokia, Palm, Microsoft and BlackBerry surged before realizing that they did not have sound foundations upon which to build ecosystems. Their advances could not be consolidated.
The spoils went to the later entries of iOS and Android. The resulting disruption was shocking and disorienting. Not only did the old order get up-ended but the magnitude of the new was 100x the old. The iMac enabled at least a trillion dollars of value to be created and made Apple the biggest company in the world.
As you would expect, at the time, 20 years ago, none of this change was anticipated. iMac was a 'cute' computer. Toy-like and obviously unprofessional. It attracted and relished contempt.
So now we are at a point where the second era of computing is at its apex. With markets near saturation, the device business is inflecting from growth to possible stagnation if not decline. There are two platforms--though unlike Windows, Android is fragmented and iOS is not just on one form factor. Nevertheless there is stasis. The touch UI which begat nine billion devices is normative. The next interaction metaphor has not emerged as an obvious successor.
The question for today is what is the new iMac? What is the enabler for change? It's not easy to spot. It is not the thing of the future but it points to the future.
The following is a transcript of the comments from Tim Cook (CEO) and Luca Maestri (CFO) at Apple's Q1 2018 Earnings Conference Call February 1, 2018. I color coded my interpretation of the comments into four categories:
Grey: Background and promotional commentary
Red: Strategy and signals of what management considers important and may include data beyond the regularly reported numbers.
Green: Financial data
Black: Commentary.
Blue: My commentary, in brackets.
For a quick read of Apple's strategy, read the Red text. These comments are not repeated in financial reports. Highly recommended.
For a quick read of Apple's financial performance, read the green text (which are replicated in financial reports). Read this if you don't want to wade through the financial reports.
For marketing or product material, read the grey text.This is sometimes unique but also repeats product launch information.
---- Tim Cook: Thanks, Nancy and thanks everyone on the call, and welcome to everyone today. Before we dive into the quarter, I'd like to take a moment to talk about a significant milestone we recently crossed.
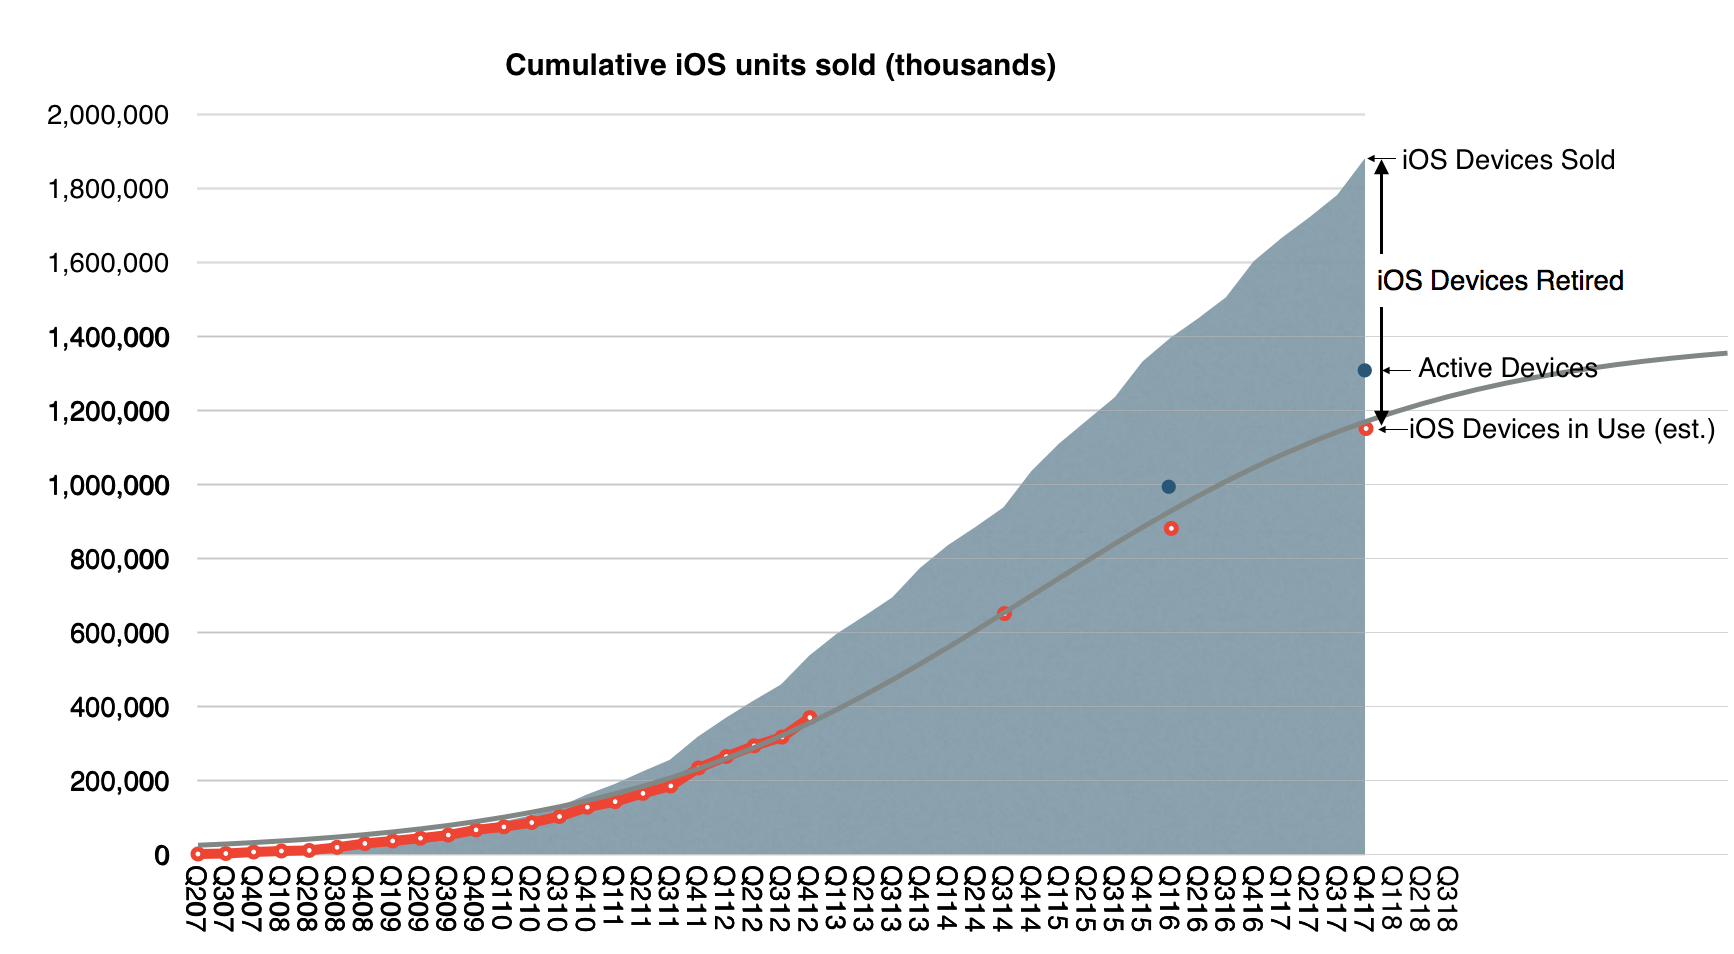
Apple's active installed base reached 1.3 billion devices in January and is at an all-time high for all of our major products. 1.3 billion devices represents an astonishing 30% growth in just two years. It speaks to the strength and reliability of our products and our ecosystem, as well as the loyalty, satisfaction and engagement of our customers. It's also fueling tremendous growth in our services business, which I’ll talk about a little later in the call. [This is probably Apple's most important number. For at least the next 20 years this is the key performance metric and it can be used to derive company's valuation. A summary of the history of active devices vs. units sold is shown in the graph below:]
Turning to the December quarter. We're thrilled to report Apple's biggest quarter ever, which set new all-time records in both revenue and earnings. We generated revenue of $88.3 billion, which is above the high-end of our guidance range, and it is up almost $10 billion or 13% over the previous all-time record we set a year ago.
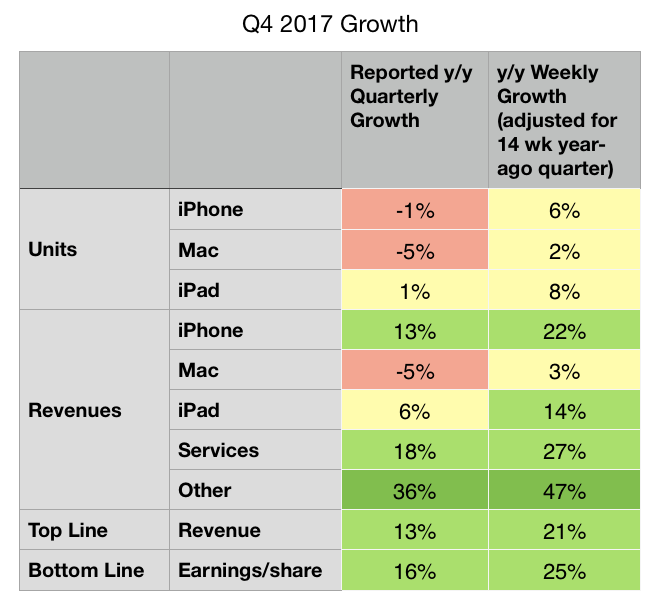
It's also our fifth consecutive quarter of accelerating revenue growth with double digit growth in each of our geographic segments around the world. What makes us even more remarkable is that the quarter we're reporting today was 13-weeks long, while the year ago quarter was 14-weeks. When we look at the average revenue per week in the December quarter this year compared to last year, our growth was a stunning 21%. [The 13-week vs. 14-week year-on-year comparison is repeated several times. The summary differences are shown in the table below:]
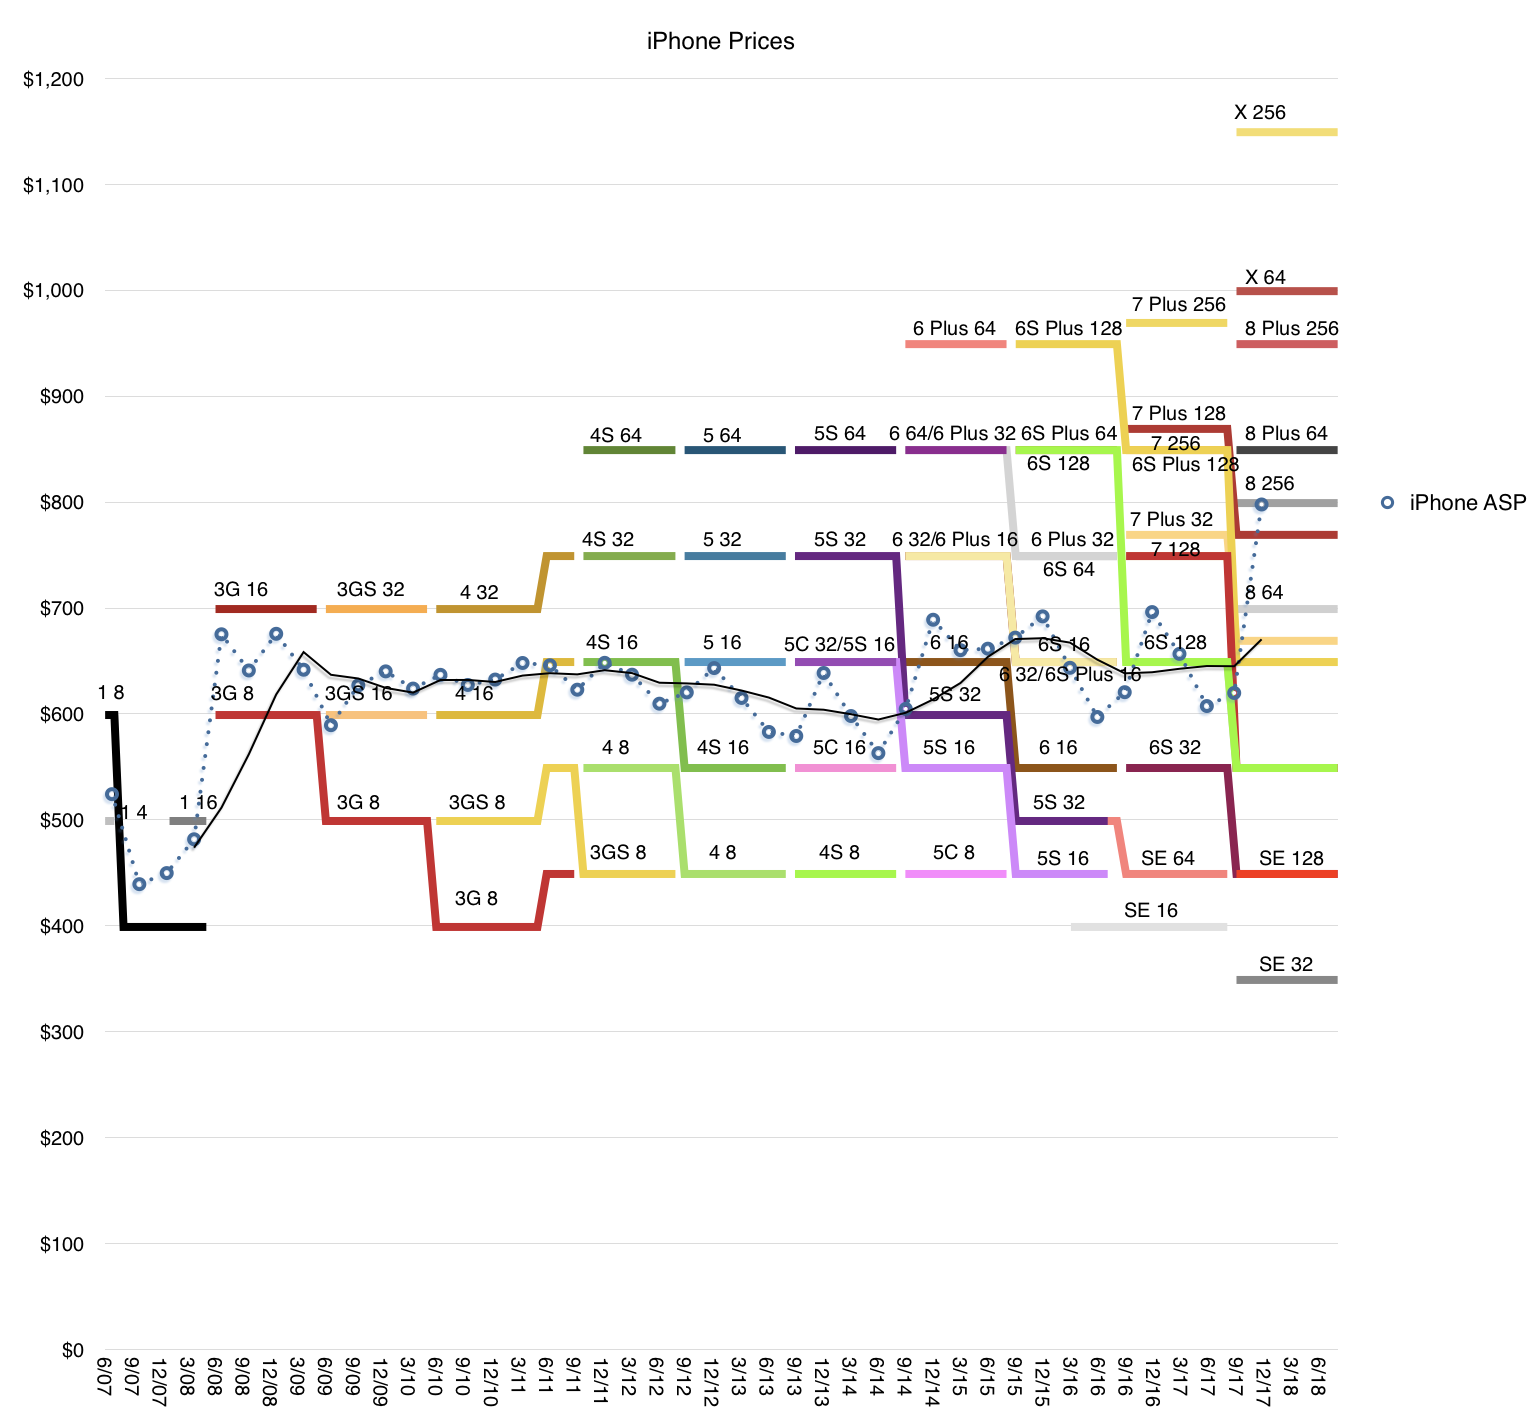
Our growth was broad-based and a key driver was iPhone, which generated its highest revenue ever. iPhone X was the best-selling smartphone in the world in the December quarter according to Canalys, and it has been our top selling phone every week since it launched. iPhone 8 and iPhone 8 Plus rounded out the top three iPhones in the quarter. In fact, revenue for our newly launched iPhones was the highest of any lineup in our history, driving total Apple revenue above our guidance range. [The iPhone X is a huge hit. It drove the average selling price $100 higher y/y. This is not only unprecedented for Apple but for the entire Industry. The average smartphone sells for less than $300 while iPhones sold for $800. The gap is widening. The following graph shows the product mix and the average resulting price.]
I want to take a moment to recognize the tremendous amount of work that went into creating iPhone 10. Our teams carried out an extremely complex launch from both an engineering and operations perspective, executing an outstanding product ramp that required years of research and development; one that introduced innovative features like an edge-to-edge Super Retina Display and the TrueDepth Camera, which enables face ID. Our customers love these new features and the new gestures like simply swiping up from the bottom, which make using iPhone even more intuitive and enjoyable.
Our team has put the technology of tomorrow in our customers’ hands today, set a standard for the next decade of smartphones and we are very proud of their achievements.
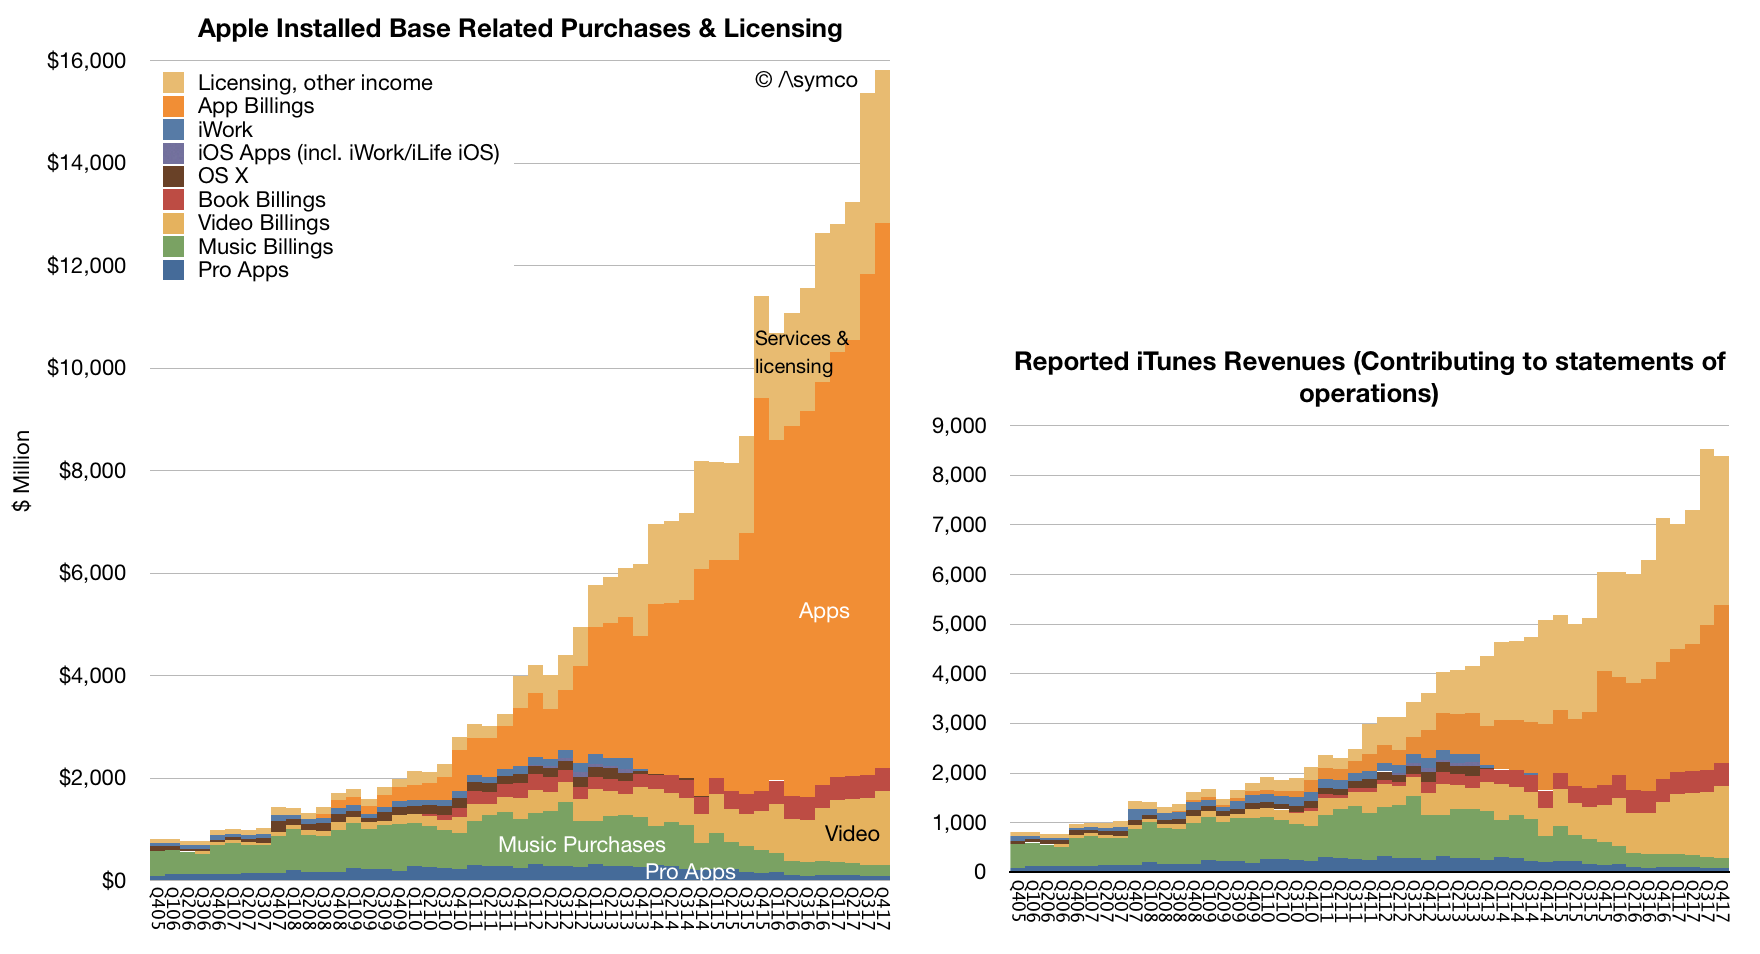
It was another very strong quarter for services with revenue of $8.5 billion, up 18% over last year, and we’re on pace to achieve our goal of doubling our 2016 services revenue by 2020. The number of paid subscriptions across our services offerings passed 240 million by the end of the December quarter, that’s an increase of 30 million in the last 90 days alone, which is the largest quarterly growth ever. [Services has been growing relentlessly for over a decade. This steadiness of growth makes is a juggernaut. Apple is increasingly speaking about subscriptions as the key metric and 240 million is reaching record territory. The rise of Services is shown below (both revenues and consumer spending.)]
We had an all-time record quarter for the App Store with our best holiday season ever. We’re seeing great excitement around augmented reality with customers now enjoying over 2,000 ARKit enabled app, spanning every category in the App Store. In December, when Pokémon GO released its new augmented reality features built with ARKit, it jumped the top of the App Store charts. Last week, on a stop in Toronto, I met developers who are hard at work on creative applications using ARKit from art appreciation to ecommerce, and I was very impressed with what I saw.
Just for months after ARKit launched to the public, we’ve already released ARKit 1.5 in beta to developers around the world, and the response has been tremendous. Augmented reality is going to revolutionize many of the experiences we have with mobile devices. And with ARKit, we’re giving developers the most advanced tools on the market to create apps for the most advanced operating system running on the most advanced hardware. This is something only Apple can do.
In addition to the App Store, several other services had their biggest quarter ever, including Apple Music, iCloud and Apple Pay, all of which saw growth in both active users and revenue.
Apple Pay has reached an important milestone in the U.S. As a result of 50% year-over-year growth in merchant adoption, it’s now accepted at more than half of all American retail locations, which includes more than two-thirds of the country’s top 100 retailers. Now available in 20 markets, global Apple Pay purchase volume more than tripled year-over-year and we’re delighted to be expanding to Brazil in the coming months. [There are no absolute data points on Apple Pay but we do have some scattered growth data. The US data is cited here but in my experience it's more popular in select countries like UK where users are using it habitually]
Today, you can use Apple Pay to take the subway in Guangzhou, China, see a concert at London’s Wembley Stadium or buy a souvenir in Yosemite National Park. In the U.S., we launched Apple Pay Cash in December, and it’s off to a terrific start. Millions of people are already using it to send and receive money with friends and family quickly, easily and securely; to split a bill, pay someone back, or send last minute gift right from the messages app.
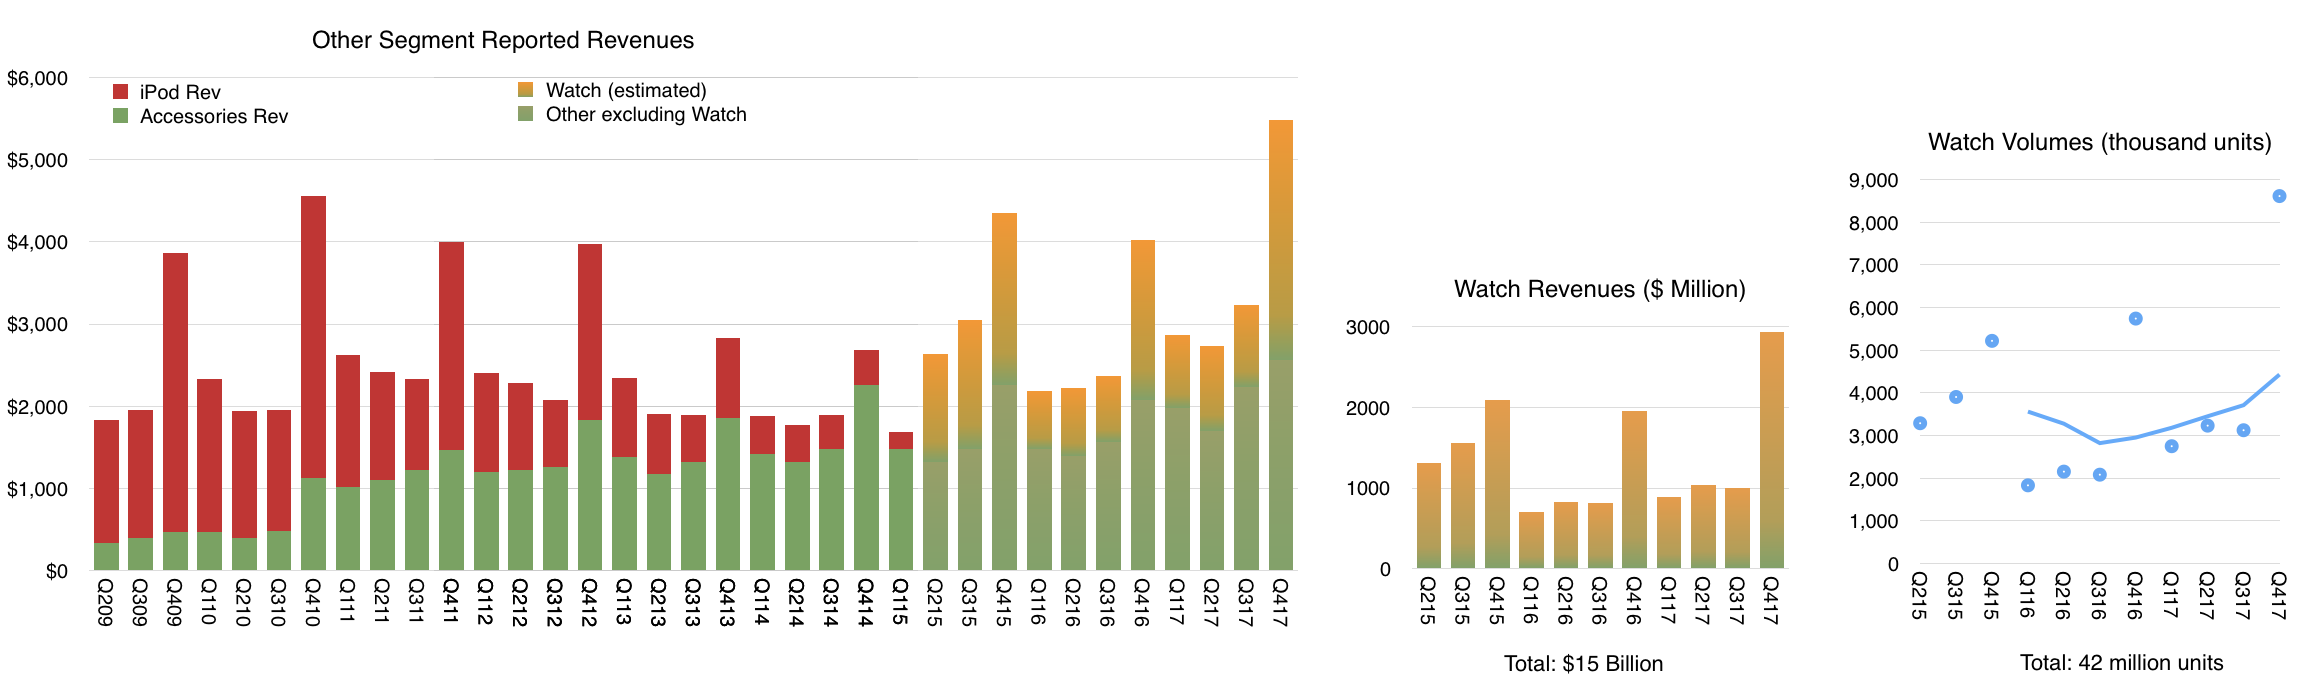
It was our best quarter ever for the Apple Watch with over 50% growth in revenue and units for the fourth quarter in a row and strong double-digit growth in every geographic segment. Sales of Apple Watch Series 3 models were also more than twice the volume of Series 2 a year ago. Apple Watch is the most popular, smart watch in the world and gained market share during the quarter based on the latest estimates from IDC. [Apple Watch is growing consistently. The following graph shows my estimates of volume (total 42 million to date) and revenues (total $15 billion) based on all available data and commentary from management.]
It was the third consecutive quarter of growth for iPad revenue, thanks to the strength of both iPad and iPad Pro. Based on the latest data from IDC, we gained share in nearly every market we track with strong outperformance in emerging markets.
Worldwide, almost half of our iPad sales were the first-time tablet buyers are those switching to Apple, and that’s true in some of our most developed markets, including Japan and France. In China, new and switching users made up over 70% of all iPad sales.
For Mac, we launched the all new, iMac Pro in mid-December. It’s an entirely new product line designed for our Pro users who love the all-in-one design of iMac and require workstation class performance. It's the fastest, most powerful Mac ever, delivering incredible computational power, for simulation and real time 3D rendering, immersive VR and complex photography audio and video projects. Worldwide, 60% of our Mac sales were the first time buyers and switchers and in China, that number was almost 90%.
We're looking forward to getting HomePod in customers’ hands beginning next week. HomePod is an innovative wireless speaker, which delivers stunning audio quality wherever its placed in the home, thanks to the advanced Apple engineered hardware and software.
Together with Apple Music, HomePod gives you instant access to one of the world's largest music catalogs. And with the intelligence of Siri, it’s a powerful assistant you control through natural voice interaction. We're very happy with the initial response from reviewers who've experienced HomePod ahead of its launch, and we think our customers are going to love this new product.
We believe one of the key issues of the 21st century is education. And because of that, we've strengthened our commitment and investment into initiatives like everyone can code. To find the innovators of the future, we need to nurture the students of today. Our App Development with Swift curriculum, which is available free on iBooks, has been downloaded more than 1.2 million times worldwide with almost half of those coming from here in the United States. It’s also being taught in dozens of community colleges across the country, putting practical skills in the hands of today’s jobs seekers.
I was in London two weeks ago as we announced that the program was expanding to more than 70 colleges and universities in Europe. Millions of students around the world will have the opportunity to add Swift to their coding vocabulary and gain skills that are essential for today’s economy.
This is an exciting time at Apple and with the best lineup of products and services we've ever had and a set of initiatives that show how business can be a force for good in the world. We could not be more excited about our future.
Now, for more details on the December quarter results, I'd like to turn over the call to Luca.
Luca Maestri: Thank you, Tim. Good afternoon, everyone. Our business and financial performance in the December quarter were exceptional, as we set new all-time records for revenue, operating income, net income and earnings per share.
Starting with revenue, we’re reporting an all-time record, $88.3 billion, up nearly $10 billion or 13% over the prior record set last year. It is our fifth consecutive quarter of accelerating revenue growth. As you know, the December quarter a year ago spanned 14-weeks compared to 13-weeks this year, which is important to consider as we have set the underlying performance of our business this year. When we look at average revenue per week, our growth rate was even higher at 21% with growth across all product categories for the third consecutive quarter.
Our results were terrific all around the world with double digit revenue growth in all our geographic segments, an all-time quarterly record in the vast majority of markets we track, including the U.S., Western Europe, Japan, Canada, Australia and Korea, as well as Mainland China, Latin America, The Middle East, Central and Eastern Europe, and India.
In Greater China, we were very happy to generate double digit revenue growth for the second quarter in a row and in emerging markets outside of Greater China, we saw 25% year-over-year growth.
Gross margin was 38.4% at the high end of our guidance range. Operating margin was 29.8% of revenue. Our net income was $20.1 billion an all-time record, and up $2.2 billion over the last year. Diluted earnings per share were $3.89 also an all-time record and cash flow from operations was very strong at $28.3 billion.
During the quarter, we sold 77.3 million iPhones, the highest number ever for a 13-week quarter. Average weekly iPhone sales were up 6% compared to December quarter last year with growth in every region of the world despite the staggered launch of iPhone 10. We established all-time iPhone revenue record in nearly every market we track with double-digit growth in all of our geographic segments. iPhone ASP increased to $796 from $695 a year ago, driven primarily by the launch of iPhone 10 and the success of iPhone 8 and 8 Plus.
We exited the December quarter towards the lower end of our target range of five to seven weeks of iPhone channel inventory with less than 1 million more iPhones in the channel compared to the December quarter a year ago, in line with our growth in average weekly unit sales. Customer interest and satisfaction with iPhone are very, very strong for both consumers and business users.
The latest data from 451 Research indicates U.S. customer satisfaction ratings of 96% or higher across iPhone models. In fact, combining iPhone 8, iPhone 8 Plus and iPhone 10, consumers reported an amazing 99% satisfaction rating. And among business customers planning to purchase smartphones in the next quarter, 77% planned to purchase iPhone. Our customers are also incredibly loyal with Kantar's latest U.S. research, reflecting a 96% iPhone loyalty rate, the highest ever measured. [Customer satisfaction is the second most important figure after active user base. Combining these two figures yields the recurring revenue value of the company. Remember what Deming said: the most important measurements for a company's value are the multipliers of a satisfied customer and a dissatisfied customer--these numbers never appear on any financial report but they are applied to all the numbers on every report].
Turning to services. We had a terrific quarter with revenue of $8.5 billion, up 18% year-over-year and up 27% in terms of average revenue per week; that is an acceleration to the 24% services growth run rate that we experienced in the September quarter.
The App Store set a new all-time revenue record. The Store’s all-new design is off to a fantastic start with quarterly store visitors, transacting accounts and paying accounts, reaching new all-time highs. During the week beginning December 24th, a record number of customers made purchases or downloaded Apps from the App Store, spending over $890 million in that seven-day period, followed by $300 million in purchases on New Year’s day alone.
And according to App Annie’s latest report, the App Store continues to be the preferred destination for customer purchases by a very wide margin, generating nearly twice the revenue of Google Play. Across all our services offerings, paid subscriptions reached $240 million with growth of 58% over last year and they were a major contributor to the overall strong growth in services revenue. [Apple has half the user base of Google Android. This is based on Google's May 2017 report of 2 billion active devices vs. the 1.3 billion that we just got from Apple. And yet these users collectively spend twice as much on apps. This ratio of "half the users, twice the spending" has been cropping up in individual developer anecdotes and can also be seen in other metrics of engagement and consumption. This should not be surprising as it conforms to the Pareto distribution of economic value.]
As Tim mentioned, it was our best quarter ever for Apple Watch. And when we add to this us from Beats and AirPods, our total revenue from wearables was up almost 70% year-over-year. In fact, wearables were the second largest contributor to revenue growth after iPhone, which is impressive for a business that started only three years ago. In total, our other products category set a new all-time record with quarterly revenue exceeding $5 billion for the first time. [Wearables now includes more than watches but watches are likely still the dominant product.]
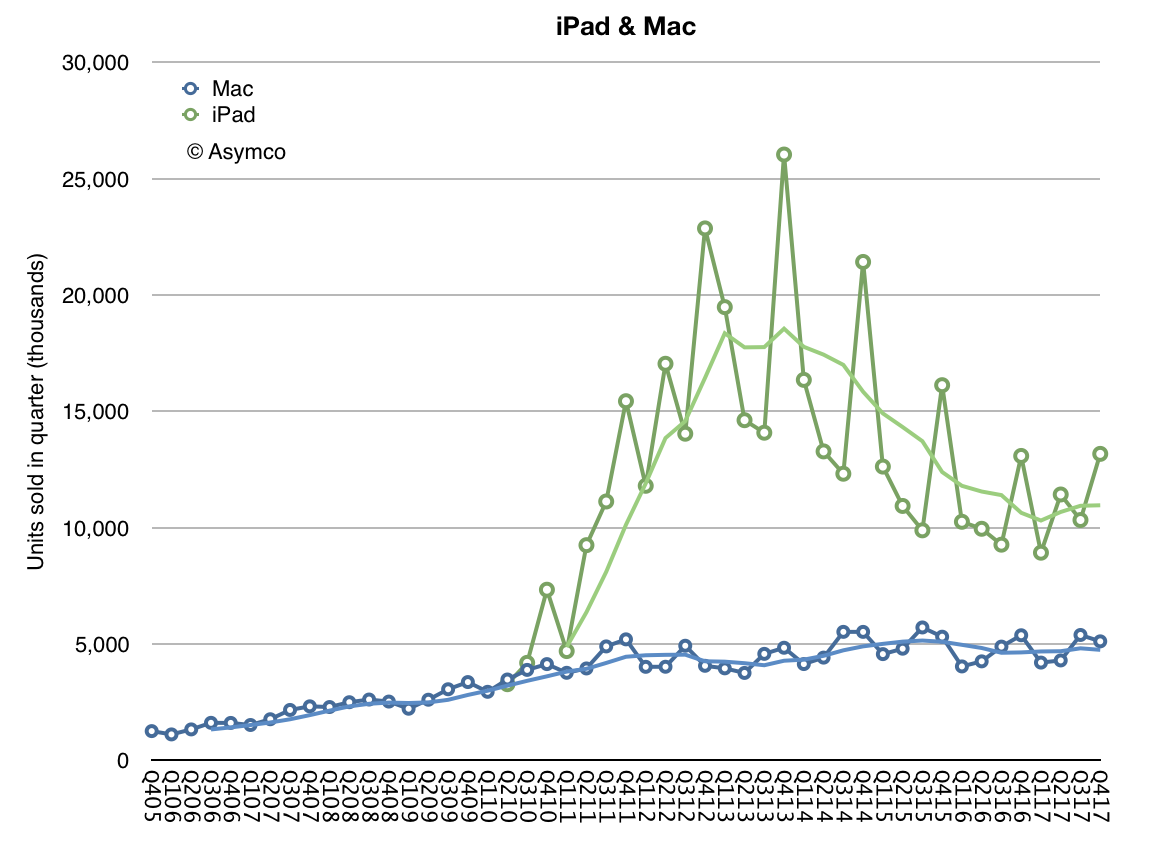
Next, I’d like to talk about the Mac. We sold 5.1 million Macs during the December quarter, which translates to a 2% year-over-year increase in average sales per week. Mac performance was particularly strong in emerging markets with unit sales up 13% year-over-year and with all-time records in Latin America, in India, Turkey and Central and Eastern Europe. On a worldwide basis, the active install base of Macs was up double-digits year-over-year to a new record.
It was also another growth quarter for iPad. We sold 13.2 million units with average iPad sales per week up 8% over last year’s December quarter. iPad sales grew strong double-digits in many emerging markets, including Latin America, the Middle East, Central and Eastern Europe and India, as well as developed markets, including Japan, Australia and Korea. The active install base of iPad has grown every quarter since its launch in 2010, and it reached a new all-time high in December, thanks to extremely high customer loyalty and large numbers of first-time iPad users. [iPad is clearly recovering from a long decline. ASPs are rising as it's being positioned as a PC alternative. Its low end functions are being absorbed by large screen iPhones.]
NPD indicates that iPad had 46% share of the U.S. tablet market in the December quarter, up from 36% share a year ago. And the most recent surveys from 451 Research found that among customers planning to purchase tablets within 90 days, 72% of consumers and 68% of business users planned to purchase iPads. Customer satisfaction is also very high with businesses reporting a 99% satisfaction rating for iPad.
We are seeing great traction in enterprise as businesses across industries and around the world standardize on iOS. For example, Intesa Sanpaolo, one of Europe’s leading banks, has chosen iOS as the mobile standard for its entire 70,000 employee base in Italy; choosing iOS for its security, user interface, accessibility and reliability, Intesa Sanpaolo will deploy native apps to improve employee productivity in customer support, human resources, and marketing across the company.
And LensCrafters, one of the largest optical retail brands in North America, will be using over 7,000 iPad Pros to enable digital eye exams and digital optical measurements in a personalized and interactive experience. We’re also rolling out a new initiative, called Apple AtWork to help businesses implement employee choice programs more easily and offer Apple products company-wide.
Resources from both Apple and our channel partners will enable enterprise IT and procurement teams to buy or lease Apple products more efficiently, streamline the setup of iPhone, iPad, and Mac, and deliver a seamless onboarding experience for employees. We launched the program with CDW in the U.S. last week, and we would be expanding to more channels and regions later this year.
The December quarter was extremely busy for our retail and online stores, which welcomed 538 million visitors. Traffic was particularly strong during the four-weeks following the launch of iPhone 10, up 46% over last year. And across the quarter, our stores conducted over 200,000 today at Apple sessions, covering topics including photography, music, gaming, and app development, and art and design. Just last weekend, we opened our first store in Seoul, Korea and we’re looking forward to opening our first store in Austria in a few weeks. These newest openings will mark the expansion of our retail store presence to 21 countries.
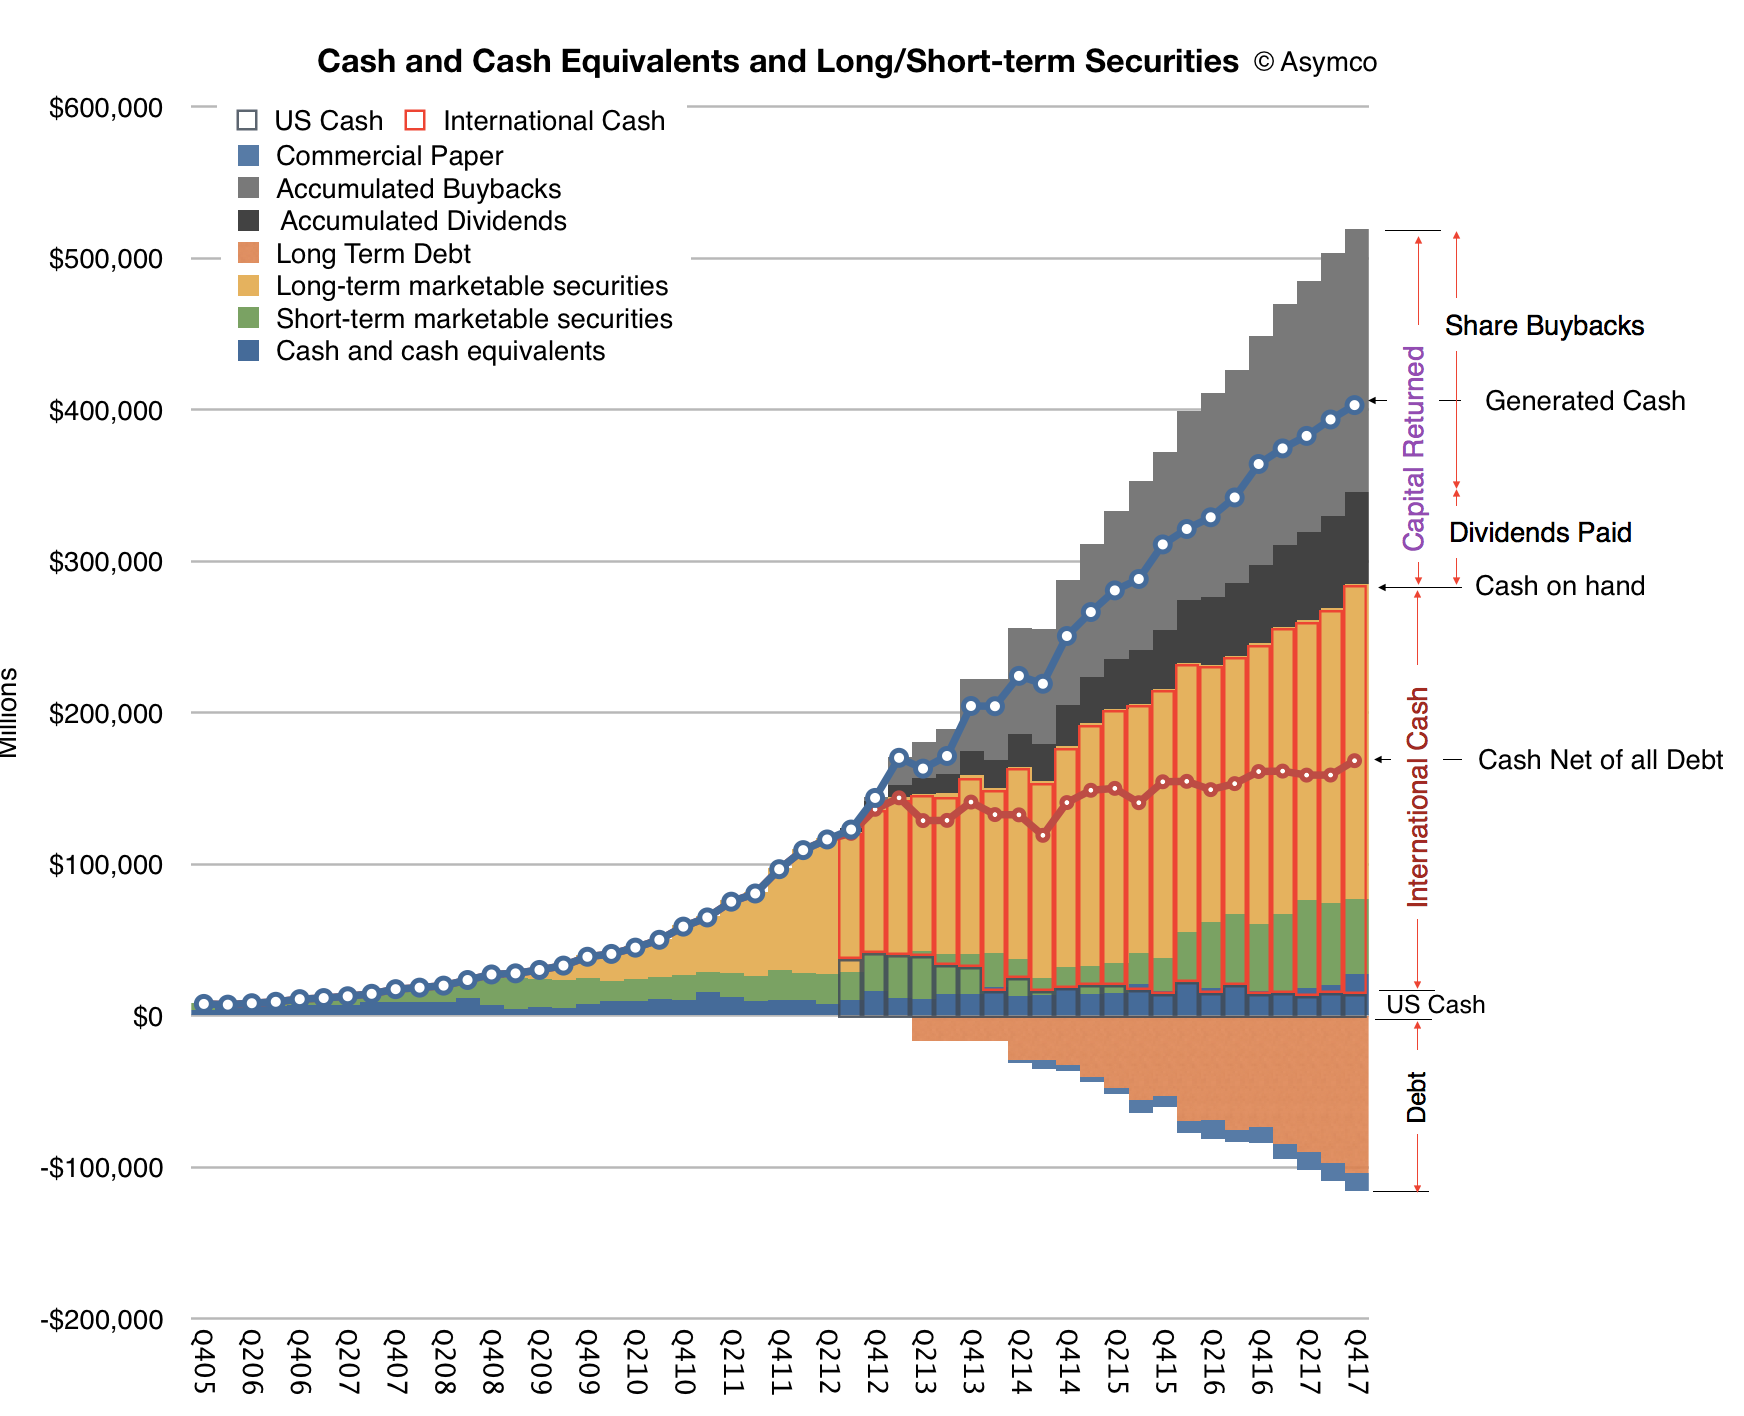
Let me now turn to our cash position. We ended the quarter with $285.1 billion in cash plus marketable securities, a sequential increase of $16.2 billion. $269 billion of this cash, or 94% of the total, was outside the United States. We issued $7 billion in debt during the quarter, bringing us to $110 billion in term-debt and $12 billion in commercial paper outstanding, for a total net cash position of $163 billion at the end of the quarter. We also returned $14.5 billion to investors during the quarter. We paid $3.3 billion in dividends and equivalents, and spent $5.1 billion on repurchases of 30.2 million Apple shares through open market transactions.
We launched a new $5 billion ASR program, resulting in initial delivery and retirement of 23.6 million shares and we retired 3.8 million shares upon the completion of our 12th ASR during the quarter. We’ve now completed over $248 billion of our $300 billion capital return program, including $176 billion in share repurchases against our announced $210 billion buyback program with $34 billion remaining under our current authorization. [An updated look at Apple's cash is shown below]
Turning to taxes. Due to the recently enacted legislation in the U.S., we estimate making a corporate income tax payment of approximately $38 billion to the U.S. government on our cumulative past foreign earnings. This amount is very similar to what we had been accruing on those earnings in our financial results through fiscal year 2017, including the $38 billion payment. We will have paid over $110 billion of corporate income tax on our total domestic and foreign earnings during the last 10 years for a cash tax rate of about 26%. [Apple has paid more tax than any company in history, and is about the make the largest single payment to the US Treasury.]
Our tax rate of 25.8% for the December quarter was close to our guidance of 25.5% as the lower U.S. statutory rate from the new legislation was effective offset by the remeasurement of deferred tax balances.
As we move ahead into the March quarter, I'd like to review our outlook, which includes the types of forward looking information that Nancy referred to at the beginning of the call; we expect revenue to be between $60 billion and $62 billion; we expect gross margin to be between 38% and 38.5%; we expect OpEx to be between $7.6 billion and $7.7 billion; we expect OI&E to be about $300 million; and we expect the tax rate to be about 15%.
Tax reform will allow us to pursue a more optimal capital structure for our company. Our current net cash position is $163 billion. And given the increased financial and operational flexibility from the access to our foreign cash, we are targeting to become approximately net cash neutral overtime. We will provide an update to our specific capital allocation plans when we report results for our second fiscal quarter, consistent with the timing of updates that we have provided in the past.
Finally, today our Board of Directors has declared a cash dividend of $0.63 per share of common stock, payable on February 15, 2018, to shareholders of record as of February 12, 2018.
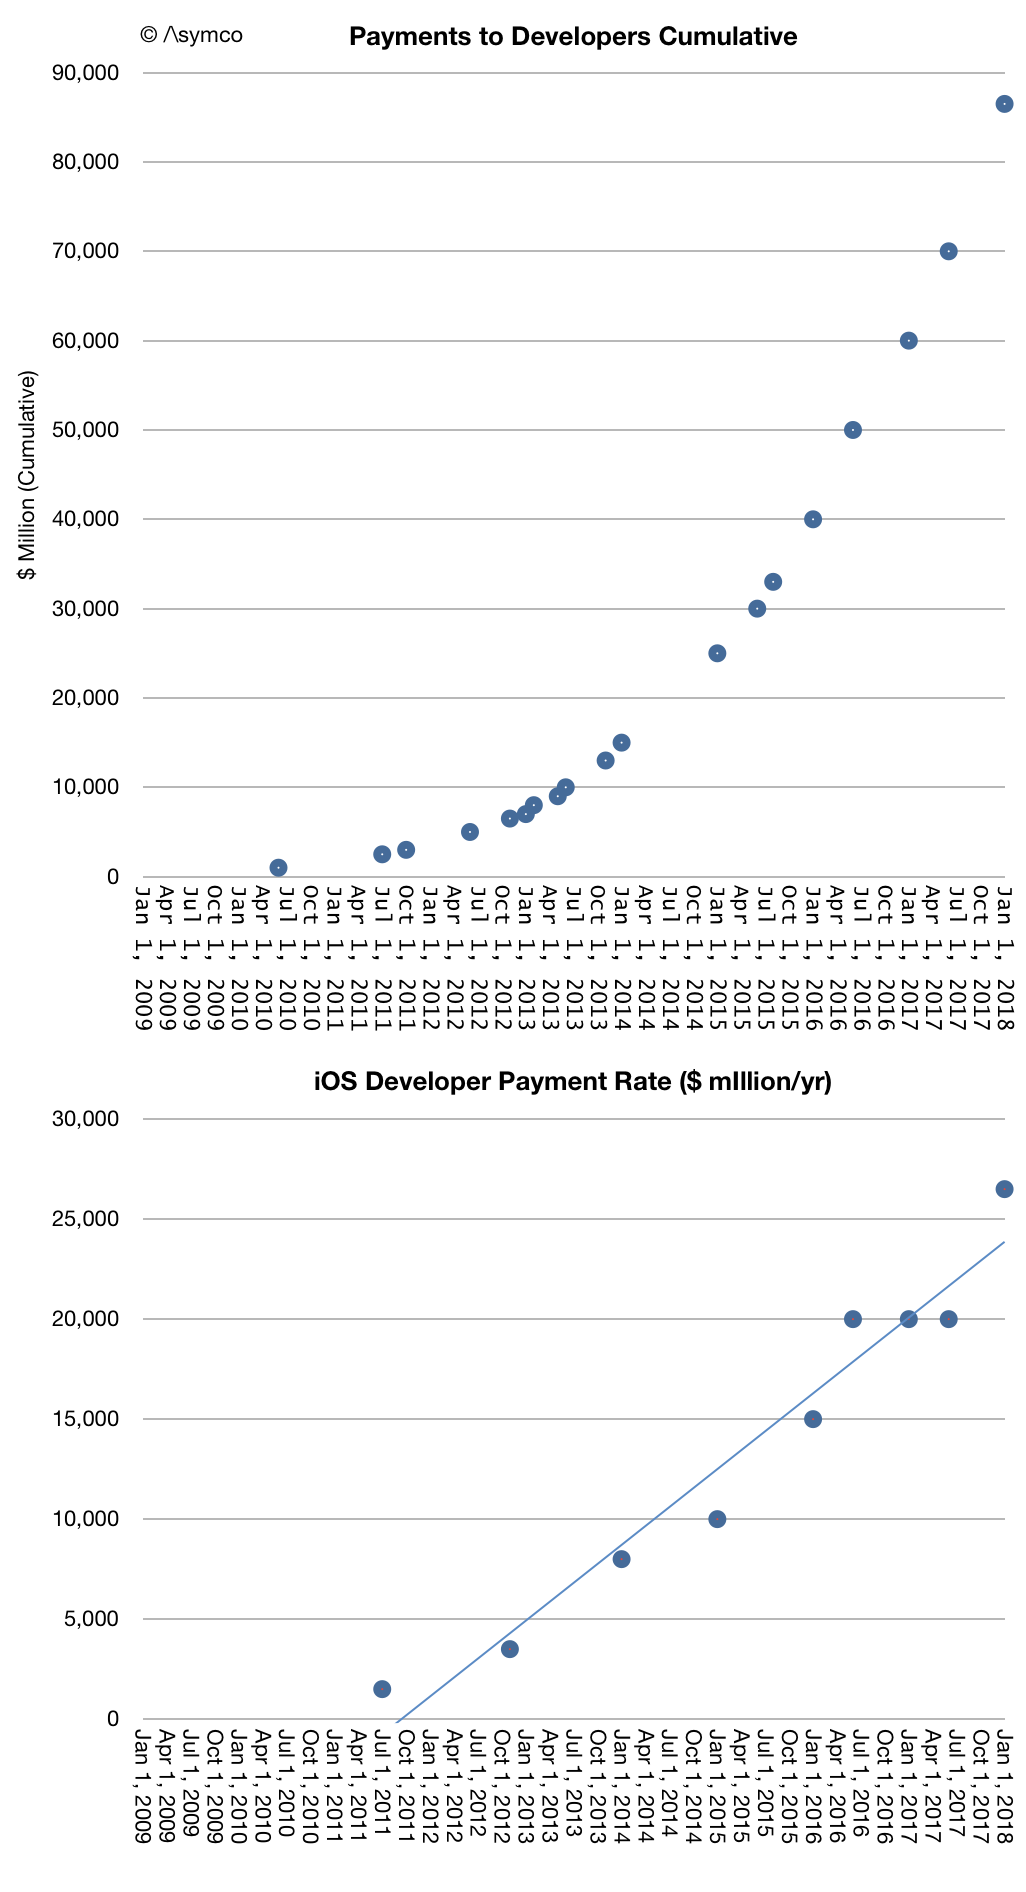
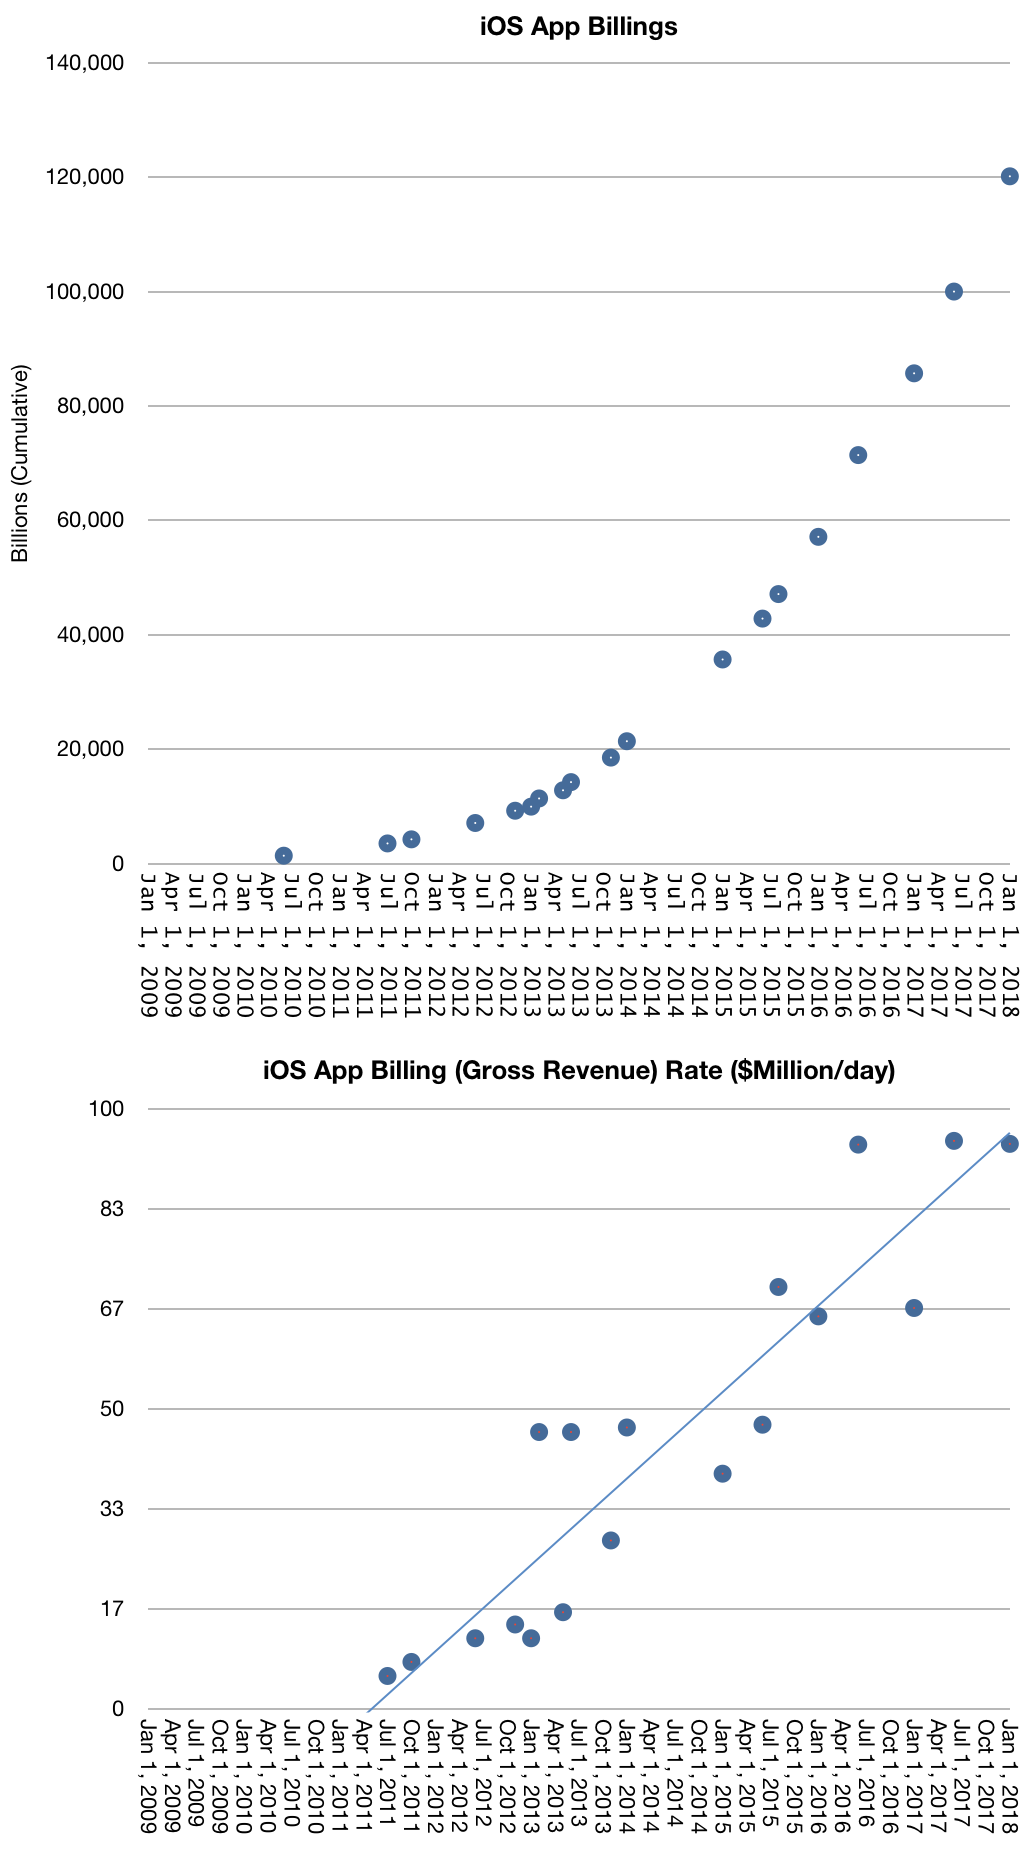
In its latest update on the App Store Apple reported that iOS developers earned $26.5 billion in 2017. A year ago the figure was $20 billion. The growth rate is then about 33%. The cumulative payments to developers can be calculated as $86.5 billion. This amount was generated in a span of less than 10 years, with the first billion paid by June 2010.
The following graph shows the history of cumulative payments and the corresponding payment rate (in $/yr.)
Note that this represents the payment to developers, not the spending by the customer. Apple keeps about 30% of the revenue. The total spending on the App Store is then about 43% higher. ((During the last year some types of app subscriptions have been priced by Apple at 15% of gross so I adjusted the payment rate to 72% for 2017)). The equivalent figures for spending on the App Store are shown below.
A few observations:
Developer payment rate is now above $25 billion/yr. I've been notified via Twitter that this is higher than the revenue of McDonald's Corporation in 2016.
During this year iOS users will be spending about $100 million per day for Apps. This was Google's AdWords revenue rate in 2012.
The spending on App Store has been rising steadily, adding about $5 billion/yr since mid 2011.
Apps are the biggest component of Apple services and helped that segment gross over $57 billion in 2017, passing Fortune 100 level (net of developer payments).
I've made comparisons before with the app business being bigger than the film industry (and much bigger than the music industry.) This was considering Android revenues and iOS combined as "app revenues".
As of this year the App Store alone will overtake Global Box Office revenues.
Of course this is only an observation of the scale of App Store rather than a judgement of the benefit obtained from either medium or the substitutability of one for the other. ((The substitutability of apps for movies is not to be discounted either. The analysis should be based on understanding the jobs the media are hired to do.)) The reason scale should be noted is that the App Store, and Apple services overall, is becoming one of the largest enterprises in the world. Even more importantly, it should be noted for its rate of growth.
Even when considering this, one should keep in mind that the figures of revenue and payments to developers are only a small fraction of the overall app economy. Apps sold to end users are a subset of all apps on the App Store. There are not only free apps but also many apps which are front-ends to complex services which are monetized in various indirect ways.
Facebook, Twitter, Linkedin, Tencent, YouTube, Pandora, Netflix, Google, Baidu, Instagram, Amazon, eBay, JD.com, Alibaba, Expedia, Tripadvisor, Salesforce, Uber, AirBnB and hundreds of others are all "free" apps enabling hundreds of billions of dollars of interaction none of which are captured in the App Store revenue data. The vast majority of activity for the top commerce, communications and media properties are now coming through mobile devices.
By weight of users and their propensity to engage, iOS enables about 50% to 60% of mobile economic activity.
Based on assumptions of revenue rates for mobile services and iOS share of engagement, my estimate of the economic activity on iOS for 2017 is about $180 billion. Including hardware sales, the iOS economy cleared about $380 billion in revenues 2017.
Additional assumptions around growth rates suggest that iOS economy will achieve the half trillion revenue rate in 2019. Valuing this, especially as a part of Apple's intrinsic value, is a challenge but it's probably worth doing. There are implications in the robustness or sustainability of the underlying business.
Since the iPhone launched 10 years ago, 1,253,000,000 units have been sold. ((This includes the current quarter that ends in 4 days)) Given that they don't last forever, we can assume that only the most recent units sold are still in use. If we measure just the units sold in the last 3 years, the total is about 663 million. Rounding down, we can say that there are perhaps 650 million iPhones in use.
Repeating the exercise for the iPad but extending time in use to 4.5 years, gives a population or install base of about 240 million.
That's a total base of 890 iOS million units, well below the 1 billion total "active devices" Apple reported in January 2016. The difference can be filled by Apple Watch, Apple TV, iPods and Macs.
Apple also reports that the iPhones get unlocked 80 times per day. That figure was also reported in early 2016. We don't have a figure for the iPad but I'm going to take a guess of 15 unlocks per day on average. Feel free to argue about these figures in the comments below.
Now, if each of these iOS devices would be unlocked using a 4-digit PIN, the time to bring them into use would be about 2 seconds. Expanding to a 6-digit PIN would probably increase that to perhaps 2.5 seconds (accounting also for failures due to input errors.)
Moving to 6 digits, although more secure, would add friction and hence time to the unlock process. This reminds me of the story of Steve Jobs arguing that decreasing boot times for the Macintosh would save lives. I wondered what would be the savings in time for speeding up the unlock process.
It turns out that, based on the installed base numbers, moving to the more secure 6-digit code would add 2.8 billion hours to the total time to unlock the world's iPhones and iPads. That's 321,000 years of waiting added for every year of use.
Fortunately we got Touch ID to replace PIN entry and the time to unlock the iPhone/iPad has decreased to perhaps 1 second, saving 5.6 billion hours of unlock time vs. 4-digit PIN.
Now we have the prospect of Face ID which promises to be faster still. Of course, it won't be available on all iOS devices for some time, but if it that base of 890 million iOS devices were to migrate to Face ID and if it took a mere 0.5 seconds to unlock, Face ID would save nearly 8.5 billion hours of time that otherwise would be spent typing unlock codes. ((Given this methodology one wonders how much time is spent using, rather than just unlocking, iOS devices. I'll leave that as an exercise to the reader.))
That's almost a million years.
That's 12,500 lifetimes.
I'm glad to see Steve's ideas continue to motivate Apple engineers.